Large forest fires in Canada, 1959â1997
Large forest fires in Canada, 1959â1997
Large forest fires in Canada, 1959â1997

Create successful ePaper yourself
Turn your PDF publications into a flip-book with our unique Google optimized e-Paper software.
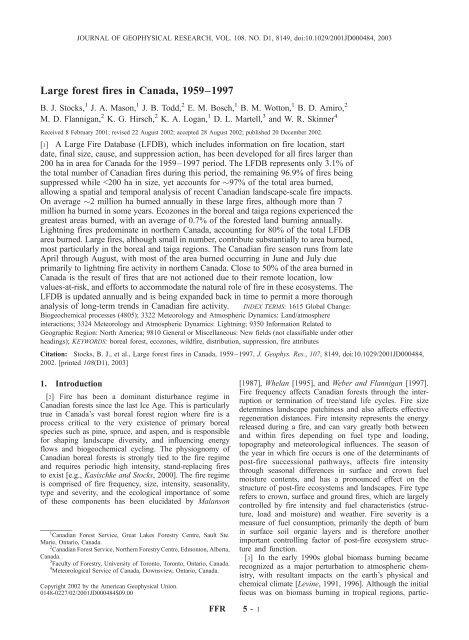
JOURNAL OF GEOPHYSICAL RESEARCH, VOL. 108. NO. D1, 8149, doi:10.1029/2001JD000484, 2003<strong>Large</strong> <strong>forest</strong> <strong>fires</strong> <strong>in</strong> <strong>Canada</strong>, 1959–1997B. J. Stocks, 1 J. A. Mason, 1 J. B. Todd, 2 E. M. Bosch, 1 B. M. Wotton, 1 B. D. Amiro, 2M. D. Flannigan, 2 K. G. Hirsch, 2 K. A. Logan, 1 D. L. Martell, 3 and W. R. Sk<strong>in</strong>ner 4Received 8 February 2001; revised 22 August 2002; accepted 28 August 2002; published 20 December 2002.[1] A <strong>Large</strong> Fire Database (LFDB), which <strong>in</strong>cludes <strong>in</strong>formation on fire location, startdate, f<strong>in</strong>al size, cause, and suppression action, has been developed for all <strong>fires</strong> larger than200 ha <strong>in</strong> area for <strong>Canada</strong> for the 1959–1997 period. The LFDB represents only 3.1% ofthe total number of Canadian <strong>fires</strong> dur<strong>in</strong>g this period, the rema<strong>in</strong><strong>in</strong>g 96.9% of <strong>fires</strong> be<strong>in</strong>gsuppressed while
FFR 5 - 2 STOCKS ET AL.: CANADIAN FOREST FIRESularly <strong>in</strong> association with population pressure-driven landuse change, this effort also drew attention to the formidabletask of quantify<strong>in</strong>g vegetation <strong>fires</strong> at a global scale. In thiscontext the 1990s brought an <strong>in</strong>creased emphasis on determ<strong>in</strong><strong>in</strong>gthe extent and impact of boreal <strong>fires</strong> [Stocks, 1991].The recent scientific consensus <strong>in</strong>dicates that climate changeimpacts will be most significant <strong>in</strong> the carbon-rich borealzone. This conclusion, coupled with the realization that fireactivity is extremely sensitive to weather/climate [Flanniganand Harr<strong>in</strong>gton, 1988; Johnson, 1992; Swetnam,1993], and that carbon dynamics <strong>in</strong> this region are drivenlargely by fire [Kurz and Apps, 1999], suggests that climatechange will lead to <strong>in</strong>creas<strong>in</strong>g fire occurrence and severity<strong>in</strong> the boreal zone, with resultant impacts on terrestrialcarbon cycl<strong>in</strong>g and storage. Recent model<strong>in</strong>g of potentialfuture fire activity us<strong>in</strong>g General Circulation Models suggeststhat significant <strong>in</strong>creases <strong>in</strong> fire occurrence andseverity are likely <strong>in</strong> west-central <strong>Canada</strong> and Siberia[Flannigan et al., 1998; Stocks et al., 1998; Flannigan etal., 2000]. Increases <strong>in</strong> fire season length [Wotton andFlannigan, 1993] and lightn<strong>in</strong>g activity [Price and R<strong>in</strong>d,1994] are also anticipated. These <strong>in</strong>teractions between fire,climate change and carbon buttress the need to developspatially-explicit databases of boreal fire <strong>in</strong> <strong>Canada</strong>, Russiaand Alaska. This is particularly true <strong>in</strong> the post-Kyoto world,where carbon account<strong>in</strong>g and negotiations on emissions willbe conducted <strong>in</strong> a transparent and mutually-<strong>in</strong>formed manner.Disturbance by fire is strongly recognized as affect<strong>in</strong>gglobal sources and s<strong>in</strong>ks of carbon dioxide, such thataccurate estimates of area burned are important for future<strong>in</strong>ternational agreements and account<strong>in</strong>g. Russian fire statisticshave not been accurately recorded <strong>in</strong> the past, andRussian fire activity post-1980 is currently be<strong>in</strong>g reconstructedthrough the use of remote sens<strong>in</strong>g [e.g., Cahoon etal., 1994, 1996; Stocks et al., 1996a; Kasischke et al., 1999].Canadian and Alaskan fire statistics had been recorded formany decades, with a spatial database of large Alaskan <strong>fires</strong>post-1940 be<strong>in</strong>g recently produced [Kasischke, 2000]. Howeverthe spatially- and temporally-explicit databases requiredto accurately illustrate fire activity <strong>in</strong> <strong>Canada</strong> had never beendeveloped.[4] Toward this end, an effort was <strong>in</strong>itiated <strong>in</strong> 1989 todevelop a database of all large <strong>fires</strong> (<strong>fires</strong> >200 hectares <strong>in</strong>area) <strong>in</strong> <strong>Canada</strong>. S<strong>in</strong>ce, on average, only 3% of allCanadian <strong>fires</strong> exceed 200 ha <strong>in</strong> size, yet these <strong>fires</strong> accountfor 97% of the area burned nationally [Stocks, 1991], arelatively small spatially- and temporally explicit databasecould be developed and used to represent and illustrateoverall national fire area burned impacts quite adequately.The Canadian <strong>Large</strong> Fire Data Base (LFDB) has been usedto estimate carbon loss from Canadian <strong>fires</strong>, both for the1980s [Stocks et al., 1996b] and for the 1959–1999 period[Amiro et al., 2001a]. This paper summarizes the developmentof the LFDB over the past decade, and providesanalyses of the area burned, frequency, size distribution,cause, seasonality for the post-1959 period aimed at generat<strong>in</strong>ga landscape-level picture of fire activity <strong>in</strong> <strong>Canada</strong>.[5] National <strong>forest</strong> fire statistics have been compileds<strong>in</strong>ce 1918 <strong>in</strong> <strong>Canada</strong>, but an extensive analysis of thisrecord is compromised by the fact that large regions of<strong>Canada</strong> were not monitored prior to satellite coverage <strong>in</strong> theearly 1970s. Deficiencies <strong>in</strong> the Canadian record wereemphasized <strong>in</strong> Murphy et al. [2000], with the acknowledgmentthat many prov<strong>in</strong>ces did not document <strong>fires</strong> <strong>in</strong> remotenorthern regions (British Columbia, Alberta, Saskatchewan,Manitoba, Ontario and Quebec) prior to the 1950s and1960s, and that the Northwest Territories and Newfoundlandonly began fire record-keep<strong>in</strong>g <strong>in</strong> the 1950s. OfficialCanadian fire occurrence and area burned statistics post-1920 have been analyzed previously [Van Wagner, 1988;Stocks, 1991; Stocks et al., 2001] with the general observationthat, us<strong>in</strong>g decadal averages, recorded fire numbershave <strong>in</strong>creased steadily over the last eight decades to8,000 <strong>fires</strong> annually dur<strong>in</strong>g the 1990s, while documentedarea burned decreased from the 1920s through the 1950s,and has <strong>in</strong>creased cont<strong>in</strong>ually s<strong>in</strong>ce, averag<strong>in</strong>g 2.75 millionhectares annually dur<strong>in</strong>g the 1990s. The <strong>in</strong>completenessof the Canadian fire record from 1920 to 1970 rema<strong>in</strong>sa barrier to a thorough analysis of longer-term trends <strong>in</strong>Canadian fire activity. Bear<strong>in</strong>g <strong>in</strong> m<strong>in</strong>d the deficiencies ofthe record prior to the 1970s, it is evident that the annualarea burned <strong>in</strong> <strong>Canada</strong> fluctuates greatly from year-to-year,primarily driven by the frequency and geographical extentof extreme fire weather/danger conditions, but it is alsoapparent that lower area burned statistics existed prior to1970. Given these uncerta<strong>in</strong>ties, the sudden <strong>in</strong>crease <strong>in</strong> areaburned s<strong>in</strong>ce that time cannot be positively seen as a signthat fire danger levels are generally <strong>in</strong>creas<strong>in</strong>g, or that adef<strong>in</strong>itive climate change signal is <strong>in</strong>volved. Increases <strong>in</strong>fire activity <strong>in</strong> recent decades are likely the result ofexpanded <strong>forest</strong> use <strong>in</strong> comb<strong>in</strong>ation with an <strong>in</strong>creased firedetection/monitor<strong>in</strong>g capability. Regardless, the annual areaburned <strong>in</strong> <strong>Canada</strong> cont<strong>in</strong>ues to fluctuate significantly fromyear-to-year, and has varied by more than an order ofmagnitude (0.3 million ha <strong>in</strong> 1978 to 7.5 million ha <strong>in</strong>1995) over the last three decades when coverage anddocumentation was reasonably complete [Stocks et al.,2001]. Recent studies of area burned trends clearly showedthe importance of large <strong>fires</strong> <strong>in</strong> <strong>Canada</strong> [Harr<strong>in</strong>gton, 1982;Weber and Stocks, 1998]. Harr<strong>in</strong>gton et al. [1983] foundthat components of the Canadian Fire Weather Index (FWI)System [Van Wagner, 1987] were correlated to monthlyprov<strong>in</strong>cial area-burned <strong>in</strong> <strong>Canada</strong> 1953–80. Flannigan andHarr<strong>in</strong>gton [1988] found that long periods with dailyprecipitation less than 1.5 mm of ra<strong>in</strong> were correlated withmonthly prov<strong>in</strong>cial area-burned <strong>in</strong> <strong>Canada</strong> 1953–80. Areaburned by <strong>forest</strong> fire is determ<strong>in</strong>ed by a complex set ofvariables <strong>in</strong>clud<strong>in</strong>g the extent of the <strong>forest</strong>, the topography,the presence or absence of lakes and roads, fuel characteristics,season, latitude, fire management organizational sizeand efficiency, fire site accessibility, the number of simultaneous<strong>fires</strong> and the weather.[6] Organized <strong>forest</strong> fire management began <strong>in</strong> <strong>Canada</strong> <strong>in</strong>the early decades of the 1900s after numerous catastrophicwild<strong>fires</strong>, and with the <strong>in</strong>itial philosophy that fire wasdestructive and should be elim<strong>in</strong>ated to enhance publicsafety, protect property, and permit proper <strong>forest</strong> management.Expanded use of the Canadian boreal zone, for both<strong>in</strong>dustrial and recreational purposes, resulted <strong>in</strong> a concurrent<strong>in</strong>crease <strong>in</strong> both fire occurrence and the fire managementcapability mobilized to address this problem. Canadianprov<strong>in</strong>cial and territorial fire management agencies arecurrently among the most modern worldwide and, throughfire prevention and suppression, have generally succeeded
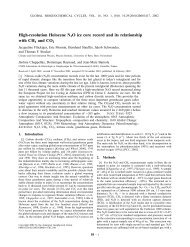
STOCKS ET AL.: CANADIAN FOREST FIRES FFR 5 - 3Figure 1.Ecozone boundaries and geographical distribution of 1959–1997 LFDB <strong>fires</strong> across <strong>Canada</strong>.<strong>in</strong> progressively reduc<strong>in</strong>g fire impacts <strong>in</strong> <strong>in</strong>tensively protected<strong>forest</strong>s over the past 70 years [Stocks and Simard,1993]. However, the grow<strong>in</strong>g realization that exclud<strong>in</strong>g fireis neither economically possible nor ecologically desirable,coupled with constra<strong>in</strong>ed budgets and a grow<strong>in</strong>g awarenessof the benefits of natural fire to Canadian <strong>forest</strong> ecosystems,is lead<strong>in</strong>g toward a balanced approach to fire managementthat weighs the protection of human life, property and<strong>in</strong>dustrial timber supply aga<strong>in</strong>st the necessity of periodicwildfire.2. Methods2.1. Database Construction[7] Beg<strong>in</strong>n<strong>in</strong>g <strong>in</strong> 1989, <strong>in</strong>dividual wildfire reports for<strong>fires</strong> larger than 200 ha were collected from all Canadianfire management agencies (ten prov<strong>in</strong>cial, two territorial,and Parks <strong>Canada</strong>) for the post-1980 period. Over a periodof time these <strong>fires</strong> were digitized and mapped <strong>in</strong> a GeographicalInformation System (GIS), with the databaseconta<strong>in</strong><strong>in</strong>g spatial polygons for each fire, along with support<strong>in</strong>gattribute <strong>in</strong>formation (location, start date, f<strong>in</strong>al <strong>fires</strong>ize, cause, and suppression action). This database was used<strong>in</strong> an analysis of the distribution and characteristics of largeCanadian <strong>fires</strong> dur<strong>in</strong>g the 1980s [Stocks et al., 1996b].[8] In recent years the LFDB has been expanded to<strong>in</strong>clude all large <strong>fires</strong> back to the start of record-keep<strong>in</strong>gfor all Canadian agencies. In some cases this extends as farback as 1918, but a cont<strong>in</strong>uous national record is onlyavailable from the 1950s when statistical record-keep<strong>in</strong>gbegan <strong>in</strong> Newfoundland and the Northwest Territories.Maps for these pre-1980 <strong>fires</strong> are still <strong>in</strong> the process ofbe<strong>in</strong>g digitized, and a complete polygon record is some timeaway. However, attribute <strong>in</strong>formation is complete for allLFDB <strong>fires</strong>, and permits a national analysis for the 1959–1997 period.[9] It is recognized that the LFDB is not without somelimitations. Estimates of the area burned by each fire are theresult of aerial mapp<strong>in</strong>g or analysis of satellite imagery, andit is thought that more recent fire size estimates tend to bemore accurate, tak<strong>in</strong>g <strong>in</strong>to account the larger unburnedislands with<strong>in</strong> <strong>fires</strong>, and provid<strong>in</strong>g more detailed perimetermapp<strong>in</strong>g. As mentioned earlier, many <strong>fires</strong> <strong>in</strong> more remotenorthern regions of some jurisdictions (particularly Quebec,
FFR 5 - 4 STOCKS ET AL.: CANADIAN FOREST FIRESTable 1. Area Burned (ha) by LFDB Fires by Ecozone and Years for the 1959–1997 Period, Average Area Burned (AAB), and Percent Annual Area Burned (PAAB) by EcozonesYearSouthernArcticTaigaPla<strong>in</strong>sTaigaShield WestTaigaShield EastBorealShield WestBorealShield EastAtlanticMaritimeMixedWood Pla<strong>in</strong>sBorealPla<strong>in</strong>s PrairiesTaigaCordilleraBorealCordilleraPacificMaritimeMontaneCordilleraHudsonPla<strong>in</strong>s Total1959 0 76710 1360 0 14623 25601 23735 0 55913 0 8496 43342 0 28343 0 2781241960 0 11203 37923 0 331073 27387 29940 445 34495 243 7432 1777 2596 100435 0 5849501961 0 184872 178264 8015 737203 417927 2002 0 750301 39783 0 161534 14363 257666 6219 27581491962 0 19952 2245 0 11775 103707 0 4047 58317 364 9058 13110 1010 3272 93242 3200991963 0 15668 5052 1295 56370 37319 2158 940 14324 11987 5606 11827 1174 1028 606 1653531964 0 5430 178860 513 658954 91352 366 212 167501 11162 0 906 0 0 18226 11334821965 0 27544 486 0 5528 5428 1306 217 72322 4525 5538 48178 5005 22300 0 1983771966 2592 129833 98774 0 16874 10319 0 364 25318 324 1015 197663 473 682 0 4842311967 0 39206 5759 23829 138170 89425 0 0 64920 3895 10278 114144 8925 69509 0 5680611968 35148 189501 4065 24710 16297 465990 4107 0 471358 4592 0 16831 501 3381 12944 12494251969 0 493047 23053 6954 84127 1158 557 0 31247 0 124064 614521 2205 19561 0 14004931970 0 71015 248674 21142 796076 6696 1012 0 212349 246 0 24303 2402 44881 0 14287951971 0 423522 462353 0 90230 240703 0 0 212799 1389 33816 315490 6565 101386 27850 19161031972 4147 215335 36345 10951 192038 54633 0 0 58849 640 26614 42899 3398 2354 75621 7238251973 1260 202233 272697 85846 386532 3203 0 0 25739 2080 0 869 672 24563 6066 10117591974 1367 15635 8344 103337 673146 46918 0 0 17819 5200 1799 1631 348 9921 6368 8918341975 0 490196 95721 21316 126889 191648 386 859 7961 600 17250 10559 0 2471 4937 9707951976 900 298088 388810 163611 630201 508251 0 0 74718 910 2084 55637 0 752 19871 21438351977 0 160567 131055 243 442724 50797 0 0 201836 38180 264163 47427 0 1144 29785 13679191978 0 7081 77380 1036 96366 6473 908 0 23430 243 4655 31208 5302 7251 0 2613341979 8100 1162904 1477906 1003 255508 33621 0 0 146355 445 6320 2618 1841 8678 1405 31067041980 0 1088012 374726 8142 1882570 19459 2631 0 1177379 53993 2415 157366 0 6650 7522 47808641981 0 1271717 211647 58082 2265983 93869 0 0 2059778 1800 0 48608 862 15996 60661 60890021982 0 464511 94913 26267 66654 12461 5339 0 481812 0 26226 526219 785 9448 0 17146361983 0 219578 15698 316737 556624 629838 590 0 25069 3695 13090 75757 0 20909 102649 19802341984 0 101925 51206 2352 392957 8912 0 0 99884 32425 7182 11145 0 4869 1752 7146071985 0 15823 210029 138498 74321 50087 1701 0 24792 0 3359 204441 4499 95233 0 8227831986 304 311914 5759 14197 147742 283409 37417 0 7339 0 37646 70265 1248 5559 5037 9278361987 10067 413639 32158 4970 361026 47036 2179 0 112191 2375 29806 608 2586 21023 2486 10421511988 1868 62277 12186 248687 809402 31979 1632 0 99410 12427 3726 1460 0 4397 15493 13049431989 1490 263712 754493 2056356 2762381 25588 0 0 829875 2725 48283 327784 2286 7427 458072 75404721990 0 119177 13234 38891 263705 40627 7179 0 136340 1330 97971 95336 7809 3745 69345 8946881991 2750 17909 387439 68554 393094 417959 3477 277 66844 12830 7786 113914 0 11114 52268 15562151992 0 2050 188145 6783 405849 36629 4803 0 28881 400 6608 50359 353 5424 89588 8258721993 850 848930 98804 48620 459811 105429 304 0 358140 0 25741 23233 0 0 801 19706641994 1555 1633382 2915469 212146 823095 9471 0 0 15560 0 81585 380042 592 11358 38535 61227901995 0 3001420 9641 199321 1999246 289053 26475 0 1202198 0 0 300711 1003 2632 255250 72869491996 0 204638 248758 313536 477511 381922 1315 0 14775 0 9942 58652 0 435 98917 18104021997 0 13200 60690 72332 9834 345966 0 0 1321 2766 0 10714 0 3126 14556 534504Total 72397 14293356 9420121 4308271 19912508 5248249 161518 7361 9469459 253574 929557 4213088 78804 938924 1576071 70883261AAB 1856 366496 241542 110468 510577 134570 4141 189 242807 6502 23835 108028 2021 24075 40412 1817520PAAB 0.057% 0.702% 0.763% 0.241% 0.761% 0.145% 0.023% 0.006% 0.418% 0.047% 0.202% 0.392% 0.013% 0.058% 0.123%
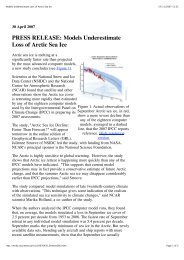
STOCKS ET AL.: CANADIAN FOREST FIRES FFR 5 - 5Figure 2. LFDB (<strong>fires</strong> >200 ha) and official (all <strong>fires</strong>) annual fire numbers and area burned for <strong>Canada</strong>1959–1997.Ontario, Manitoba, Saskatchewan, and the Northwest Territories)that occurred between 1959 and the mid-1970s areundoubtedly miss<strong>in</strong>g from this analysis. National air photographyarchives are be<strong>in</strong>g used <strong>in</strong> an attempt to improvethis situation. F<strong>in</strong>ally, fire reports for the 1970s <strong>in</strong> Saskatchewanhave been lost after digitiz<strong>in</strong>g, and the only recordavailable is for the polygons of <strong>fires</strong> >1000 ha. Attributesfor these <strong>fires</strong>, other than location, year and size, are spottywith<strong>in</strong> and between years.[10] Fire data were analyzed by Canadian ecozones orecoregions, rather than prov<strong>in</strong>ces/territories, us<strong>in</strong>g the classificationsystem developed by the Ecological StratificationWork<strong>in</strong>g Group [1995]. Ecozones are shown <strong>in</strong> Figure 1.Only <strong>forest</strong> fire data are <strong>in</strong>cluded <strong>in</strong> this analysis. Agriculturaland rangeland <strong>fires</strong> are not well-documented and havebeen excluded. Ecozone/ecoregion level analysis <strong>in</strong>corporatesclimate and vegetation to some degree, better reflect<strong>in</strong>gthe cont<strong>in</strong>uity of the landscape, but does not takeprov<strong>in</strong>cial fire management policies <strong>in</strong>to consideration.For this analysis, the Taiga Shield and Boreal ShieldEcozones have been separated <strong>in</strong>to west and east components,based on climate and fire activity disparities.2.2. Data Analysis[11] For the 1959–1997 period the LFDB conta<strong>in</strong>s attributedata for a total of 10,448 Canadian <strong>fires</strong>. A very smallpercentage of LFDB <strong>fires</strong> have some miss<strong>in</strong>g attributes, sothe numbers used <strong>in</strong> each of the follow<strong>in</strong>g analyses varyslightly.[12] The Annual Area Burned (AAB) calculated for<strong>in</strong>dividual ecozones and ecoregions was determ<strong>in</strong>ed bytotall<strong>in</strong>g the area burned with<strong>in</strong> an ecozone over the1959–1997 period and divid<strong>in</strong>g by 39. This number wasthen divided aga<strong>in</strong> by the <strong>forest</strong>ed area with<strong>in</strong> each ecozoneand multiplied by 100 to determ<strong>in</strong>e the Percent Annual AreaBurned (PAAB). Forested areas (which exclude lakes andlarge non-fuel areas) were derived from the National ForestInventory Database of the Canadian Forest Service.[13] Fire causes were listed for almost all <strong>fires</strong> except formiss<strong>in</strong>g Saskatchewan data for 1972–1975, which wereconsidered lightn<strong>in</strong>g-caused. For this analysis the smallnumber of <strong>fires</strong> <strong>in</strong> other prov<strong>in</strong>ces/territories listed with an‘‘unknown’’ cause were assumed to be human-caused.[14] The ignition date was available for all LFDB <strong>fires</strong>and was used to <strong>in</strong>vestigate the seasonal trends <strong>in</strong> nationalfire activity. Both fire numbers and area burned werecompiled by 10 or 11 day periods for all lightn<strong>in</strong>g- andhuman-caused <strong>fires</strong>.[15] Not all <strong>fires</strong> are actioned (i.e., suppression attempted)<strong>in</strong> <strong>Canada</strong>. Most <strong>fires</strong> are identified if they received somesuppression action, although the level of suppression ishighly variable. For this analysis of actioned and nonactioned<strong>fires</strong> all LFDB <strong>fires</strong> <strong>in</strong> British Columbia andAlberta were considered actioned, based on policies thatexisted <strong>in</strong> these prov<strong>in</strong>ces dur<strong>in</strong>g the study period, while1970–1979 Saskatchewan <strong>fires</strong> were considered nonactioned.3. Results and Discussion3.1. Number of Fires and Area Burned[16] The annual area burned by Canadian ecozones forthe 1959–1997 period is summarized <strong>in</strong> Table 1. Clearly,the largest areas burned occur <strong>in</strong> the boreal/taiga shield andpla<strong>in</strong>s regions of <strong>Canada</strong>, particularly <strong>in</strong> the large TaigaPla<strong>in</strong>s, Taiga Shield West/East, Boreal Shield West/East andBoreal Pla<strong>in</strong>s ecozones, which account for 88% of the totalarea burned over the 39-year period. These ecozones conta<strong>in</strong>large areas where values-at-risk generally do notwarrant aggressive fire suppression, and the majority of
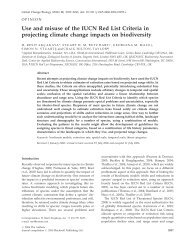
FFR 5 - 6 STOCKS ET AL.: CANADIAN FOREST FIRESFigure 3. LFDB percent annual area burned (PAAB) distribution across <strong>Canada</strong> for 1959–1997 periodby ecoregions.Figure 4. LFDB percent annual area burned (PAAB), and fire occurrence and area burned by fire sizeclasses for Canadian ecozones.
STOCKS ET AL.: CANADIAN FOREST FIRES FFR 5 - 7Table 2. Mean LFDB Annual Area Burned (ha) by Fire Size Classes and Ecozones aSize Class 1 2 3 4 5 6 7 8 9 TotalSA 27 166 276 278 208 0 901 0 0 1856TP 2122 3182 5909 16091 22383 36688 60706 51379 168036 366496TSW 1879 3235 5810 16601 21298 29692 57262 41682 64081 241542TSE 876 1255 2364 6186 7473 13147 22560 18611 37996 110468BSW 6606 8439 15430 39632 53508 70240 134644 76267 105812 510577BSE 3101 3180 4981 11281 12851 19791 26415 22372 30599 134570AM 284 421 522 923 178 1221 594 0 0 4141MP 61 24 0 104 0 0 0 0 0 189BP 5264 5210 7852 12656 17073 20259 34614 43561 96318 242807P 377 575 744 1314 983 868 1640 0 0 6502TC 413 658 1129 3841 3159 4199 3965 1582 4888 23835BC 1301 2201 3273 11237 15563 20718 31828 7560 14347 108028PM 550 446 451 418 156 0 0 0 0 2021MC 2729 2601 3290 6282 3625 3659 1889 0 0 24075HP 618 761 1125 4196 4207 4573 9562 12164 3205 40412National 26206 32354 53158 131041 162665 225054 386580 275178 525283 1817520a 1997–1959 = 39 years. Size classes (ha) are as follows: 1, 200 – 500; 2, 500 – 1,000; 3, 1,000 – 2,000; 4, 2,000 – 5,000; 5, 5,000 –10,000; 6, 10,000 – 20,000; 7, 20,000 – 50,000; 8, 50,000 – 100,000; and 9, 100,000+.<strong>fires</strong> are allowed to burn naturally. This, coupled with themore cont<strong>in</strong>ental climate and generally more extreme firedanger conditions <strong>in</strong> these regions of <strong>Canada</strong> largelyexpla<strong>in</strong>s the greater areas burned <strong>in</strong> these ecozones. Higharea burned rates are also evident <strong>in</strong> the Taiga and BorealCordillera ecozones, while all other ecozones exhibit significantlyless large fire activity, primarily due to <strong>in</strong>tensivelevels of fire protection and/or generally less severe fireweather and fuel conditions.[17] The distribution of all LFDB <strong>fires</strong> for the 1959–1997period, along with ecozone boundaries, is shown <strong>in</strong> Figure 1.Once aga<strong>in</strong> the concentration of large fire activity <strong>in</strong> theBoreal and Taiga Ecozones is quite evident, as is thenorthwest/southeast distribution of <strong>fires</strong> across the Canadianboreal zone. Relatively low fire activity is also observed <strong>in</strong>southern <strong>Canada</strong>, particularly <strong>in</strong> south/central Ontario, theMaritime prov<strong>in</strong>ces, and coastal British Columbia. Very few<strong>fires</strong> occur <strong>in</strong> the tundra and mounta<strong>in</strong>ous regions of northern<strong>Canada</strong> due to a lack of fuel cont<strong>in</strong>uity. Note that thevalues <strong>in</strong> Table 1 are slightly different than those reportedby Amiro et al. [2001a] due to some recent updates <strong>in</strong> theLFDB.[18] The number of <strong>fires</strong> and area burned for both theofficial Canadian statistics and the LFDB are shown <strong>in</strong>Figure 2 for the 1959–1997 period. One would expect theannual LFDB area burned totals to be somewhat less thanthe published official record, as only <strong>fires</strong> >200 ha arerepresented <strong>in</strong> this database. However, <strong>in</strong> many years, mostnoticeably dur<strong>in</strong>g the late 1960s, the 1970s, and the early1980s, the area burned <strong>in</strong> the LFDB exceeds that <strong>in</strong> theofficial statistics. This is primarily due to the fact that large<strong>fires</strong> burn<strong>in</strong>g outside the <strong>in</strong>tensive protection zone <strong>in</strong>Quebec were not <strong>in</strong>cluded <strong>in</strong> national statistical summariesdur<strong>in</strong>g this period. The Quebec M<strong>in</strong>istry of Natural Resourcesis currently review<strong>in</strong>g fire reports and digitiz<strong>in</strong>g firemaps for many of these previously unreported <strong>fires</strong>, andthey have been added to the LFDB. In addition, the largerarea burned figures <strong>in</strong> the LFDB for 1995 are the result ofmore recent and accurate data report<strong>in</strong>g from Saskatchewan.[19] Dur<strong>in</strong>g the 1959–1997 period official Canadianstatistics [e.g., Higg<strong>in</strong>s and Ramsey, 1992; Canadian Councilof Forest M<strong>in</strong>isters, 1997] report a total of 332,467 <strong>fires</strong>burn<strong>in</strong>g over an area of 68,369, 752 ha. The LFDB numbersfor this period are 10,448 <strong>fires</strong> (i.e. 3.1% of the totalnumber) and a total area burned of 71,016,759 ha. A total of77 <strong>fires</strong> (totall<strong>in</strong>g 133,498 ha) <strong>in</strong> the LFDB lacked alocation, so were not used <strong>in</strong> the ecozone analyses <strong>in</strong> thispaper. Given the revised statistics from Quebec, the LFDBnumbers represent the best estimate of area burned <strong>in</strong><strong>Canada</strong> post-1959, although it is recognized that <strong>fires</strong>
FFR 5 - 8 STOCKS ET AL.: CANADIAN FOREST FIRESFigure 5.LFDB lightn<strong>in</strong>g and human-caused fire distribution by decades.
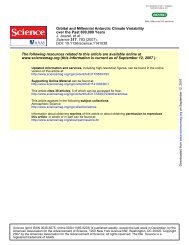
STOCKS ET AL.: CANADIAN FOREST FIRES FFR 5 - 9Figure 6. LFDB lightn<strong>in</strong>g and human-caused fire numbers and area burned by ecozones 1959–1997(ecozone code names given <strong>in</strong> legend of Figure 1).burned numbers by size class and ecozone are listed <strong>in</strong>Table 2. Generally speak<strong>in</strong>g, the number of <strong>fires</strong> decreaseswith <strong>in</strong>creas<strong>in</strong>g size class while the contribution to overallarea burned <strong>in</strong>creases, with a relatively small number oflarger <strong>fires</strong> <strong>in</strong>fluenc<strong>in</strong>g area burned significantly. This is trueat a national level, and particularly <strong>in</strong> all boreal and taigaecozones with a high degree of large fire activity. Forexample, at a national scale 31% of LFDB <strong>fires</strong> fall <strong>in</strong> the200–500 ha size class yet account for only 1.4% of the areaburned, while the 2.5% of <strong>fires</strong> exceed<strong>in</strong>g 50,000 harepresent 44% of the area burned. Some ecozones <strong>in</strong> southern<strong>Canada</strong> experience large <strong>fires</strong> <strong>in</strong>frequently or not at all,primarily due to more <strong>in</strong>tensive protection and less severefire weather.3.4. Fire Cause[23] The geographical distribution of lightn<strong>in</strong>g- andhuman-caused <strong>fires</strong> across <strong>Canada</strong> by decades is illustrated<strong>in</strong> Figure 5. Lightn<strong>in</strong>g <strong>fires</strong> predom<strong>in</strong>ate <strong>in</strong> all decades, andaccount for virtually all large <strong>fires</strong> <strong>in</strong> northern ecozones.Human-caused <strong>fires</strong> tend to occur, as expected, <strong>in</strong> the morepopulated and southerly regions of the country. The absenceof large <strong>fires</strong> <strong>in</strong> some northern regions <strong>in</strong> the 1960s,particularly northwestern Ontario and northern Quebec/Labrador, regions that exhibit high levels of fire activity<strong>in</strong> subsequent decades, is almost certa<strong>in</strong>ly a reflection of alack of complete fire monitor<strong>in</strong>g at that time. In the 1960ssignificant fire activity is evident <strong>in</strong> southern Quebec withvery few large <strong>fires</strong> to the north. However, this trend wasreversed by the 1980s and has been ma<strong>in</strong>ta<strong>in</strong>ed s<strong>in</strong>ce. Inaddition, prior to the advent of lightn<strong>in</strong>g detection systems<strong>in</strong> the 1970s it is likely that some lightn<strong>in</strong>g-caused <strong>fires</strong>were misidentified as <strong>fires</strong> caused by humans. A moredetailed analysis of the basel<strong>in</strong>e data used to constructFigure 5 shows that over the 1959–1997 period 72% ofall LFDB <strong>fires</strong> were caused by lightn<strong>in</strong>g, with these <strong>fires</strong>account<strong>in</strong>g for 85% of the total area burned. Decadaltrends show the <strong>in</strong>creas<strong>in</strong>g contribution of lightn<strong>in</strong>g <strong>fires</strong> tonational area burned over time, with the percentage oflightn<strong>in</strong>g <strong>fires</strong> <strong>in</strong> the LFDB ris<strong>in</strong>g - 53% <strong>in</strong> the 1960s,71% <strong>in</strong> the 1970s, 78% <strong>in</strong> the 1980s to 86% <strong>in</strong> the 1990s. Atthe same time the relative area burned by lightn<strong>in</strong>g<strong>in</strong>creased as well - 55% <strong>in</strong> the 1960s, 87% <strong>in</strong> the 1970s,88% <strong>in</strong> the 1980s to 94% <strong>in</strong> the 1990s. This steadyproportional <strong>in</strong>crease is likely due to an expanded firedetection and monitor<strong>in</strong>g capability <strong>in</strong> northern regions of<strong>Canada</strong> s<strong>in</strong>ce the mid-1970s, along with improved managementof human-caused <strong>fires</strong> through prevention and aggressive<strong>in</strong>itial attack.[24] The total number of lightn<strong>in</strong>g- and human-caused<strong>fires</strong> and area burned by ecozones for the 1959–1997period are shown <strong>in</strong> Figure 6. This supports the visualrepresentation <strong>in</strong> Figure 5 that lightn<strong>in</strong>g <strong>fires</strong> predom<strong>in</strong>ate <strong>in</strong>northern <strong>Canada</strong>.3.5. Seasonality[25] The Canadian <strong>forest</strong> fire season generally beg<strong>in</strong>s <strong>in</strong>April <strong>in</strong> the southern regions of the country, and cont<strong>in</strong>uesthrough mid-October, although the season can be longer <strong>in</strong>British Columbia and parts of Alberta. The temporal distributionof fire occurrence and area burned throughout thefire season, by 10–11 day <strong>in</strong>crements, is illustrated <strong>in</strong>Figure 7 for the 1959–1997 period. Human-caused fireactivity dom<strong>in</strong>ates fire numbers dur<strong>in</strong>g the April–Mayperiod, and dur<strong>in</strong>g the fall, with lightn<strong>in</strong>g fire numberstak<strong>in</strong>g over dur<strong>in</strong>g the late spr<strong>in</strong>g and summer period. Asexpected the seasonal trend <strong>in</strong> area burned is dom<strong>in</strong>ated bylightn<strong>in</strong>g <strong>fires</strong> dur<strong>in</strong>g the summer months. This is entirelyconsistent with the development of the Canadian <strong>fires</strong>eason, with fire activity beg<strong>in</strong>n<strong>in</strong>g later <strong>in</strong> the season withmovement northward, and supports Harr<strong>in</strong>gton [1982] whofound May as the most active fire month <strong>in</strong> Alberta, whilethe rest of the country below 60°N latitude reported mostfire activity <strong>in</strong> June, with the Northwest Territories experienc<strong>in</strong>gpeak fire activity <strong>in</strong> July.3.6. Degree of Suppression Action on Fires[26] Not all Canadian <strong>fires</strong> receive suppression action.The LFDB conta<strong>in</strong>s some attribute <strong>in</strong>formation on whethera given fire was actioned, but the level of action is highlyvariable, rang<strong>in</strong>g from limited protection of a few remotecab<strong>in</strong>s to deployment of major resources dur<strong>in</strong>g a largecampaign fire where there are many values at risk. Inaddition, the LFDB only <strong>in</strong>cludes <strong>fires</strong> greater than 200 ha
FFR 5 - 10 STOCKS ET AL.: CANADIAN FOREST FIRESFigure 7. LFDB human-caused and lightn<strong>in</strong>g fire numbersand area burned (%) throughout the April–Octoberperiod.<strong>in</strong> f<strong>in</strong>al size, so smaller <strong>fires</strong> that may have grown <strong>in</strong> theabsence of effective suppression are not <strong>in</strong>cluded. Therefore,a division of LFDB <strong>fires</strong> between those actioned andnon-actioned cannot be used as a measure of suppressioneffectiveness. However, the categories do show the spatialdistribution of actions on Canadian <strong>fires</strong> (Figure 8). Most ofthe non-actioned <strong>fires</strong> are <strong>in</strong> remote areas where access ispoor, timber harvest<strong>in</strong>g is limited, and communities aresparse. They are mostly caused by lightn<strong>in</strong>g <strong>in</strong> the northernpart of the country (compare Figure 8 and Figure 5). Exceptfor protection of communities, some Canadian fire managementagencies have zones del<strong>in</strong>eated for fire actions (e.g.<strong>in</strong>tensive and extensive protection zones), and these can begenerally seen <strong>in</strong> Figure 8 by the division between the twoaction classes. In some areas, these zones have changedover time. The action category had not been identified forabout 12% of the burned area <strong>in</strong> the LFDB and these <strong>fires</strong>have been classified based on their location <strong>in</strong> certa<strong>in</strong> firezones, or whether a certa<strong>in</strong> agency has a uniform policy forsuppression activities. For the 1959–97 period, 50% ofthe area burned, or an annual average of 860,000 ha, wasby non-actioned <strong>fires</strong>. Non-actioned <strong>fires</strong> that occur <strong>in</strong> aregion zoned for no suppression (except for protect<strong>in</strong>g aspecific value such as a community) reflect a natural fireregime. Given the previously stated caveats, the picture thatemerges illustrates the geographical impact of fire managementand other land use and management changes <strong>in</strong>general <strong>in</strong> <strong>Canada</strong>. Suppression action is generally takenmore often on <strong>fires</strong> <strong>in</strong> the lower boreal zone, while valuesat-riskgenerally dictates that more northerly <strong>fires</strong> oftenreceive little or no suppression, and fire is allowed toassume its natural role.Figure 8. Geographical distribution of LFDB actioned and non-actioned <strong>fires</strong> across <strong>Canada</strong> for the1959–1997 period.
STOCKS ET AL.: CANADIAN FOREST FIRES FFR 5 - 114. Conclusions[27] A LFDB of <strong>forest</strong> <strong>fires</strong> larger than 200 ha <strong>in</strong> area hasbeen developed for <strong>Canada</strong>. The present LFDB is reasonablycomplete for the 1959 to 1997 period, and is be<strong>in</strong>gextended to <strong>in</strong>clude more recent data as they becomeavailable. In addition, pre-1959 data are be<strong>in</strong>g compiledfor most of the country, although there are some miss<strong>in</strong>gregions and the older statistics are less certa<strong>in</strong>. This databaseconta<strong>in</strong>s only a small fraction of the <strong>fires</strong> that occur <strong>in</strong><strong>Canada</strong>, so should not be <strong>in</strong>terpreted as a reflection of theCanadian approach to fire management. This approachresults <strong>in</strong> the suppression of 97% of Canadian <strong>fires</strong> <strong>in</strong>the <strong>in</strong>terest of protect<strong>in</strong>g human life, property and <strong>forest</strong>resources. However, the economics and ecology of <strong>fires</strong>uppression dictate that natural fire should play a majorrole <strong>in</strong> boreal ecosystems, and the Canadian fire managementapproach accommodates this need. Nevertheless, theLFDB described here permits the description of recentCanadian fire regimes. On average, about 1.8 million haburned annually <strong>in</strong> these large <strong>fires</strong>, but more than 7 millionha burned <strong>in</strong> some years. It is likely that only an additionalfew percent of the area burned was the result of <strong>fires</strong> lessthan 200 ha <strong>in</strong> size, even though small <strong>fires</strong> are more thanan order of magnitude more numerous than large <strong>fires</strong>. The<strong>fires</strong> mostly occurred <strong>in</strong> the boreal and taiga regions, whereabout 0.7% of the <strong>forest</strong>ed area burned annually as anecozone average. Some <strong>in</strong>dividual ecoregions have experienced2.9% of the <strong>forest</strong> area burned annually dur<strong>in</strong>g thisperiod. More than 70% of LFDB <strong>fires</strong> were caused bylightn<strong>in</strong>g, but burned about 85% of the area, mostly <strong>in</strong> thenorth where population is sparse. The median fire size was1040 ha, but the mean was 6797 ha, because a few of thevery large <strong>fires</strong> contributed greatly to the total area burned,although this distribution varied among ecozones. At thenational scale, the ma<strong>in</strong> fire season was from late April tothe end of August with most of the area burned occurr<strong>in</strong>g <strong>in</strong>June and July. Almost half of the area burned was by <strong>fires</strong>that were not actioned (i.e., suppressed to some degree),mostly <strong>in</strong> remote areas not be<strong>in</strong>g protected from fire exceptwhere communities were threatened. The LFDB data havebeen used to estimate direct carbon emissions from <strong>fires</strong>[Amiro et al., 2001a], are a basel<strong>in</strong>e for studies of climatechange impacts on fire [Amiro et al., 2001b; Flannigan etal., 1998; Flannigan et al., 2000; Stocks et al., 1998], andare part of the overall effort <strong>in</strong> model<strong>in</strong>g the carbon balancefor the Canadian <strong>forest</strong> sector [Kurz and Apps, 1999].[28] Acknowledgments. Development of the Canadian LFDB is anongo<strong>in</strong>g enterprise which has required the efforts of many organizationsand <strong>in</strong>dividuals over the past 12 years. The authors thank all Canadianprov<strong>in</strong>cial, territorial, and federal agencies, and their staffs for the provisionof fire records, and their cont<strong>in</strong>u<strong>in</strong>g assistance <strong>in</strong> compil<strong>in</strong>g these data. Wealso thank K. Power for the provision of <strong>forest</strong> <strong>in</strong>ventory data for Canadianecoregions, and B.S. Lee and Hua Sun for early contributions to thedevelopment of the LFDB. This study was partly funded by the ClimateChange Action Fund (CCAF), and the Energy from FORest Biomass(ENFOR) Program of the Canadian government.ReferencesAmiro, B. D., J. B. Todd, B. M. Wotton, K. A. Logan, M. D. Flannigan, B.J. Stocks, J. A. Mason, D. L. Martell, and K. G. Hirsch, Direct carbonemissions from Canadian <strong>forest</strong> <strong>fires</strong>, 1959 to 1999, Can. J. For. Res, 31,512–525, 2001a.Amiro, B. D., B. J. Stocks, M. E. Alexander, M. D. Flannigan, and B. M.Wotton, Fire, climate change, carbon and fuel management <strong>in</strong> the Canadianboreal <strong>forest</strong>, Int. J. Wildland Fire, 10, 405–413, 2001b.Cahoon, D. R., B. J. Stocks, L. S. Lev<strong>in</strong>e, W. R. Cofer, and J. M. Pierson,Satellite analysis of the severe 1987 <strong>forest</strong> <strong>fires</strong> <strong>in</strong> northern Ch<strong>in</strong>a andsoutheastern Siberia, J. Geophys. Res., 99, 18,627–18,638, 1994.Cahoon, D. R., B. J. Stocks, J. S. Lev<strong>in</strong>e, W. R. Cofer, and J. A. Barber,Monitor<strong>in</strong>g 1992 <strong>forest</strong> <strong>fires</strong> <strong>in</strong> the boreal ecosystem us<strong>in</strong>g NOAAAVHRR satellite imagery, <strong>in</strong> Biomass Burn<strong>in</strong>g and Global Change, editedby J. S. Lev<strong>in</strong>e, pp. 848–873, MIT Press, Cambridge, Mass., 1996.Canadian Council of Forest M<strong>in</strong>isters, Compendium of Canadian ForestryStatistics 1996, Nat. Resour. Can., Ottawa, 1997.Ecological Stratification Work<strong>in</strong>g Group, A national ecological frameworkfor <strong>Canada</strong>, Agric. and Agri-Food Can. and Environ. Can., Ottawa, 1995.Flannigan, M. D., and J. B. Harr<strong>in</strong>gton, A study of the relation of meteorologicalvariables to monthly prov<strong>in</strong>cial area burned by wildfire <strong>in</strong> <strong>Canada</strong>(1953–80), J. Appl. Meteorol., 27, 441–452, 1988.Flannigan, M. D., Y. Bergeron, O. Engelmark, and B. M. Wotton, Futurewildfire <strong>in</strong> circumboreal <strong>forest</strong>s <strong>in</strong> relation to global warm<strong>in</strong>g, J. Veg. Sci.,9, 469–476, 1998.Flannigan, M. D., B. J. Stocks, and B. M. Wotton, Climate change and<strong>forest</strong> <strong>fires</strong>, Sci. Tot. Environ., 262, 221–229, 2000.Harr<strong>in</strong>gton, J. B., A statistical study of area burned by wildfire <strong>in</strong> <strong>Canada</strong>1953–1980, Inf. Rep. PI-X-16, Can. For. Serv., Petawawa Natl. For. Inst.,Chalk River, Ontario, Can., 1982.Harr<strong>in</strong>gton, J. B., M. D. Flannigan, and C. F. Van Wagner, A study of therelation of components of the Fire Weather Index System to monthly prov<strong>in</strong>cialarea burned by wildfire <strong>in</strong> <strong>Canada</strong> 1953–80, Inf. Rep. PI-X-25, Can.For. Serv., Petawawa Natl. For. Inst., Chalk River, Ontraio, Can., 1983.Higg<strong>in</strong>s, D. G., and G. S. Ramsey, Canadian <strong>forest</strong> fire statistics: 1988–1990, For. Can. Inf. Rep. PI-X-107, Petawawa Natl. For. Inst., ChalkRiver, ON, 76 pp, 1992.Johnson, E. A., Fire and vegetation dynamics: Studies from the NorthAmerican boreal <strong>forest</strong>, Cambridge Univ. Press, New York, 1992.Kasischke, E. S., Boreal ecosystems and the global carbon cycle, <strong>in</strong> Fire,Climate Change, and Carbon Cycl<strong>in</strong>g <strong>in</strong> the Boreal Forest, Ecol. Stud.,vol. 138, edited by E. S. Kasischke and B. J. Stocks, pp. 19–30, Spr<strong>in</strong>ger-Verlag,New York, 2000.Kasischke, E. S., and B. J. Stocks (Eds.), Fire, Climate Change, and CarbonCycl<strong>in</strong>g <strong>in</strong> the Boreal Forest, Ecological Studies, vol. 138, 461 pp.,Spr<strong>in</strong>ger-Verlag, New York, 2000.Kasischke, E. S., K. Bergen, R. Fennimore, F. Sotelo, G. Stephens, A.Janetos, and H. Shugart, Satellite imagery gives a clear picture of Russia’sboreal <strong>forest</strong> <strong>fires</strong>, Eos Trans. AGU, 80, 141–147, 1999.Kurz, W. A., and M. J. Apps, A 70-year retrospective analysis of carbonfluxes <strong>in</strong> the Canadian <strong>forest</strong> sector, Ecol. Appl., 9, 526–547, 1999.Lev<strong>in</strong>e, J. S., (Ed.), Global Biomass Burn<strong>in</strong>g: Atmospheric, Climatic, andBiospheric Implications, MIT Press, Cambridge, Mass., 1991.Lev<strong>in</strong>e, J. S. (Ed.), Biomass Burn<strong>in</strong>g and Global Change, MIT Press, Cambridge,Mass., 1996.Malanson, G. P., Diversity, stability, and resilience: effects of fire regime, <strong>in</strong>The Role of Fire <strong>in</strong> Ecological Systems, edited by L. Trabaud, pp. 49–63,SPB Acad., Hague, 1987.Murphy, P. J., J. P. Mudd, B. J. Stocks, E. S. Kasischke, D. Barry, M. E.Alexander, and N. F. H. French, Historical fire records <strong>in</strong> the NorthAmerican boreal <strong>forest</strong>, <strong>in</strong> Fire, Climate Change, and Carbon Cycl<strong>in</strong>g<strong>in</strong> the Boreal Forest, Ecol. Stud., vol. 138, edited by E. S. Kasischke andB. J. Stocks, pp. 274–288, Spr<strong>in</strong>ger-Verlag, New York, 2000.Price, C., and D. R<strong>in</strong>d, The impact of a 2 CO 2 climate on lightn<strong>in</strong>gcaused<strong>fires</strong>, J. Clim., 7, 1484–1494, 1994.Stocks, B. J., The extent and impact of <strong>forest</strong> <strong>fires</strong> <strong>in</strong> northern circumpolarcountries, <strong>in</strong> Global Biomass Burn<strong>in</strong>g: Atmospheric, Climatic, and BiosphericImplications, edited by J. S. Lev<strong>in</strong>e, pp. 197–202, MIT Press,Cambridge, Mass., 1991.Stocks, B. J., and A. J. Simard, Forest fire management <strong>in</strong> <strong>Canada</strong>, J.Disaster Mgt., 5, 21–27, 1993.Stocks, B. J., D. R. Cahoon, W. R. Cofer, and J. S. Lev<strong>in</strong>e, Monitor<strong>in</strong>glarge-scale <strong>forest</strong> fire behavior <strong>in</strong> northeastern Siberia us<strong>in</strong>g NOAA-AVHRR satellite imagery, <strong>in</strong> Biomass Burn<strong>in</strong>g and Global Change, editedby J. S. Lev<strong>in</strong>e, pp. 802–807, MIT Press, Cambridge, MA, 1996a.Stocks, B. J., B. S. Lee, and D. L. Martell, Some potential carbon budgetimplications of fire management <strong>in</strong> the boreal <strong>forest</strong>, <strong>in</strong> Forest Ecosystems,Forest Management and the Global Carbon Cycle, NATO ASI Ser.1, Vol. 40, edited by M. J. Apps and D. T. Price, pp. 89–96, Spr<strong>in</strong>ger-Verlag, New York, 1996b.Stocks, B. J., et al., Climate change and <strong>forest</strong> fire potential <strong>in</strong> Russian andCanadian boreal <strong>forest</strong>s, Clim. Change, 38, 1–13, 1998.Stocks, B. J., B. M. Wotton, M. D. Flannigan, M. A. Fosberg, D. R.Cahoon, and J. G. Goldammer, Boreal <strong>forest</strong> fire regimes and climatechange, <strong>in</strong> Remote Sens<strong>in</strong>g and Climate Modell<strong>in</strong>g: Synergies and Lim-
FFR 5 - 12 STOCKS ET AL.: CANADIAN FOREST FIRESitations, edited by M. Beniston and M. M. Verstraete, pp. 233 – 246,Kluwer Acad., Norwell, Mass., 2001.Swetnam, T. W., Fire history and climate change <strong>in</strong> giant sequoia groves,Science, 262, 885–889, 1993.Van Wagner, C. E., The development and structure of the Canadian ForestFire Weather Index System, Tech. Rep. 35, Can For Serv, Ottawa, Ont.,Can., 1987.Van Wagner, C. E., The historical pattern of annual burned area <strong>in</strong> <strong>Canada</strong>,For. Chron., 64, 182–185, 1988.Weber, M. G., and M. D. Flannigan, Canadian boreal <strong>forest</strong> ecosystemstructure and function <strong>in</strong> a chang<strong>in</strong>g climate: impact on fire regimes,Environ. Rev., 5, 145–166, 1997.Weber, M. G., and B. J. Stocks, Forest <strong>fires</strong> and susta<strong>in</strong>ability <strong>in</strong> the boreal<strong>forest</strong>s of <strong>Canada</strong>, Ambio, 27, 545–550, 1998.Whelan, R. J., The Ecology of Fire, 346 pp., Cambridge Univ. Press, NewYork, 1995.Wotton, B. M., and M. D. Flannigan, Length of the fire season <strong>in</strong> chang<strong>in</strong>gclimate, For. Chron., 69, 187–192, 1993.B. D. Amiro, M. D. Flannigan, K. G. Hirsch, and J. B. Todd, CanadianForest Service, Northern Forestry Centre, 5320-122 Street, Edmonton, AB,T6H 3S5, <strong>Canada</strong>.E. M. Bosch, K. A. Logan, J. A. Mason, B. J. Stocks, and B. M. Wotton,Canadian Forest Service, Great Lakes Forestry Centre, 1219 Queen StreetEast, Sault Ste. Marie, ON, P6A 2E5, <strong>Canada</strong>. (bstocks@nrcan.gc.ca)D. L. Martell, Faculty of Forestry, University of Toronto, 33 WillcocksStreet, Toronto, ON, M5S 3B3, <strong>Canada</strong>.W. R. Sk<strong>in</strong>ner, Meteorological Service of <strong>Canada</strong>, 4905 Duffer<strong>in</strong> Street,Downsview, ON, M3H 5T4, <strong>Canada</strong>.