

Download the Time to Take Stock Brochure - Franklin Templeton ...
Download the Time to Take Stock Brochure - Franklin Templeton ...
Download the Time to Take Stock Brochure - Franklin Templeton ...
- No tags were found...

You also want an ePaper? Increase the reach of your titles
YUMPU automatically turns print PDFs into web optimized ePapers that Google loves.
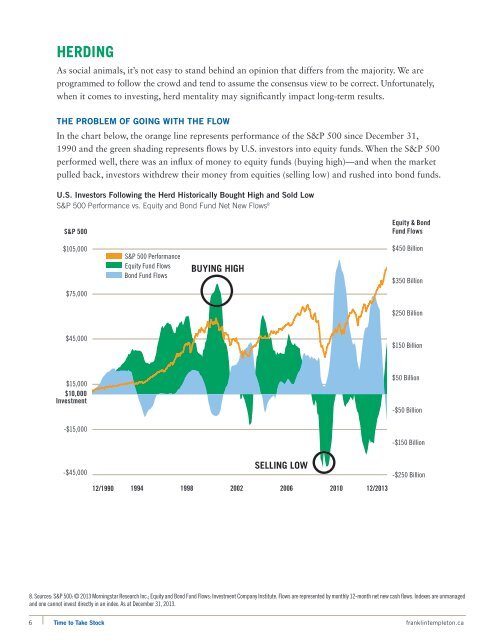
HerdingAs social animals, it’s not easy <strong>to</strong> stand behind an opinion that differs from <strong>the</strong> majority. We areprogrammed <strong>to</strong> follow <strong>the</strong> crowd and tend <strong>to</strong> assume <strong>the</strong> consensus view <strong>to</strong> be correct. Unfortunately,when it comes <strong>to</strong> investing, herd mentality may significantly impact long-term results.The Problem of Going with <strong>the</strong> FlowIn <strong>the</strong> chart below, <strong>the</strong> orange line represents performance of <strong>the</strong> S&P 500 since December 31,1990 and <strong>the</strong> green shading represents flows by U.S. inves<strong>to</strong>rs in<strong>to</strong> equity funds. When <strong>the</strong> S&P 500performed well, <strong>the</strong>re was an influx of money <strong>to</strong> equity funds (buying high)—and when <strong>the</strong> marketpulled back, inves<strong>to</strong>rs withdrew <strong>the</strong>ir money from equities (selling low) and rushed in<strong>to</strong> bond funds.U.S. Inves<strong>to</strong>rs Following <strong>the</strong> Herd His<strong>to</strong>rically Bought High and Sold LowS&P 500 Performance vs. Equity and Bond Fund Net New Flows 8S&P 500Equity & BondFund Flows$105,000S&P 500 PerformanceEquity Fund FlowsBond Fund FlowsBUYING HIGH$450 Billion$350 Billion$75,000$250 Billion$45,000$150 Billion$15,000$10,000Investment$50 Billion-$50 Billion-$15,000-$150 Billion-$45,000SELLING LOW12/1990 1994 1998 2002 2006 2010 12/2013-$250 Billion8. Sources: S&P 500: © 2013 Morningstar Research Inc.; Equity and Bond Fund Flows: Investment Company Institute. Flows are represented by monthly 12-month net new cash flows. Indexes are unmanagedand one cannot invest directly in an index. As at December 31, 2013.6 <strong>Time</strong> <strong>to</strong> <strong>Take</strong> S<strong>to</strong>ck franklintemple<strong>to</strong>n.ca


