Country profile on rural characteristics Spain - RuDI
Country profile on rural characteristics Spain - RuDI
Country profile on rural characteristics Spain - RuDI
- No tags were found...
Create successful ePaper yourself
Turn your PDF publications into a flip-book with our unique Google optimized e-Paper software.
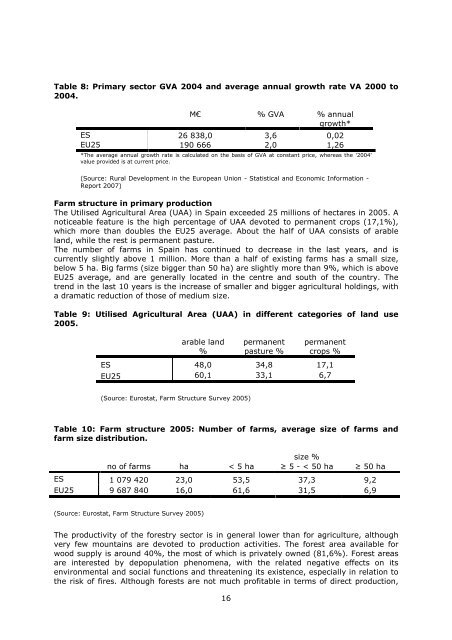
Table 8: Primary sector GVA 2004 and average annual growth rate VA 2000 to2004.M€ % GVA % annualgrowth*ES 26 838,0 3,6 0,02EU25 190 666 2,0 1,26*The average annual growth rate is calculated <strong>on</strong> the basis of GVA at c<strong>on</strong>stant price, whereas the '2004'value provided is at current price.(Source: Rural Development in the European Uni<strong>on</strong> - Statistical and Ec<strong>on</strong>omic Informati<strong>on</strong> -Report 2007)Farm structure in primary producti<strong>on</strong>The Utilised Agricultural Area (UAA) in <strong>Spain</strong> exceeded 25 milli<strong>on</strong>s of hectares in 2005. Anoticeable feature is the high percentage of UAA devoted to permanent crops (17,1%),which more than doubles the EU25 average. About the half of UAA c<strong>on</strong>sists of arableland, while the rest is permanent pasture.The number of farms in <strong>Spain</strong> has c<strong>on</strong>tinued to decrease in the last years, and iscurrently slightly above 1 milli<strong>on</strong>. More than a half of existing farms has a small size,below 5 ha. Big farms (size bigger than 50 ha) are slightly more than 9%, which is aboveEU25 average, and are generally located in the centre and south of the country. Thetrend in the last 10 years is the increase of smaller and bigger agricultural holdings, witha dramatic reducti<strong>on</strong> of those of medium size.Table 9: Utilised Agricultural Area (UAA) in different categories of land use2005.arable land%permanentpasture %permanentcrops %ES 48,0 34,8 17,1EU25 60,1 33,1 6,7(Source: Eurostat, Farm Structure Survey 2005)Table 10: Farm structure 2005: Number of farms, average size of farms andfarm size distributi<strong>on</strong>.size %no of farms ha < 5 ha ≥ 5 - < 50 ha ≥ 50 haES 1 079 420 23,0 53,5 37,3 9,2EU25 9 687 840 16,0 61,6 31,5 6,9(Source: Eurostat, Farm Structure Survey 2005)The productivity of the forestry sector is in general lower than for agriculture, althoughvery few mountains are devoted to producti<strong>on</strong> activities. The forest area available forwood supply is around 40%, the most of which is privately owned (81,6%). Forest areasare interested by depopulati<strong>on</strong> phenomena, with the related negative effects <strong>on</strong> itsenvir<strong>on</strong>mental and social functi<strong>on</strong>s and threatening its existence, especially in relati<strong>on</strong> tothe risk of fires. Although forests are not much profitable in terms of direct producti<strong>on</strong>,16


