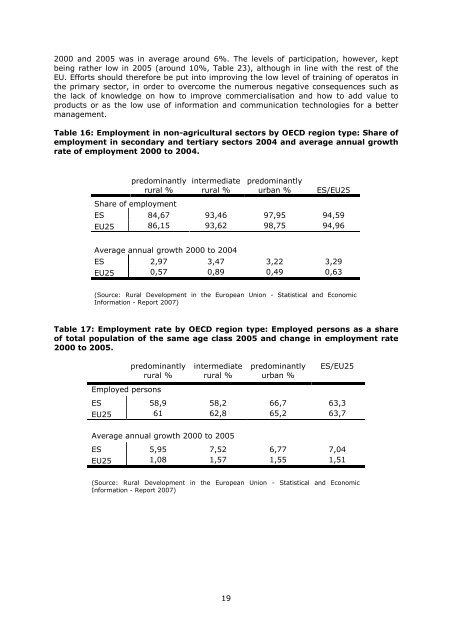
EU25 44,6 16,3 35,6 3,2(Source: Eurostat, Farm Structure Survey 2005)Table 14: Area and utilised agricultural area (UAA) under NATURA 2000 2006.area underNATURA2000 SpecialProtecti<strong>on</strong> %area underNATURA 2000Sites ofImportance %UAAunderNATURA2000 %forestareaunderNATURA2000 %ES 18,3 22,6 24,03 9,13EU25 9,9 12,2 10,47 7,11(Source: European Envir<strong>on</strong>ment Agency, Natura 2000 Barometer)Table 15: Area designated as a risk z<strong>on</strong>e for water quality 2006.ES 12,6EU25 41,4%(Source: Rural Development in the European Uni<strong>on</strong> - Statistical and Ec<strong>on</strong>omicInformati<strong>on</strong> - Report 2007)3.3 The quality of life in <strong>rural</strong> areas and diversificati<strong>on</strong> of the<strong>rural</strong> ec<strong>on</strong>omyThe employment in n<strong>on</strong>-agricultural sectors is quite high in <strong>rural</strong> areas (84,67% inpredominantly <strong>rural</strong> and 93,46% in intermediate <strong>rural</strong> areas), thus c<strong>on</strong>firming the factthat ec<strong>on</strong>omic diversificati<strong>on</strong> in <strong>rural</strong> areas is a matter of fact. The tendency todiversificati<strong>on</strong> within agricultural holdings, measured through the share of n<strong>on</strong>agriculturalactivities carried out <strong>on</strong> the holding itself (camping sites, accommodati<strong>on</strong> fortourists, etc.) or <strong>on</strong> another agricultural holding as well as activity in a n<strong>on</strong>-agriculturalenterprise, appears to be moderately high irrespective of type of regi<strong>on</strong>, although with aslight prevalence of predominantly <strong>rural</strong> <strong>on</strong> intermediate <strong>rural</strong> areas (Table 20).The employment rate in <strong>Spain</strong> has rapidly increased from 2000 to 2005, c<strong>on</strong>vergingtowards EU25 averages (Table 17). Only in predominantly <strong>rural</strong> areas unemployment isrising, although moderately (+0,2%). The importance of l<strong>on</strong>g-term unemployment (morethan 12 m<strong>on</strong>ths) is also decreasing, in countertendency with EU25 where it undergoes aslight increase in intermediate <strong>rural</strong> and in urban areas (Table 19).<strong>Spain</strong> present a slightly better situati<strong>on</strong> than the EU25 in terms of entrepreneurship,measured as the degree of self-employment (referred to pers<strong>on</strong>s working <strong>on</strong> their ownbusiness farm or professi<strong>on</strong>al practice for the purpose of earning a profit). In thisrespect, predominantly <strong>rural</strong> areas present the highest percentage of self-employees(20,12%).The agricultural sector is characterised by a low level of training of operators: despite thevery rapid pace of growth from 2000 to 2005, sensibly higher than in the rest of theEU25, in 2005 still <strong>on</strong>ly 48,77% of operators had reached a medium or high educati<strong>on</strong>level, against the 70,82% for EU25 (Table 22). The same rapid growth rate affected thedegree of participati<strong>on</strong> of adults in educati<strong>on</strong> and training programmes, which between18
2000 and 2005 was in average around 6%. The levels of participati<strong>on</strong>, however, keptbeing rather low in 2005 (around 10%, Table 23), although in line with the rest of theEU. Efforts should therefore be put into improving the low level of training of operatos inthe primary sector, in order to overcome the numerous negative c<strong>on</strong>sequences such asthe lack of knowledge <strong>on</strong> how to improve commercialisati<strong>on</strong> and how to add value toproducts or as the low use of informati<strong>on</strong> and communicati<strong>on</strong> technologies for a bettermanagement.Table 16: Employment in n<strong>on</strong>-agricultural sectors by OECD regi<strong>on</strong> type: Share ofemployment in sec<strong>on</strong>dary and tertiary sectors 2004 and average annual growthrate of employment 2000 to 2004.predominantly<strong>rural</strong> %Share of employmentintermediate<strong>rural</strong> %predominantlyurban %ES/EU25ES 84,67 93,46 97,95 94,59EU25 86,15 93,62 98,75 94,96Average annual growth 2000 to 2004ES 2,97 3,47 3,22 3,29EU25 0,57 0,89 0,49 0,63(Source: Rural Development in the European Uni<strong>on</strong> - Statistical and Ec<strong>on</strong>omicInformati<strong>on</strong> - Report 2007)Table 17: Employment rate by OECD regi<strong>on</strong> type: Employed pers<strong>on</strong>s as a shareof total populati<strong>on</strong> of the same age class 2005 and change in employment rate2000 to 2005.predominantly<strong>rural</strong> %intermediate<strong>rural</strong> %predominantlyurban %ES/EU25Employed pers<strong>on</strong>sES 58,9 58,2 66,7 63,3EU25 61 62,8 65,2 63,7Average annual growth 2000 to 2005ES 5,95 7,52 6,77 7,04EU25 1,08 1,57 1,55 1,51(Source: Rural Development in the European Uni<strong>on</strong> - Statistical and Ec<strong>on</strong>omicInformati<strong>on</strong> - Report 2007)19