quantitative determination of ethanol in wine by gas chromatography
quantitative determination of ethanol in wine by gas chromatography
quantitative determination of ethanol in wine by gas chromatography

Create successful ePaper yourself
Turn your PDF publications into a flip-book with our unique Google optimized e-Paper software.
QUANTITATIVE DETERMINATION OF ETHANOLIN WINE BY GAS CHROMATOGRAPHYB. STACKLER and E. N. CHRISTENSENPresented at the Annual Meet<strong>in</strong>g <strong>of</strong> the American Society <strong>of</strong> Enologists, June 21, 1974, San Diego, California.Respectively Research Scientist and Senior Research Scientist, E. & J. Gallo W<strong>in</strong>ery, Modesto, California.Accepted for publication November 5, 1974.ABSTRACTA method is described for specific <strong>quantitative</strong>analysis <strong>of</strong> <strong>ethanol</strong> <strong>in</strong> w<strong>in</strong>e <strong>by</strong> <strong>gas</strong> <strong>chromatography</strong>.This method, which uses an <strong>in</strong>ternal standard andflame ionization detector, is more accurate and moreprecise than methods commonly used. Statisticalanalysis <strong>of</strong> data from typical w<strong>in</strong>ery samples showsthat the standard error <strong>of</strong> estimate for the methodis 0.07~/~ (v/v) over the range 7 to 24% (v/v). Theestimate <strong>of</strong> the standard deviation <strong>of</strong> the chroma-tography for duplicate <strong>in</strong>jections is 0.02% (v/v).The <strong>gas</strong>-liquid <strong>chromatography</strong> method determ<strong>in</strong>es<strong>ethanol</strong> separately from the other w<strong>in</strong>e componentsthat <strong>in</strong>terfere <strong>in</strong> other methods, and without distillationor chemical reaction. When large numbers<strong>of</strong> samples are analyzed, advantages <strong>in</strong>clude shortanalysis time per sample and potential for extensiveautomation.Determ<strong>in</strong>ation <strong>of</strong> <strong>ethanol</strong> is perhaps the most importantrout<strong>in</strong>e analysis <strong>in</strong> a modern w<strong>in</strong>ery. Frequent,fast, and accurate results are needed to controlthe quality <strong>of</strong> the w<strong>in</strong>e from grape to bottle,as well as for state and federal government tax andregulatory purposes. The alcoholic beverage <strong>in</strong>dustryand various regulatory agencies have devotedmuch effort <strong>in</strong> recent years to develop<strong>in</strong>g a faster,specific, more accurate, and automated method.Gas-liquid <strong>chromatography</strong> is one <strong>of</strong> the mostmodern analytical techniques, dat<strong>in</strong>g from 1952.Even more recently, with the utilization <strong>of</strong> electronicdigital data-process<strong>in</strong>g equipment, <strong>gas</strong> <strong>chromatography</strong>has become <strong>in</strong>creas<strong>in</strong>gly preferred foraccurate <strong>quantitative</strong> as well as qualitative analyses<strong>of</strong> many substances.Traditional <strong>ethanol</strong> analysis methods, <strong>in</strong>volv<strong>in</strong>gdistillation and/or mass <strong>determ<strong>in</strong>ation</strong>s, are knownto <strong>in</strong>clude small <strong>in</strong>accuracies due to the presence <strong>of</strong><strong>in</strong>terfer<strong>in</strong>g volatile or other components <strong>in</strong> w<strong>in</strong>e(12). With an appropriately chosen column pack<strong>in</strong>g,<strong>gas</strong> <strong>chromatography</strong> is <strong>in</strong>herently specific, separat<strong>in</strong>gvolatile compounds on the basis <strong>of</strong> compoundspecificpartition<strong>in</strong>g properties between a <strong>gas</strong> phaseand a liquid (or a solid) phase. To evaluate theaccuracy, precision, and specificity <strong>of</strong> the <strong>gas</strong>-liquid<strong>chromatography</strong> method described here, it was necessaryto analyze <strong>ethanol</strong> standards and typical w<strong>in</strong>erysamples <strong>by</strong> a reference method. The referenceAmer. J. Enol. Viticult., Vol. 25, No. 4, 1974202method used was the micro-dichromate procedure(9). Because <strong>of</strong> the high accuracy <strong>of</strong> the GC method,it was also necessary to develop a procedure forestimat<strong>in</strong>g the magnitude <strong>of</strong> the <strong>in</strong>accuracy <strong>in</strong> thedichromate method caused <strong>by</strong> non-<strong>ethanol</strong> w<strong>in</strong>e volatiles.The most significant non-<strong>ethanol</strong> w<strong>in</strong>e componentsanalyzed as "<strong>ethanol</strong>" <strong>by</strong> the dichromatemethod were determ<strong>in</strong>ed to be m<strong>ethanol</strong> and thecommon fusel oils.W<strong>in</strong>e <strong>in</strong>dustry researchers were among the early<strong>in</strong>vestigators <strong>of</strong> <strong>quantitative</strong> <strong>gas</strong> <strong>chromatography</strong>(GC) techniques, present<strong>in</strong>g data on <strong>ethanol</strong> analysis<strong>in</strong> 1961 (3). A 1961 <strong>in</strong>dustry paper <strong>in</strong>cludeddata on a relatively sophisticated GC <strong>ethanol</strong> analysismethod utiliz<strong>in</strong>g an <strong>in</strong>ternal standard and electronic<strong>in</strong>tegrator for peak quantitation (8). A variety <strong>of</strong>GC methods for the analysis <strong>of</strong> <strong>ethanol</strong> are described<strong>in</strong> a recent review article <strong>by</strong> Ja<strong>in</strong> and Cravey (6).Recent papers <strong>by</strong> Mart<strong>in</strong> and Tenenbaum (7), Solonet al (10), and Goodman and Dorion (5) describe<strong>gas</strong>-solid chromatographic methods us<strong>in</strong>g the newerporous polymer column pack<strong>in</strong>gs. Despite the extensiveresearch on GC <strong>ethanol</strong> analysis <strong>in</strong> the past15 years, no published method has been ref<strong>in</strong>ed tothe high accuracy and precision <strong>of</strong> the method describedhere. A nonl<strong>in</strong>earity <strong>in</strong> GC detector responseto <strong>ethanol</strong> has been the ma<strong>in</strong> obstacle to high accuracy<strong>in</strong> previous work. Additional <strong>in</strong>accuraciescan be <strong>in</strong>troduced <strong>in</strong>to a GC method <strong>by</strong> <strong>in</strong>appropri-
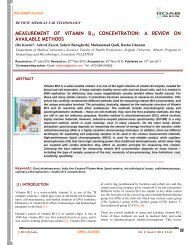
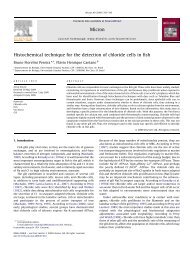
the standardization were l<strong>in</strong>ear regression calculations.L<strong>in</strong>ear regression calculations- L<strong>in</strong>ear regressionstatistical analysis <strong>by</strong> least squares accord<strong>in</strong>g to theusual method (1) was applied to the five responsefactors produced <strong>by</strong> the <strong>in</strong>jection <strong>of</strong> the set <strong>of</strong> fivestandardization dilutions. L<strong>in</strong>ear regression analysis<strong>of</strong> the response factors produced <strong>by</strong> the <strong>in</strong>jection <strong>of</strong>the 100 w<strong>in</strong>ery samples was also performed. Theaverage dichromate analysis <strong>of</strong> each sample providedthe reference analysis for the calculations.GC analysis <strong>of</strong> w<strong>in</strong>ery samples: The 100 w<strong>in</strong>erysamples were each diluted once and <strong>in</strong>jected twice.Response factors were calculated for each <strong>in</strong>jection.The <strong>ethanol</strong> content was calculated as (<strong>in</strong>tercept) -t-(slope ~ response factor), with slope and <strong>in</strong>terceptdeterm<strong>in</strong>ed <strong>by</strong> standardization and l<strong>in</strong>ear regressioncalculation as described above.Diluter precision check: The precision <strong>of</strong> the Yorkdiluter used <strong>in</strong> the GC method was measured <strong>by</strong>dilut<strong>in</strong>g a ferro<strong>in</strong> dye solution and read<strong>in</strong>g the absorbance<strong>of</strong> the diluted solution at 508 m~ on a Cary15 spectrophotometer. Twenty separate dilutionswere made and analyzed.Standard-deviation calculations: The duplicate<strong>chromatography</strong> <strong>in</strong>jections <strong>of</strong> each <strong>of</strong> the 100 w<strong>in</strong>erysamples were analyzed statistically for estimate <strong>of</strong>the standard deviation as described <strong>by</strong> Youden (11)for groups <strong>of</strong> duplicate samples. In addition, astandard deviation was calculated for the multiple<strong>in</strong>jections <strong>of</strong> each <strong>ethanol</strong> standard, and for multipleferro<strong>in</strong> dye dilutions.Equipment: The equipment used is shown <strong>in</strong> Fig.1. Analyst <strong>in</strong>teraction with the equipment is m<strong>in</strong>imal,consist<strong>in</strong>g <strong>of</strong> position<strong>in</strong>g the sample for dilution,<strong>in</strong>ject<strong>in</strong>g the sample, and activat<strong>in</strong>g the diluter and<strong>in</strong>tegrator <strong>by</strong> foot switches.i!i,~iiiiiiiili!iiiiii!~ii~ii!i!!!i!!iiiiiiiiiiii~i~~~'~',~i~~'~ ®Fig. 1. Equipment used <strong>in</strong> GC <strong>ethanol</strong> analysis <strong>in</strong>clud<strong>in</strong>g GC,<strong>in</strong>tegrator and pr<strong>in</strong>ter, recorder, and automatic diluter.WINEs234COMPONENTS:DETERMINING ETHANOL IN WlNE~204INTEGRATORPRINTOUTRetention Time Digital Counts(seconds)Lt68 2008S 202920181 1326275 2138581, M<strong>ethanol</strong>; 2, Ethanol; 3, "Water Peak";4, n-llutyl alcohol; 5, Iso-amyl alcohol.Fig. 2.Amer. J. Enol. Viticult., Vol. 25, No. 4, 1974Chromatograms, <strong>in</strong>tegrator pr<strong>in</strong>tout <strong>of</strong> dry sherry.RESULTS AND DISCUSSIONFig. 2 shows GC chromatograms <strong>of</strong> a typical w<strong>in</strong>esample (dry sherry). Ethanol elutes with a retentiontime <strong>of</strong> 85 seconds, and the n-butanol <strong>in</strong>ternalstandard Mutes with a retention time <strong>of</strong> 275 seconds.The total analysis time <strong>of</strong> 51~2 m<strong>in</strong>utes (<strong>in</strong>clud<strong>in</strong>gthe 15-second sample preparation-dilution) is shortcompared with that <strong>of</strong> other methods. As shown <strong>in</strong>Fig. 2-A, m<strong>ethanol</strong>, the fusel oils, other w<strong>in</strong>e volatiles(2), and the "water peak" do not <strong>in</strong>terfere withthe elution <strong>of</strong> <strong>ethanol</strong> or n-butanol. The chromatogram<strong>in</strong> Fig. 2-B (higher recorder attenuationthan Fig. 2-A) shows that the <strong>ethanol</strong> and n-butanol peak shapes are close to ideal. The coppercolumn, <strong>in</strong>ert Teflon support, liquid phase, columntemperature, and carrier <strong>gas</strong> flow rate were selectedto prevent w<strong>in</strong>e volatiles from elut<strong>in</strong>g at the sametime as <strong>ethanol</strong> or the <strong>in</strong>ternal standard. The "waterpeak" (a change <strong>in</strong> the temperature <strong>of</strong> the flamedetector caused <strong>by</strong> the elution <strong>of</strong> water vapor) wasfound to <strong>in</strong>terfere directly with <strong>ethanol</strong> or <strong>in</strong>ternalstandard elution, or <strong>by</strong> "tail<strong>in</strong>g," when other chromatographicconfigurations were used.Fig. 2 also shows the format <strong>of</strong> the electronicdigital <strong>in</strong>tegrator paper tape pr<strong>in</strong>tout, <strong>in</strong>clud<strong>in</strong>gpeak retention times and area counts. The Varian480 <strong>in</strong>tegrator does not calculate the response factor(divide the <strong>ethanol</strong> peak area counts <strong>by</strong> the n-butanolpeak area counts), but GC digital data pro-
205--DETERMINING ETHANOL IN WINEcess<strong>in</strong>g equipment is commercially available that willperform this calculation. Some type <strong>of</strong> digital <strong>in</strong>tegrationcapability is necessary to obta<strong>in</strong> the accuracyand precision reported here. While not necessaryfor this method (and not used), one <strong>of</strong> the commerciallyavailable automatic GC sample <strong>in</strong>jectors isdesirable.The <strong>ethanol</strong> standards were used to measure theprecision and stability <strong>of</strong> the GC system, as well asfor its standardization. Each <strong>of</strong> the five standardswas <strong>in</strong>jected once each day <strong>of</strong> the experiment tomeasure the variation <strong>in</strong> GC response to the standardsfrom day to day. Table 1 shows that the GCsystem is remarkably stable. The relative standarddeviation <strong>of</strong> the response factors for each standardis close to 0.1% over the entire 10-day period <strong>of</strong>the experiment. The GC system is so precise andstable that the <strong>in</strong>itial <strong>in</strong>jections <strong>of</strong> the standards(and only one <strong>in</strong>jection <strong>of</strong> each standard) provideda standardization valid for 10 days.The precision <strong>of</strong> the <strong>chromatography</strong> <strong>of</strong> themethod was measured <strong>in</strong> terms <strong>of</strong> duplicate <strong>in</strong>jections<strong>of</strong> the 100 w<strong>in</strong>ery samples. These samples,although <strong>in</strong>jected twice, were diluted only once toelim<strong>in</strong>ate any diluter imprecision from the measure-TABLE 1Variation <strong>of</strong> GC Response to Ethanol StandardsResponse factorStandard no.: 1 2 3 4 5Dichromate<strong>ethanol</strong>analysis:Day <strong>of</strong>expt.5.67% 10.08% 12.26% 14.83% 19.69%(v/v) (v/v) (v/v) (v/v) (v/v)ment <strong>of</strong> <strong>chromatography</strong> precision. Statistically, theestimate <strong>of</strong> the standard deviation <strong>of</strong> the duplicate<strong>in</strong>jections was 0.021% (v/v), or 0.16% relative tothe mean <strong>ethanol</strong> content <strong>of</strong> the 100 samples. Theprecision <strong>of</strong> the <strong>chromatography</strong> per se is substantiallybetter than the precision reported for othermethods (4,9). The precision <strong>of</strong> the <strong>chromatography</strong>is even more remarkable when it is consideredthat the duplicate <strong>in</strong>jections <strong>of</strong> a given sample neveroccurred on the same day, and, <strong>in</strong> fact, were separated<strong>by</strong> 5 to 10 days. However, the relativh standarddeviation <strong>of</strong> the diluter was determ<strong>in</strong>ed to be0.17% (for ferro<strong>in</strong> dilutions us<strong>in</strong>g a spectrophotometerwith a relative standard deviation <strong>of</strong> approximately0.10%), so the overall precision <strong>of</strong> the GCmethod is not as good as the 0.021% (v/v) <strong>of</strong> the<strong>chromatography</strong>.The accuracy <strong>of</strong> the dichromate reference anaysis(and densitometric methods) is limited becausenon-GC methods cannot dist<strong>in</strong>guish between <strong>ethanol</strong>and the small amounts <strong>of</strong> certa<strong>in</strong> non-<strong>ethanol</strong> w<strong>in</strong>ecomponents. Table 2 shows the magnitude <strong>of</strong> the<strong>in</strong>accuracy caused <strong>by</strong> each <strong>of</strong> the 12 non-<strong>ethanol</strong>w<strong>in</strong>e components <strong>in</strong> model solutions. The first columnshows how much "<strong>ethanol</strong>" is detected ("<strong>ethanol</strong>equivalent") for every 100 ppm <strong>of</strong> non-<strong>ethanol</strong>component. The second column shows how manyppm <strong>of</strong> the non-<strong>ethanol</strong> component will be detectedas 0.01% (v/v) "<strong>ethanol</strong>" <strong>by</strong> the dichromatemethod. M<strong>ethanol</strong> is the most significant <strong>in</strong>terfer-ComponentTABLE 2Non-<strong>ethanol</strong> W<strong>in</strong>e Components Analyzed asDichromate "Ethanol""Ethanol equivalent"per 100 mg/L(sample average)Amount detectedas 0,01% (v/v)<strong>ethanol</strong>(sample average)1 0.3141 0.5557 0.6791 0.8212 1.09272 0.3139 0.5550 0.6794 0.8217 1.09103 0.3148 0.5564 0.6790 0.8213 1.09244 0.3146 0.5570 0.6799 0.8214 1.09237 0.3148 0.5563 0.6784 0.8192 1.09058 0.3142 0.5560 not 0.8214analyzed1.093110 0.3142 0.5560 0.6802 0.8240 1.0942Mean 0.3144 0.5561 0.6793 0.8215 1.0931Standarddeviation 0.0003Relativestandarddeviation 0.10%0.0006 0.0006 0.00130.10% 0.09% 0.16% 0.11%M<strong>ethanol</strong>n-PropanolSec-butanolIsobutanolIsoamyl alcoholAcetaldehyde2,3-ButanediolEthyl acetate2-Butanone0.0011 Glycer<strong>in</strong>Potassium sorbatePotassium metabisulfite0.024% (v/v)0.0140.0040.0140.0140.0110.000940.00890.0012None detectedNone detectedNone detected41 mg/L7425071711081080113850Amer. J. Enol. Viticuit., Vol. 25, No. 4, 1974
DETERMINING ETHANOL IN WINE--206TABLE 3Summary <strong>of</strong> GC Method L<strong>in</strong>ear Regression AnalysisCalculated with Reference to Micro-dichromate MethodFive <strong>ethanol</strong> standards(6-20% v/v)100 w<strong>in</strong>ery samples(7-24% v/v)Uncorrected(for m<strong>ethanol</strong>and fusel oils)Corrected(for m<strong>ethanol</strong>and fusel oils)Standard error<strong>of</strong> estimateIntercept0.028% (v/v)0.045% (v/v)0.072 0.0700.117 0.046Slope 17.99 17.94 17.95Correlation 0.99999 0.99986 0.99988coefficient<strong>in</strong>g substance per ppm. The ~ssumption is made <strong>in</strong>these calculations that the dichromate method respondsl<strong>in</strong>early to the concentrations <strong>of</strong> each non<strong>ethanol</strong>component, from the several percent concentrationsactually measured to the ppm concerttrationscalculated for Table 2. (The titration step<strong>of</strong> the dichromate procedure is not accurate enoughfor direct <strong>determ<strong>in</strong>ation</strong> <strong>of</strong> 100-ppm differences <strong>of</strong>any w<strong>in</strong>e component, <strong>in</strong>clud<strong>in</strong>g <strong>ethanol</strong>.) The m<strong>ethanol</strong>and fusel oil analysis <strong>of</strong> each <strong>of</strong> the 100 w<strong>in</strong>erysamples, and the "<strong>ethanol</strong>-equivalent" conversionfactors from Table 2, were used for calculat<strong>in</strong>g thetotal dichromate "<strong>ethanol</strong> equivalent" (for <strong>ethanol</strong>and the fusel oils) for each sample. The total dichromate"<strong>ethanol</strong> equivalent" ranged from 0.03%to 0.12% (v/v), with a mean <strong>of</strong> 0.07~ (v/v). (n-Butanol was not detected <strong>in</strong> any <strong>of</strong> the w<strong>in</strong>ery samples.)The degree <strong>of</strong> <strong>in</strong>terference with other methodsdepends on the density or refractive <strong>in</strong>dex <strong>of</strong>the non-<strong>ethanol</strong> components as compared with that<strong>of</strong> <strong>ethanol</strong>.Table 3 shows the accuracy <strong>of</strong> the GC method asdeterm<strong>in</strong>ed <strong>by</strong> l<strong>in</strong>ear regression analysis. The rawdata for these calculations are the GC response factorand correspond<strong>in</strong>g dichromate reference analysisfor each sample. Table 3 also shows l<strong>in</strong>ear regressiondata for the 100 w<strong>in</strong>ery samples and for the<strong>ethanol</strong> standards. The w<strong>in</strong>ery sample data are calculatedboth for the usual "uncorrected" dichromate<strong>ethanol</strong> analyses and for dichromate analyses correctedfor total m<strong>ethanol</strong> and fusel oil equivalents,as expla<strong>in</strong>ed above. In both cases <strong>of</strong> w<strong>in</strong>ery sampledata the standard error <strong>of</strong> estimate is 0.07 7~ (v/v)<strong>ethanol</strong> (over the range 7 to 24%). The w<strong>in</strong>erysample data are the average <strong>of</strong> statistics calculatedseparately for each <strong>of</strong> the two sets <strong>of</strong> <strong>in</strong>jections <strong>of</strong>the 100 samples, while the <strong>ethanol</strong> standard data arethe statistics from the orig<strong>in</strong>al (s<strong>in</strong>gle) <strong>in</strong>jection<strong>of</strong> each <strong>of</strong> the five standards. The <strong>in</strong>tercept (<strong>of</strong> theAmer. J. Enol. Viticult., Vol. 25, No. 4, 1974l<strong>in</strong>e <strong>of</strong> regression) is 0.07~ less for the correctedw<strong>in</strong>ery sample data (0.05%) than for the uncorrectedw<strong>in</strong>ery sample data (0.12%) because themean correction for m<strong>ethanol</strong> and fusel oil "<strong>ethanol</strong>equivalents" was 0.07~. It is presumed that a zero<strong>in</strong>tercept would result if it were possible to correctthe dichromate analysis <strong>of</strong> the w<strong>in</strong>es for the "<strong>ethanol</strong>equivalent" <strong>of</strong> all the non-<strong>ethanol</strong> components, notjust m<strong>ethanol</strong> and fusel oils. The standard erroris better for the <strong>ethanol</strong> standards (0.03~/~) thanfor the w<strong>in</strong>es (0.07%) because a dilution <strong>of</strong> eachstandard was selected to average out diluter variationfrom dilution to dilution, and because only fivestandards were <strong>in</strong>jected.Important parameters for GC <strong>ethanol</strong> analysis <strong>in</strong>cludesample size and sample concentration. Experience<strong>in</strong>dicates that a common reason for lessl<strong>in</strong>earity <strong>of</strong> detector response (larger standard error)over the alcohol range <strong>of</strong> <strong>in</strong>terest has been, verysimply, samples not diluted to a low enough concentration.Larger diluter sample size results <strong>in</strong>better precision from dilution to dilution, but themore concentrated sample that results might costl<strong>in</strong>earity (accuracy) <strong>of</strong> flame detector response.Commercial diluters have def<strong>in</strong>ite limitations <strong>in</strong>terms <strong>of</strong> sample size and diluent size. Another advantage<strong>of</strong> <strong>in</strong>ject<strong>in</strong>g a low concentration sampleonto the GC column is that non-volatile w<strong>in</strong>e componentsdo not build up on the column as quickly.After more than 5,000 <strong>in</strong>jections over a severalmonthperiod, the orig<strong>in</strong>al column cont<strong>in</strong>ues to functionwith no detectable deterioration <strong>in</strong> performance.Even with the 0.1-ml to 25-ml dilution it is estimatedthat the method described here can detect <strong>ethanol</strong>concentrations as low as 0.1% (v/v). A modifieddilution ratio might extend the range <strong>of</strong> the methodfrom as low as 10 ppm to as high as 100% <strong>ethanol</strong>.The method has potential for determ<strong>in</strong><strong>in</strong>g the ethan-
207mDETERMINING ETHANOL IN WINEol concentration <strong>of</strong> most samples analyzed <strong>in</strong> thealcoholic beverage <strong>in</strong>dustry.CONCLUSIONThe GC <strong>ethanol</strong> analysis method described hereis simple <strong>in</strong> concept, rapid, and highly accurate,determ<strong>in</strong><strong>in</strong>g <strong>ethanol</strong> specifically without <strong>in</strong>terferencefrom other w<strong>in</strong>e components. Reagent preparationand expense (for 0.05% n-butanol <strong>in</strong> water)are m<strong>in</strong>imal. Analyst manipulation is m<strong>in</strong>imizedthrough the use <strong>of</strong> an automatic diluter and automaticpr<strong>in</strong>tout <strong>of</strong> raw data <strong>in</strong> digital form on papertape. However, the method does require a <strong>gas</strong> chromaLographand a digital <strong>in</strong>tegrator, both moderatelyexpensive and sophisticated pieces <strong>of</strong> equipment.LITERATURE CITED1. Alder, H. L. and E. B. Roessler. Introduction to probabilityand statistics. W. H. Freeman and Company, San Franciscoand London (1960).2. Amer<strong>in</strong>e, M. A., H. W. Berg, and W. V. Cruess. The technology<strong>of</strong> w<strong>in</strong>emak<strong>in</strong>g. AVI Publish<strong>in</strong>g Company, Westport,Connecticut (1972).Amer. J. Enol. Viticult., Vol. 25, No. 4, 19743. Bouthilet, R. J., A. Caputi, Jr. and M. Ueda. Analysis <strong>of</strong><strong>ethanol</strong> <strong>in</strong> w<strong>in</strong>e <strong>by</strong> <strong>gas</strong>-liquid partition <strong>chromatography</strong>. J.<strong>of</strong> A.O.A.C. 44:410-14 (1961).4. Caputi, A., Jr. Determ<strong>in</strong>ation <strong>of</strong> <strong>ethanol</strong> <strong>in</strong> w<strong>in</strong>e <strong>by</strong> chemicaloxidation: 1969 studies. J. A.O.A.C. 53:11-12 (1970).5. Goodman, D. E. and G. H. Dorion. A new semi-automatedmethod for the <strong>quantitative</strong> <strong>determ<strong>in</strong>ation</strong> <strong>of</strong> pro<strong>of</strong> <strong>in</strong> alcoholicproducts <strong>by</strong> <strong>gas</strong>-solid <strong>chromatography</strong>. Unpublishedresults, presented at the annual meet<strong>in</strong>g <strong>of</strong> the Association<strong>of</strong> Official Analytical Chemists, October, 1973.6. Ja<strong>in</strong>, N. C. and R. H. Cravey. Analysis <strong>of</strong> alcohol. I!. Areview <strong>of</strong> <strong>gas</strong> chromatographic methods. J. Chrom. Sci.10:253-67 (1972).7. Mart<strong>in</strong>, G. E. and M. Tenenbaum. Quantitative <strong>determ<strong>in</strong>ation</strong><strong>of</strong> <strong>ethanol</strong> <strong>by</strong> <strong>gas</strong>-solid <strong>chromatography</strong>. Am. Cosmeticsand Perfumery 87(11):35-6 (1972).8. Morrison, R. L. Determ<strong>in</strong>ation <strong>of</strong> <strong>ethanol</strong> <strong>in</strong> w<strong>in</strong>e <strong>by</strong> <strong>gas</strong>liquidpartition <strong>chromatography</strong>. Am. J. Enol. Vitic. 12:101-6(1961).9. Morrison, R. L. and T. E. Edwards. Semi-automatic <strong>determ<strong>in</strong>ation</strong><strong>of</strong> <strong>ethanol</strong> <strong>in</strong> w<strong>in</strong>e <strong>by</strong> the micro-dichromatemethod. Am. J. Enol. Vitic. 14:185-93 (1963).10. Solon, J., J. Watk<strong>in</strong>s and L. Mikkelsen. Automated analysis<strong>of</strong> alcohols <strong>in</strong> blood. Presented at the American Academy<strong>of</strong> Forensic Sciences, Atlanta (1972).11. Youden, W. J. Statistical techniques for collaborative tests,AOAC, Wash<strong>in</strong>gton, D.C. (1967).12. Zimmerman, H. W. Studies on the dichromate method <strong>of</strong>alcohol <strong>determ<strong>in</strong>ation</strong>. Am. J. Enol. Vitic. 14:205-13 (1963).