Moisture Relationships of Plant-based Agricultural Products
Moisture Relationships of Plant-based Agricultural Products
Moisture Relationships of Plant-based Agricultural Products

Create successful ePaper yourself
Turn your PDF publications into a flip-book with our unique Google optimized e-Paper software.
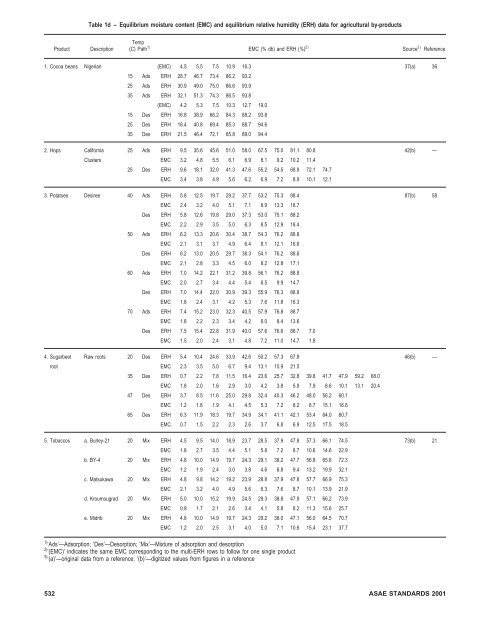
Table 1d – Equilibrium moisture content (EMC) and equilibrium relative humidity (ERH) data for agricultural by-productsProductDescriptionTemp(C) Path 1) EMC (% db) and ERH (%) 2) Source 3) Reference1. Cocoa beans Nigerian (EMC) 4.5 5.5 7.5 10.9 16.3 37(a) 3615 Ads ERH 28.7 46.7 73.4 86.2 93.225 Ads ERH 30.9 49.0 75.0 86.6 93.935 Ads ERH 32.1 51.3 74.3 86.5 93.8(EMC) 4.2 5.3 7.5 10.3 12.7 19.015 Des ERH 16.8 38.9 66.2 84.3 88.2 93.825 Des ERH 18.4 40.8 69.4 85.3 88.7 94.635 Des ERH 21.5 46.4 72.1 85.8 89.0 94.42. Hops California 25 Ads ERH 9.5 35.6 45.6 51.0 58.0 67.5 75.0 81.1 80.8 42(b) —Clusters EMC 3.2 4.8 5.5 6.1 6.9 8.1 9.2 10.2 11.425 Des ERH 9.6 18.1 32.0 41.3 47.6 55.2 54.5 68.9 72.1 74.7EMC 3.4 3.8 4.9 5.6 6.2 6.9 7.2 8.9 10.1 12.13. Potatoes Desiree 40 Ads ERH 5.8 12.5 19.7 29.2 37.7 53.2 75.3 88.4 87(b) 58EMC 2.4 3.2 4.0 5.1 7.1 8.9 13.3 18.7Des ERH 5.8 12.6 19.8 29.0 37.3 53.0 75.1 88.2EMC 2.2 2.9 3.5 5.0 6.3 8.5 12.9 18.450 Ads ERH 6.2 13.3 20.6 30.4 38.7 54.3 76.2 88.8EMC 2.1 3.1 3.7 4.9 6.4 8.1 12.1 16.6Des ERH 6.2 13.0 20.5 29.7 38.3 54.1 76.2 88.6EMC 2.1 2.8 3.3 4.5 6.0 8.2 12.8 17.160 Ads ERH 7.0 14.2 22.1 31.2 39.8 56.1 76.2 88.8EMC 2.0 2.7 3.4 4.4 5.4 6.5 9.9 14.7Des ERH 7.0 14.4 22.0 30.9 39.3 55.9 76.3 88.8EMC 1.8 2.4 3.1 4.2 5.3 7.6 11.8 16.370 Ads ERH 7.4 15.2 23.0 32.3 40.5 57.9 76.8 88.7EMC 1.8 2.2 2.3 3.4 4.2 6.0 8.4 13.6Des ERH 7.5 15.4 22.8 31.9 40.0 57.6 76.6 88.7 7.0EMC 1.5 2.0 2.4 3.1 4.8 7.2 11.0 14.7 1.84. Sugarbeet Raw roots 20 Des ERH 5.4 10.4 24.6 33.9 42.6 50.2 57.3 67.8 46(b) —root EMC 2.3 3.5 5.0 6.7 9.4 13.1 15.9 21.535 Des ERH 0.7 2.2 7.8 11.5 16.4 23.6 25.7 32.8 39.8 41.7 47.9 59.2 68.0EMC 1.8 2.0 1.6 2.9 3.0 4.2 3.8 5.9 7.9 8.6 10.1 13.1 20.447 Des ERH 3.7 8.5 11.6 25.0 29.8 32.4 40.3 46.2 48.0 56.2 60.1EMC 1.2 1.8 1.9 4.1 4.5 5.3 7.2 8.2 8.7 15.1 16.865 Des ERH 6.3 11.9 18.3 19.7 34.9 34.1 41.1 42.1 53.4 64.0 60.7EMC 0.7 1.5 2.2 2.3 2.6 3.7 6.8 6.9 12.5 17.5 18.55. Tobaccos a. Burley-21 20 Mix ERH 4.5 9.5 14.0 18.9 23.7 28.5 37.9 47.8 57.3 66.1 74.5 73(b) 21EMC 1.8 2.7 3.5 4.4 5.1 5.8 7.2 8.7 10.6 14.6 22.9b. BY-4 20 Mix ERH 4.8 10.0 14.9 19.7 24.3 29.1 38.2 47.7 56.8 65.6 72.3EMC 1.2 1.9 2.4 3.0 3.8 4.6 6.8 9.4 13.2 19.9 32.1c. Matsukawa 20 Mix ERH 4.8 9.8 14.2 19.2 23.9 28.8 37.9 47.8 57.7 66.9 75.3EMC 2.1 3.2 4.0 4.9 5.6 6.3 7.6 8.7 10.1 13.9 21.9d. Kroumougrad 20 Mix ERH 5.0 10.0 15.2 19.9 24.5 29.3 38.8 47.9 57.1 66.2 73.9EMC 0.9 1.7 2.1 2.6 3.4 4.1 5.8 8.2 11.3 15.6 25.7e. Midrib 20 Mix ERH 4.8 10.0 14.9 19.7 24.3 29.2 38.0 47.1 56.0 64.5 70.7EMC 1.2 2.0 2.5 3.1 4.0 5.0 7.1 10.6 15.4 23.1 37.71) ‘Ads’—Adsorption; ‘Des’—Desorption; ‘Mix’—Mixture <strong>of</strong> adsorption and desorption2) ‘(EMC)’ indicates the same EMC corresponding to the multi-ERH rows to follow for one single product3) ‘(a)’—original data from a reference; ‘(b)’—digitized values from figures in a reference532 ASAE STANDARDS 2001