Pan Arab Journal of Oncology - Arab Medical Association Against ...
Pan Arab Journal of Oncology - Arab Medical Association Against ...
Pan Arab Journal of Oncology - Arab Medical Association Against ...

You also want an ePaper? Increase the reach of your titles
YUMPU automatically turns print PDFs into web optimized ePapers that Google loves.
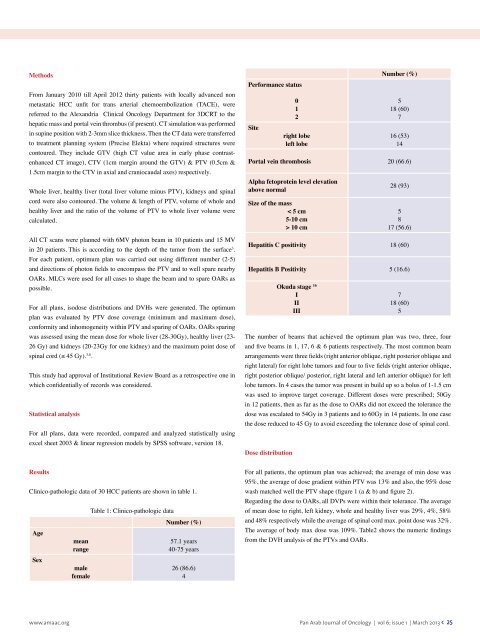
MethodsFrom January 2010 till April 2012 thirty patients with locally advanced nonmetastatic HCC unfit for trans arterial chemoembolization (TACE), werereferred to the Alexandria Clinical <strong>Oncology</strong> Department for 3DCRT to thehepatic mass and portal vein thrombus (if present). CT simulation was performedin supine position with 2-3mm slice thickness. Then the CT data were transferredto treatment planning system (Precise Elekta) where required structures werecontoured. They include GTV (high CT value area in early phase contrastenhancedCT image), CTV (1cm margin around the GTV) & PTV (0.5cm &1.5cm margin to the CTV in axial and craniocaudal axes) respectively.Whole liver, healthy liver (total liver volume minus PTV), kidneys and spinalcord were also contoured. The volume & length <strong>of</strong> PTV, volume <strong>of</strong> whole andhealthy liver and the ratio <strong>of</strong> the volume <strong>of</strong> PTV to whole liver volume werecalculated.All CT scans were planned with 6MV photon beam in 10 patients and 15 MVin 20 patients. This is according to the depth <strong>of</strong> the tumor from the surface 3 .For each patient, optimum plan was carried out using different number (2-5)and directions <strong>of</strong> photon fields to encompass the PTV and to well spare nearbyOARs. MLCs were used for all cases to shape the beam and to spare OARs aspossible.For all plans, isodose distributions and DVHs were generated. The optimumplan was evaluated by PTV dose coverage (minimum and maximum dose),conformity and inhomogeneity within PTV and sparing <strong>of</strong> OARs. OARs sparingwas assessed using the mean dose for whole liver (28-30Gy), healthy liver (23-26 Gy) and kidneys (20-23Gy for one kidney) and the maximum point dose <strong>of</strong>spinal cord (≤ 45 Gy). 3,8 .This study had approval <strong>of</strong> Institutional Review Board as a retrospective one inwhich confidentially <strong>of</strong> records was considered.Statistical analysisFor all plans, data were recorded, compared and analyzed statistically usingexcel sheet 2003 & linear regression models by SPSS s<strong>of</strong>tware, version 18.Performance statusSite012right lobeleft lobeNumber (%)518 (60)716 (53)14Portal vein thrombosis 20 (66.6)Alpha fetoprotein level elevationabove normalSize <strong>of</strong> the mass< 5 cm5-10 cm> 10 cm28 (93)5817 (56.6)Hepatitis C positivity 18 (60)Hepatitis B Positivity 5 (16.6)Okuda stage 16IIIIII718 (60)5The number <strong>of</strong> beams that achieved the optimum plan was two, three, fourand five beams in 1, 17, 6 & 6 patients respectively. The most common beamarrangements were three fields (right anterior oblique, right posterior oblique andright lateral) for right lobe tumors and four to five fields (right anterior oblique,right posterior oblique/ posterior, right lateral and left anterior oblique) for leftlobe tumors. In 4 cases the tumor was present in build up so a bolus <strong>of</strong> 1-1.5 cmwas used to improve target coverage. Different doses were prescribed; 50Gyin 12 patients, then as far as the dose to OARs did not exceed the tolerance thedose was escalated to 54Gy in 3 patients and to 60Gy in 14 patients. In one casethe dose reduced to 45 Gy to avoid exceeding the tolerance dose <strong>of</strong> spinal cord.Dose distributionResultsClinico-pathologic data <strong>of</strong> 30 HCC patients are shown in table 1.AgeSexmeanrangemalefemaleTable 1: Clinico-pathologic dataNumber (%)57.1 years40-75 years26 (86.6)4For all patients, the optimum plan was achieved; the average <strong>of</strong> min dose was95%, the average <strong>of</strong> dose gradient within PTV was 13% and also, the 95% dosewash matched well the PTV shape (figure 1 (a & b) and figure 2).Regarding the dose to OARs, all DVPs were within their tolerance. The average<strong>of</strong> mean dose to right, left kidney, whole and healthy liver was 29%, 4%, 58%and 48% respectively while the average <strong>of</strong> spinal cord max. point dose was 32%.The average <strong>of</strong> body max dose was 109%. Table2 shows the numeric findingsfrom the DVH analysis <strong>of</strong> the PTVs and OARs.www.amaac.org <strong>Pan</strong> <strong>Arab</strong> <strong>Journal</strong> <strong>of</strong> <strong>Oncology</strong> | vol 6; issue 1 | March 2013 < 25