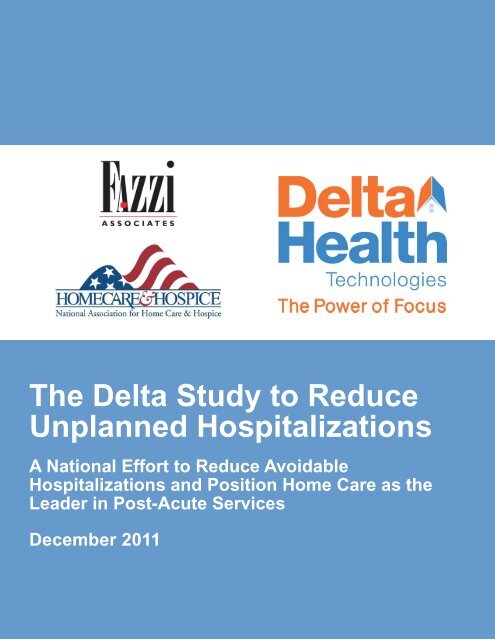
The Delta Study to Reduce Unplanned Hospitalizations
The Delta Study to Reduce Unplanned Hospitalizations
The Delta Study to Reduce Unplanned Hospitalizations
- No tags were found...

You also want an ePaper? Increase the reach of your titles
YUMPU automatically turns print PDFs into web optimized ePapers that Google loves.
Hospitals Are In TroubleHospitals throughout the United States continue <strong>to</strong> lose moneyon their Medicare business2005 2006 2007 2008 2009Inpatient -0.5% -2.2% -3.7% -4.7% -2.4%Outpatient -9.1% -10.9% -11.6% -12.7% -10.8%OverallMedicare-3.1% -4.7% -6.0% -7.1% -5.2%Source: MedPAC Report <strong>to</strong> the Congress: March 2011©2011Some Hospitals Are About <strong>to</strong> HaveEven Bigger Problems• CMS is now focusing on hospitals and demanding that theyreduce avoidable re-hospitalizations.• Effective Oc<strong>to</strong>ber 1, 2012, hospitals will be asked <strong>to</strong> reduce there-hospitalization of patients with three conditions:• AMI (Acute Myocardial Infarction or Heart Attack)• Pneumonia• Congestive Heart Failure• Hospitals who do not lower their rates will be penalized1% first year, 2% in 2014 and 3% in 2015.©2011RealityHome care specializes in theseconditionsandHome care can be the solution <strong>to</strong>hospital re-hospitalization problems.©2011Page 5
Facts on the <strong>Delta</strong> <strong>Study</strong>• Sponsor: <strong>Delta</strong> Health Technologies• Co-sponsor: National Association for Home Care& Hospice (NAHC)• Affiliated Sponsors• Home Health Quality Improvement (HHQI) NationalCampaign• NAHC Forum of State Associations• Community Health Accreditation Program• <strong>The</strong> Joint Commission• Home Health Section of the American Physical <strong>The</strong>rapyAssociation• Fazzi Associates, Inc.©2011How the <strong>Delta</strong> <strong>Study</strong> WorkedPhase I.Recruited National Steering Committee of cosponsors,affiliated sponsors, and industryexperts.Phase II. Conducted a National Input Survey on theweb <strong>to</strong> get recommendations from leaders onissues that they felt needed <strong>to</strong> be addressed orquestions that needed <strong>to</strong> be asked. Goal: 500.Actual: 3,600 plus.Phase III. Held National Expert Design Forum in SanDiego with Steering Committee <strong>to</strong> design thenational survey.©2011National Steering Committee• Barbara Brooks, VNA Care Network & Hospice, MA• Barbara Goodman, LHC Group, LA• Barbara Knott, Bon Secours Home Care, MD• Beth Anctil, Henry Ford Health System, MI• Caroline Pestrak, Elmhurst Memorial Home Care, IL• Donna Baldwin, Banner Homecare, AZ• Ellen Bolch, THA Group, Inc., GA• Karen Thomas, Oxford HealthCare Home Health andHospice, MO• Laura Reilly, Visiting Nurse Association of Colorado, CO©2011Page 6
How the <strong>Delta</strong> <strong>Study</strong> WorkedPhase IV. Field tested survey, refined, and tested more.Ultimately developed valid and reliable survey.Phase V.On July 21, 2011 CMS released the updated HomeHealth Compare scores. We identified agencieswith the lowest 20% hospitalization scores, highest20%, and most improved from previous scores.Phase VI. Conducted a 25 <strong>to</strong> 40 minute phone survey with792 agencies from August 1 <strong>to</strong> September 23, 2011.Phase VII. Begin presentations.©2011Location of Agencies by Region792 Agencies in 48 StatesRegion I 49Region II 39Region III 84Region IV 171Region V 149Region VI 136Region VII 45Region VIII 26Region IX 60Region X 33©2011Facts on the National <strong>Study</strong>1. Length: Nine months.2. Research Model Used: Best practice. Important goal was <strong>to</strong>find practices that were proven and would be of help <strong>to</strong> agencies.3. Focus: Agencies in the <strong>to</strong>p 20% of most successful agencies,the bot<strong>to</strong>m 20%, and the most improved 20%.4. Eligibility Criteria:• Budget in excess of $500,000.• Eight or more measures with percentages in the July 2011Home Health Compare scores.• Hospitalization was one of those measures.• Had a completed cost report filed with CMS.©2011Page 8
Segmentations: Who Participated• Ownership• Hospital Based 25%• Freestanding 75%• Location• Urban 33%• Rural 67%• Size• $500K <strong>to</strong> $999K 7%• $1M <strong>to</strong> $2.99M 42%• $3M <strong>to</strong> $5.99M 28%• $6M <strong>to</strong> $9.99M 13%• $10M+ 10%• Status• Proprietary 52%• Private 27%• Government 10%• Other 11%©2011Key Decisions Made During the <strong>Study</strong>1. Focus on the <strong>to</strong>p 20% and bot<strong>to</strong>m 20% in each stateand not national. Rationale: Environmental fac<strong>to</strong>rsshape scores.2. <strong>Reduce</strong> the number of “Most Improved. ” Rationale:Many still were in highest level of hospitalizations.3. Increase surveys of those with the best scores and thosewith the worst scores. Rationale: More <strong>to</strong> be learned.4. Segment out the practices of the <strong>to</strong>p 5% and lowest5%. Rationale: Greatest differences found here.©2011Interesting Insights• Twenty-two distinct strategies were identified bythe field.• Most agencies we studied used more than onestrategy. National average: ten.• <strong>The</strong> <strong>to</strong>p five strategies did not cost money.• Agencies who were successful were also very“intentional” in their efforts <strong>to</strong> reducehospitalizations.©2011Page 9
What Were the Intentional StrategiesThat Emerged From the <strong>Study</strong>?• 24 Hour Availability/Response System• Agency Awareness & Support• Audit Practices• Care Management• Care Transitions• Data Driven Strategies• Disease Management• Fall Prevention• Formal HospitalizationAvoidance Program• Front Loading• Non-medical Support Services• One Person in Charge• Patient/Caregiver Education• Point of Care• Risk Assessment• Staff Education• Strategies with ERs• Strategies with Hospitals• Strategies with Physicians• Telehealth• Telephonic Practices©2011How Frequently Were the Strategies Used?1. Fall Prevention: 94.9%2. Agency Awareness & Support:92.5%3. Front Loading: 89.0%4. Medication Mgt: 78.8%5. 24 Hour Availability/ResponseSystem: 78.5%6. Staff Education: 77.2%7. Care Mgt: 76.6%8. One Person in Charge: 73.3%9. Patient/Caregiver Education:70.6%10. Risk Assessment: 69.4%11. Formal HospitalizationAvoidance Program: 69.4%12. Audit Practices: 69.2%13. Point of Care: 63.5%14. Data Driven Strategies:62.1%15. Disease Management: 61%16. Non-medical SupportServices: 52.8%17. Telephonic Practices: 51%18. Strategies with Physicians:41.7%19. Care Transitions: 41.7%20. Strategies with Hospitals:38.9%21. Telehealth: 32.5%22. Strategies with ERs: 13.5%©2011<strong>The</strong> Top Five Strategies forReducing <strong>Unplanned</strong> <strong>Hospitalizations</strong>5. 24 HourAvailability/ResponseSystem: 78.5%4. Medication Management:78.8% 8%3. Front Loading: 89.0%2. Agency Awareness, Culture& Support: 92.5%1. Fall Prevention: 94.9%Note: Agencies used multiple strategies.©2011Page 10
Strategy 3: Front LoadingFront Load High Risk Patients for at Least Two WeeksWeek Hospitalization %OccurredWithin 1 week 25.44%Within 2 weeks 44.65%Within 3 weeks 57.93%MassPro, Reming<strong>to</strong>n Report, December 2005©2011Strategy 2: Agency Awareness,Culture and SupportWhy Having a Culture With Leadership and Accountability is soCritical <strong>to</strong> Reducing Avoidable <strong>Hospitalizations</strong>• Reality:“In the long run, people hit only what they aim at.”David Thoreau• Question:Is a commitment <strong>to</strong> quality and reducing hospitalizationreally part of your agency’s culture?©2011Culture: How Will You Ensure the Success of YourHospitalization Reduction Program? Ask Mike Phillips.• Who is Mike Phillips?• What do Mike Phillips andPi Prince have <strong>to</strong> do with ihreducing hospitalization?• What do they have <strong>to</strong> dowith our future?©2011Page 11
Strategy 1. Fall PreventionTop Seven Risk Fac<strong>to</strong>rs for Falls1. Difficulty walking/transferring2. Balance impairment3. Multiple medications4. Postural hypotension5. Vision/hearing impairment6. Feet and shoes7. Home hazardsSource: Connecticut Collaboration for Fall Prevention, Yale 2005©2011<strong>The</strong> Problem and the OpportunityStrategy% in Top 20%Lowest (Good)Fall Prevention 95.7%Agency Awareness & Support 93.5%Front Loading 90.3%Medication Management 76.8%24 Hour Availability/Response System 77.8%Staff Education 75.7%Care Management 77.8%One Person in Charge 75.7%Patient/Caregiver Education 70.8%Risk Assessment 67.8%% in Top 20%Highest (Bad)93.9%91.4%87.6%81.2%79.3%79.0%75.2%70.4%70.4%71.3%©2011What Does This All Mean?• All practices can work… and can fail.• <strong>The</strong> difference in success and failure is not thepractice, but the implementation of thepractices.• For most agencies, the answer will not costmoney, can be immediately implemented andwill be effective.• It starts with the development of a new model,one based on accountability and leadership.©2011Page 12
A Model that is Emerging:SafeSideHospitalization Reduction Model©2011CMS Quotes on Patient Safety1. “We will support efforts <strong>to</strong> help keep patientssafe.” HHS Secretary Kathleen Sebelius2. “A patient safety movement is afoot in the UShealth system,” Dr. Donald Berwick, CMS Administra<strong>to</strong>r“To err on the safe side”SafeSideHospitalization Reduction Program©2011Parameters for the Program1. Must include a logical standardized foundation androom for agencies <strong>to</strong> focus on unique best practice.2. Must be fully implementable in six months or less.3. Must cost little or no money.4. Must be focused, use existing agency resources, andnot require huge changes or <strong>to</strong>o much complexity.5. Must be based on solid management principles.©2011Page 13
Insights Used in Creating a SafeSide Program1. <strong>The</strong> knowledge and experience of National SteeringCommittees and Fazzi leadership group.2. Insights from Fazzi/Briggs National <strong>Study</strong>.3. Insights from Fazzi/Ohio Move <strong>to</strong> Improve Project.4. Insights from Fazzi/<strong>Delta</strong> Best Practices in ReducingAvoidable Hospitalization <strong>Study</strong>.5. Literature study of best practices.6. Insights from other Fazzi services.©2011Goals for Your Program1. To measurably reduce avoidable hospitalizations.2. To utilize a process that impacts and lowers cost.3. To develop a hospitalization reduction programthat helps your agency become a respected andvalued member of new health care initiatives inyour area.4. To build the program around solid principles.©2011<strong>The</strong> Model and ApproachHow <strong>to</strong> Create a SafeSide Program1. Get a Number2. Get a Leader3. Get the structure4. Pick Targeted PracticesImmediateImmediateImmediateTwo Months©2011Page 14
Bowling and SafeSidePercentage: 100% Score: 300Percentage: 83% Score: 249Percentage: 58% Score: 174Percentage: 34% Score: 102©2011Home Health Care Quality ScoresAssuming you have 10 hospitalizations/month resulting in yourHH Compare scores being 30%, what would happen if youreduced the number of hospitalizations by a fixed amount?Goal1010 <strong>to</strong> 910 <strong>to</strong> 810 <strong>to</strong> 710 <strong>to</strong> 5Amount ofReduction-HHC Score30%1Less 27%2Less 24%3Less21%5Less 15%©2011SafeSide StructureSafeSide Project Direc<strong>to</strong>r: Senior ManagerActivityDataCoordinationHospitalizationDashboardSafeSideUsing Hospital 30ComponentsHospitalizationPercentagesReal TimeAudits48-HourSafeSideAuditMonthlyAccountabilityPlanningMeetingSafeSideMonthlyAccountabilityMeetings(MAP)TargetedPractice1 – 2PracticesperQuarterLeadQI/PIClinicalDirec<strong>to</strong>r/SupervisorSafeSideProjectDirec<strong>to</strong>rClinicalDirec<strong>to</strong>r©2011Page 15
<strong>The</strong> Most Important Monthly Meeting of AllSecondMAPMeeting©2011Importance of Leadership for Change“<strong>The</strong> one thing thatdistinguished success projectsfrom less success was notmoney, the idea or theimportance of the project. Itwas the leader”.Dr. Steven SchroederPresident/CEORobert Wood Johnson Foundation1990 - 2001©2011Five Premises of theIdeal Program1. You can’t improve unless you have specific targetsand goals and the means <strong>to</strong> measure your success inthese areas in real time.2. Having goals that are impossible or <strong>to</strong>o difficultworks against you. So <strong>to</strong>o is having goals that are <strong>to</strong>oeasy.3. Having <strong>to</strong>o many options or strategies <strong>to</strong> meet yourgoal will not only not help, it can work against you.©2011Page 16
Five Premises of theIdeal Program4. Having limited strategies is not enough. You can’timprove unless you focus on the right strategies andinterventions, i.e., a select limited number of provenbest practice strategies.5. Having the right strategies is not enough. You can’timprove unless you build in an accountabilitysystem with key leaders responsible (accountable)for ensuring the success of the program. <strong>The</strong>SafeSide Accountability Meeting.©2011As You Initiate Change <strong>to</strong> Lower YourHospitalization Levels, Remember theJ Curve of Change• Whenever you initiate change, it never goesexactly how you expect.• <strong>The</strong>re is often resistance and the belief bysome that the change won’t work.• Like the letter J, the path may go down butit will go up.• Having a clear vision and an unwaveringcommitment for reducing hospitalizationswill absolutely lead <strong>to</strong> success.©2011To <strong>Reduce</strong> Avoidable <strong>Hospitalizations</strong>, Considerthe Advice of the World’s #1 TQM Guru“It is not enough <strong>to</strong> doyour best, you must KNOWwhat <strong>to</strong> do, and then do it.”W. Edward Deming©2011Page 17
Next Steps1. Release of the <strong>Delta</strong> Hospitalization Reduction BestPractice Report – Late December2. National test of the SafeSide HospitalizationReduction Model – Real time reduction of 25% orachieve <strong>to</strong>p 25% HH Compare score.a. Recruitment of 100 agencies: December – Januaryb. Project begins January – March 2012c. Project Completed: September 2012d. Final Report: Oc<strong>to</strong>ber 2012©2011413-584-5300www.fazzi.com©2011Page 18