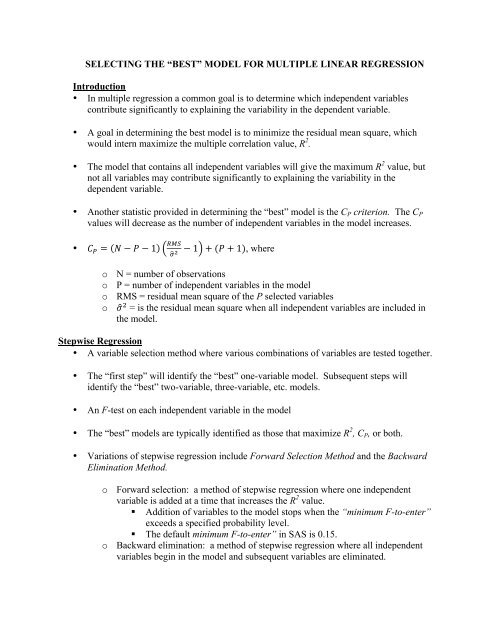
“BEST” MODEL FOR MULTIPLE LINEAR REGRESSION ...
“BEST” MODEL FOR MULTIPLE LINEAR REGRESSION ...
“BEST” MODEL FOR MULTIPLE LINEAR REGRESSION ...

Create successful ePaper yourself
Turn your PDF publications into a flip-book with our unique Google optimized e-Paper software.
Stepwise regression of father data The STEPWISE Procedure Model: <strong>MODEL</strong>1 Dependent Variable: ffev1 Number of Observations Read 150Number of Observations Used 150Stepwise Selection: Step 1Variable fheight Entered: R-Square = 0.2544 and C(p) = 23.1084SourceAnalysis of VarianceDFSum ofSquaresMeanSquare F Value Pr > FModel 1 16.05317 16.05317 50.50 FIntercept -4.08670 1.15198 4.00046 12.59 0.0005fheight 0.11811 0.01662 16.05317 50.50
Stepwise regression of father data The STEPWISE Procedure Model: <strong>MODEL</strong>1 Dependent Variable: ffev1 Stepwise Selection: Step 2 SourceAnalysis of VarianceDFSum ofSquaresMeanSquare F Value Pr > FModel 2 21.05697 10.52848 36.81 FIntercept -2.76075 1.13775 1.68392 5.89 0.0165fage -0.02664 0.00637 5.00380 17.50
Stepwise regression of youngest child data The STEPWISE Procedure Model: <strong>MODEL</strong>1 Dependent Variable: ycfev1 Number of Observations Read 150Number of Observations Used 24Number of Observations with Missing Values 126Forward Selection: Step 1Variable ycheight Entered: R-Square = 0.7801 and C(p) = 1.8825SourceAnalysis of VarianceDFSum ofSquaresMeanSquare F Value Pr > FModel 1 11.96424 11.96424 78.05 FIntercept -5.04327 0.81916 5.81028 37.90
Stepwise regression of youngest child data The STEPWISE Procedure Model: <strong>MODEL</strong>1 Dependent Variable: ycfev1 Forward Selection: Step 2 Analysis of VarianceSourceDFSum ofSquaresMeanSquare F Value Pr > FModel 2 12.16581 6.08290 40.29 FIntercept -4.23968 1.06990 2.37097 15.70 0.0007ycage 0.09168 0.07934 0.20157 1.33 0.2609ycheight 0.09510 0.03033 1.48458 9.83 0.0050Bounds on condition number: 4.5847, 18.339ycage is non-significantForward Selection: Step 3Variable ycweight Entered: R-Square = 0.7990 and C(p) = 4.0000SourceAnalysis of VarianceDFSum ofSquaresMeanSquare F Value Pr > FModel 3 12.25435 4.08478 26.51
Stepwise regression of youngest child data The STEPWISE Procedure Model: <strong>MODEL</strong>1 Dependent Variable: ycfev1 VariableParameterEstimateForward Selection: Step 3 StandardError Type II SS F Value Pr > FIntercept -5.16902 1.63451 1.54127 10.00 0.0049ycage 0.07990 0.08165 0.14759 0.96 0.3395ycheight 0.11965 0.04459 1.10969 7.20 0.0143ycweight -0.00401 0.00528 0.08854 0.57 0.4573ycage and ycweight are non-significantBounds on condition number: 9.7102, 57.311All variables have been entered into the model.Prediction Equation is Found in Step 1 ycfev1 ! = −5.043 + 0.126(ycheight) • Over 73% of the variation of ycfev1 is explained by having ycheight in the model.
Stepwise regression of youngest child data The STEPWISE Procedure Model: <strong>MODEL</strong>1 Dependent Variable: ycfev1 Forward Selection: Step 3 StepVariableEnteredSummary of Forward SelectionNumberVars InPartialR-SquareModelR-SquareC(p) F Value Pr > F1 ycheight 1 0.7801 0.7801 1.8825 78.05
Summary of Identifying the “Best” Model• The F-test for each independent variable is testing to determine if that variablecontributes significantly to the model given that the other independent variables in thestep are included in the model.• For example, in step 2 in the analysis of the father’s data, the null hypothesis being testedon the F-test for fage is H o :fage = 0 given fheight is already in the model.• For example, in step 3 in the analysis of the father’s data, the null hypothesis being testedon the F-test for fage is H o :fage = 0 given fheight and fweight are already in the model.• To determine which model “best” explains the variation in the dependent variable, findthe model where for the first time you detect that one of the independent variables doesnot significantly contribute to the model.• The model prior to this model is the one that should be used.• The cumulative R 2 *100 for this model tells you the percent of the variation in thedependent variable that is explained by having the identified independent variables in themodel.Considerations When Conducting Stepwise Regression• The selection of the “best” model is as good as the independent variables used in theanalyses. If important independent variables are not considered or are left out of theanalyses, the results obtained may have biased regression coefficients, low R 2 values orboth.• The tests should be considered a screening method, not tests of significance since the F-values calculated don’t necessarily match up with values in an F-table.• Like multiple linear regression, results from stepwise regression are sensitive toviolations of the assumptions underlying regression or problematic data.• To test the robustness of the independent variables identified to be important, analyzesubsets of the data to determine if the identified independent variables continue to bedetected as significant.