port elizabeth - EMIS - Eastern Cape Department of Education
port elizabeth - EMIS - Eastern Cape Department of Education
port elizabeth - EMIS - Eastern Cape Department of Education

You also want an ePaper? Increase the reach of your titles
YUMPU automatically turns print PDFs into web optimized ePapers that Google loves.
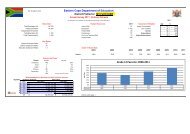
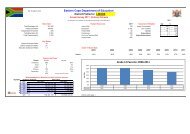
<strong>Eastern</strong> <strong>Cape</strong> <strong>Department</strong> <strong>of</strong> <strong>Education</strong>District Pr<strong>of</strong>ile for: PORT ELIZABETHAnnual Survey 2011: Ordinary Schools continued...(for definitions <strong>of</strong> the indicators on this page see 'About Data' via the Main Menu)InfrastructureInfrastructure (continued)School Condition: Number Percent Schools with: Number PercentPoor 0% Book room 137 49%Med 0% Classroom 250 89%Good 0% Computer 116 41%Schools (excl ECD) 281 General store / Safe 200 71%Hall (School) 85 30%Water Service Summary: Number Percent Kitchen - 0%NoWater 3 1.0% Kitchen – feeding scheme 57 20%Borehole 23 8.0% Kitchen – general 153 54%Tanker - 0.0% Laboratory 59 21%Communal 5 1.7% Library 108 38%Municipal 255 89.2% Office – Deputy principal 168 60%LT50 7 2.4% Office – General administration 200 71%BadCondition 19 6.6% Office – Head <strong>of</strong> department 82 29%286 Office - Principal 234 83%Power Summary: Number Percent Technical training centre 42 15%None 13 5.2% Staff room / Marking room 206 73%Generator - 0.0%Solar - 0.0% Efficiency IndicatorsGrid 237 94.8% Repeater Rate Dropout Rate250 Grade 1 7% 14%Grade 2 4% 3%Pure Mud Schools: Number Percent Grade 3 4% 3%Pure Mud - 0.0% Grade 4 3% 4%Male Learners - Grade 5 2% 2%Female Learners - Grade 6 2% 2%0 Grade 7 2% 0%Grade 8 6% 6%Grade 9 9% -4%Grade 10 13% 19%Grade 11 10% 18%District pr<strong>of</strong>ile page 2