port elizabeth - EMIS - Eastern Cape Department of Education
port elizabeth - EMIS - Eastern Cape Department of Education
port elizabeth - EMIS - Eastern Cape Department of Education

Create successful ePaper yourself
Turn your PDF publications into a flip-book with our unique Google optimized e-Paper software.
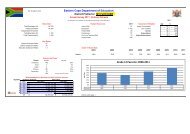
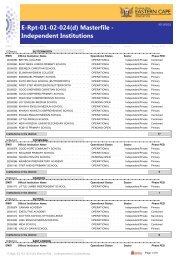
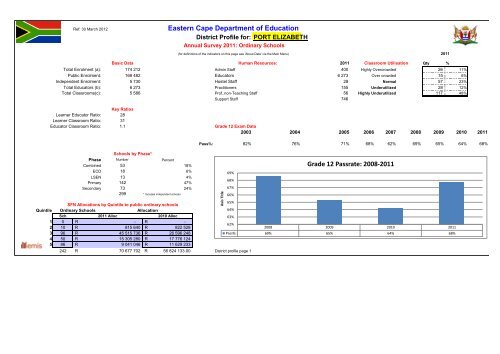
Axis TitleRef: 30 March 2012<strong>Eastern</strong> <strong>Cape</strong> <strong>Department</strong> <strong>of</strong> <strong>Education</strong>District Pr<strong>of</strong>ile for: PORT ELIZABETHAnnual Survey 2011: Ordinary Schools(for definitions <strong>of</strong> the indicators on this page see 'About Data' via the Main Menu)2011Basic Data Human Resources:2011 Classroom Utilisation Qty %Total Enrolment (a): 174 212 Admin Staff 400 Highly Overcrowded 26 11%Public Enrolment: 168 482 Educators 6 273 Over crowded 15 6%Independent Enrolment: 5 730 Hostel Staff 28 Normal 57 23%Total Educators (b): 6 273 Practitioners 155 Underutilized 28 12%Total Classrooms(c): 5 586 Pr<strong>of</strong>_non-Teaching Staff 56 Highly Underutilized 117 48%Total Toilets (d): 12 884 Sup<strong>port</strong> Staff 746 243Key RatiosLearner Educator Ratio: 28Learner Classroom Ratio: 31Educator Classroom Ratio: 1.1Grade 12 Exam DataLearner Toilet Ratio: 14 2003 2004 2005 2006 2007 2008 2009 2010 2011Nett Enrolment Rate - Primary: 1270500%Nett Enrolment Rate - Secondary: 1367300% Pass%: 82% 76% 71% 68% 62% 69% 65% 64% 68%Schools by Phase*Phase Number PercentCombined 53 18%ECD 18 6%LSEN 13 4%Primary 142 47%Secondary 73 24%299 * Includes independent schoolsSFN Allocations by Quintile to public ordinary schoolsQuintile Ordinary SchoolsAllocationSch2011 Alloc2010 Alloc1 0 R- R-2 10 R815 640 R822 5283 96 R45 515 736 R26 596 2484 50 R15 305 280 R17 776 1245 86 R9 041 046 R11 629 233242 R70 677 702 R 56 824 133.00District pr<strong>of</strong>ile page 169%68%67%66%65%64%63%62%Grade 12 Passrate: 2008-20112008 2009 2010 2011Pass%: 69% 65% 64% 68%
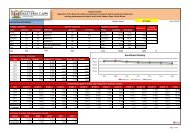
<strong>Eastern</strong> <strong>Cape</strong> <strong>Department</strong> <strong>of</strong> <strong>Education</strong>District Pr<strong>of</strong>ile for: PORT ELIZABETHAnnual Survey 2011: Ordinary Schools continued...(for definitions <strong>of</strong> the indicators on this page see 'About Data' via the Main Menu)InfrastructureInfrastructure (continued)School Condition: Number Percent Schools with: Number PercentPoor 0% Book room 137 49%Med 0% Classroom 250 89%Good 0% Computer 116 41%Schools (excl ECD) 281 General store / Safe 200 71%Hall (School) 85 30%Water Service Summary: Number Percent Kitchen - 0%NoWater 3 1.0% Kitchen – feeding scheme 57 20%Borehole 23 8.0% Kitchen – general 153 54%Tanker - 0.0% Laboratory 59 21%Communal 5 1.7% Library 108 38%Municipal 255 89.2% Office – Deputy principal 168 60%LT50 7 2.4% Office – General administration 200 71%BadCondition 19 6.6% Office – Head <strong>of</strong> department 82 29%286 Office - Principal 234 83%Power Summary: Number Percent Technical training centre 42 15%None 13 5.2% Staff room / Marking room 206 73%Generator - 0.0%Solar - 0.0% Efficiency IndicatorsGrid 237 94.8% Repeater Rate Dropout Rate250 Grade 1 7% 14%Grade 2 4% 3%Pure Mud Schools: Number Percent Grade 3 4% 3%Pure Mud - 0.0% Grade 4 3% 4%Male Learners - Grade 5 2% 2%Female Learners - Grade 6 2% 2%0 Grade 7 2% 0%Grade 8 6% 6%Grade 9 9% -4%Grade 10 13% 19%Grade 11 10% 18%District pr<strong>of</strong>ile page 2
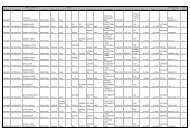
<strong>Eastern</strong> <strong>Cape</strong> <strong>Department</strong> <strong>of</strong> <strong>Education</strong>District Pr<strong>of</strong>ile for: PORT ELIZABETHAnnual Survey 2011: Ordinary Schools continued...Enrolment Trend:Trend 2009 - 2011 Ordinary Schools2009 172 1812010 174 2342011 168 482176 000174 000172 000170 000168 000166 000164 000(for definitions <strong>of</strong> the indicators on this page see 'About Data' via the Main Menu)172 181Enrolment : 2009 - 2011174 234168 4822009 2010 2011Grade 12 Enrolment:Trend 2009 - 2011 Ordinary Schools2009 8 4752010 8 6952011 7 09110 0008 0006 0004 000Grade 12 enrolment 2009 - 20118 475 8 6957 091Series12 000-2009 2010 2011Grade R Enrolment:Trend 2003 - 2009: Ordinary Schools2003 4 7412004 6 2482005 5 7672006 6 3552007 6 9022008 7 8402009 9 5992010 11 3432011 11 31615 00010 0005 000-4 7416 248 5 767 6 355 6 902Grade R Enrolment: 2003 - 20117 8409 59911 343 11 3162003 2004 2005 2006 2007 2008 2009 2010 2011Grade R Enrolment:District pr<strong>of</strong>ile page 3
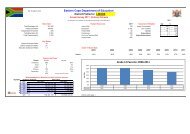
Axis TitleAxis TitleAxis Title<strong>Eastern</strong> <strong>Cape</strong> <strong>Department</strong> <strong>of</strong> <strong>Education</strong>District Pr<strong>of</strong>ile for: PORT ELIZABETHAnnual Survey 2011: Ordinary Schools continued...Post Provisioning:Posts Distributed: 2007 2008 2011 2012PL1 4129 4069 1733 1645HOD 647 685 253 233Deputy 209 208 48 41Principal 269 266 221 2215254 5228 2255 2140Learner mortality & Pregnancies:Re<strong>port</strong>ed deaths due to: 2008 2009 2010 2011Illness: 92 98 106 50Violence: 21 14 11 7Suicide: 5 6 4 3Accidents: 41 49 68 25Pregnancies re<strong>port</strong>ed for: 2008 2009 2010 2011Orphans with both parentsdeceased:5004003002001000409 426 395 3524424 5384 5618 5397Re<strong>port</strong>ed pregnancies2008 2009 2010 2011Series1 409 426 395 352Learner Mortality120100806040200Illness: Violence: Suicide: Accidents:2006 92 21 5 412007 98 14 6 492010 106 11 4 682011 50 7 3 25Orphans with both parents deceased60005000400030002000100002008 2009 2010 2011Series1 4424 5384 5618 5397District pr<strong>of</strong>ile page 4
<strong>Eastern</strong> <strong>Cape</strong> <strong>Department</strong> <strong>of</strong> <strong>Education</strong>District Pr<strong>of</strong>ile for: PORT ELIZABETHAnnual Survey 2011: Ordinary Schools continued...Post Provisioning 2012 SummaryPostsDistributedPerm Educators(Persal) Protected Temps Court Order TempsOrdinaryTempsPrincipals 255 237Deputies 237 190HOD 789 626PL 1 4519 4185 26 384 2Total 5800 5238 26 384 2Additionals and vacanciesAdditional Vacancies Nett ResultPrincipals -2 20 18Deputies -20 67 47HOD -28 191 163PL 1 -274 582 308Total -324 860 536Age Pr<strong>of</strong>ile AGE 55 - 59AGE 60 ANDABOVEPrincipals 73 156Deputies 34 42HOD 63 626PL 1 17 195Total 187 1019District pr<strong>of</strong>ile page 5