Table 3. Speakers of LOTEs, Both ELLs and<strong>English</strong> Proficient, 5-17-Year-Old StudentsLOTE Speakers 1979 2004 % GrowthELLs 1.3* 2.8 92%<strong>English</strong> Proficient 2.5 7.1 154%Total 3.8 9.9 161%* Numbers are given in the millions.Although the growing bilingual student population isan important resource in a globalized world, we focus inthis report only on <strong>English</strong> language learners (ELLs) becausethey are the students who need the most supportfrom the educational system. We warn, however, that asGarcía recently noted (2006b), ELLs are “only the tailof the elephant” (p. 40)— 2.8 million of the 10 millionbilingual and multilingual U.S. children. By focusing onlyon the elephant’s tail, or those students who are notproficient in <strong>English</strong>, we risk losing sight of the incrediblepotential of the millions of bilingual and multilingual childrenin this country who can become national resourcesin building a peaceful coexistence within a global societyand helping the United States remain economically viablein an increasingly multilingual world.How Are ELLs Designated?The ways in which students are designated/redesignatedin specific categories affect the calculation of numbersof ELLs. Unlike other categories of identificationsuch as ethnicity, race, and gender, the ELL classificationis fluid, and children move in and out of being classifiedas an ELL according <strong>to</strong> their progress <strong>to</strong>ward becomingfluent in <strong>English</strong> and the kind of policy that the state ordistrict mandates.Since the 1970s, based on federal civil rights legislationand federal case law, states have had <strong>to</strong> identifyELLs and ensure that their schools serve them (Linquanti,2001). Most states utilize the federal definitionof a LEP student as “one who has sufficient difficulty inthe use of <strong>English</strong> <strong>to</strong> prevent that individual from learningsuccessfully in classrooms in which the language ofinstruction is <strong>English</strong>” (Kindler, 2002, p. 9). But, as wenoted above, the criteria used <strong>to</strong> identify ELLs vary bystate and sometimes even by districts within a state(Zehler et al., 2003, p. 4).Usually, when students first register for a new school,they are given a home language survey, which containsquestions about the language used at home with caregivers,siblings, and peers. About 80% of all state educationalauthorities make use of home language surveys(Kindler, 2002). Students are then referred for languageproficiency assessment, although the assessment instrumentsvary greatly, with some school districts using languageproficiency tests, others achievement tests, andothers locally designed tests (also see Part III, below).Most assessments measure the students’ <strong>English</strong> listeningcomprehension and speaking skills for kindergartenersthrough second grade and reading and writing skills forthird graders and up.Most tests are commercially produced and are eithernorm referenced, which means each exam is measuredagainst scores of other students, or criterion andstandards based, meaning each exam is compared witha specific body of knowledge (see Center for Equity andExcellence in Education Test Database, 2005; Vialpando& Linse, 2005). The most commonly used language proficiencytests are the <strong>Language</strong> Assessment Scales (LAS),the IDEA <strong>Language</strong> Proficiency Tests (IPT), and theWoodcock-Muñoz <strong>Language</strong> Survey (Woodcock-Muñoz)(Kindler, 2002). Among the most commonly usedachievement tests are the Stanford Achievement Test(SAT 9) and the Iowa Tests of Basic Skills (ITBS) (Kindler,2002, p. 8). Some states and school districts have designedtheir own tests. 7 Recently, a consortium of statesknown as World-Class Instructional Design and Assessment(WIDA) have developed an <strong>English</strong> languageproficiency test for <strong>English</strong> language learners, along withstandards, known as ACCESS for ELLs. 8For the most part, school districts designate ELLsthrough a combination of information on the homelanguage survey, previous school achievement, informalteacher assessments, and formal assessment. Sometimes,if the school district is able <strong>to</strong> provide support or in-11The Campaign for Educational Equity
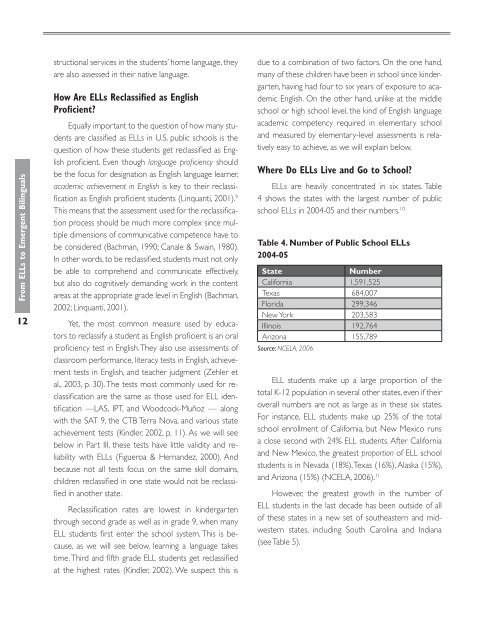
<strong>From</strong> ELLs <strong>to</strong> <strong>Emergent</strong> <strong>Bilinguals</strong>12structional services in the students’ home language, theyare also assessed in their native language.How Are ELLs Reclassified as <strong>English</strong>Proficient?Equally important <strong>to</strong> the question of how many studentsare classified as ELLs in U.S. public schools is thequestion of how these students get reclassified as <strong>English</strong>proficient. Even though language proficiency shouldbe the focus for designation as <strong>English</strong> language learner,academic achievement in <strong>English</strong> is key <strong>to</strong> their reclassificationas <strong>English</strong> proficient students (Linquanti, 2001). 9This means that the assessment used for the reclassificationprocess should be much more complex since multipledimensions of communicative competence have <strong>to</strong>be considered (Bachman, 1990; Canale & Swain, 1980).In other words, <strong>to</strong> be reclassified, students must not onlybe able <strong>to</strong> comprehend and communicate effectively,but also do cognitively demanding work in the contentareas at the appropriate grade level in <strong>English</strong> (Bachman,2002; Linquanti, 2001).Yet, the most common measure used by educa<strong>to</strong>rs<strong>to</strong> reclassify a student as <strong>English</strong> proficient is an oralproficiency test in <strong>English</strong>. They also use assessments ofclassroom performance, literacy tests in <strong>English</strong>, achievementtests in <strong>English</strong>, and teacher judgment (Zehler etal., 2003, p. 30). The tests most commonly used for reclassificationare the same as those used for ELL identification—LAS, IPT, and Woodcock-Muñoz — alongwith the SAT 9, the CTB Terra Nova, and various stateachievement tests (Kindler, 2002, p. 11). As we will seebelow in Part III, these tests have little validity and reliabilitywith ELLs (Figueroa & Hernandez, 2000). Andbecause not all tests focus on the same skill domains,children reclassified in one state would not be reclassifiedin another state.Reclassification rates are lowest in kindergartenthrough second grade as well as in grade 9, when manyELL students first enter the school system. This is because,as we will see below, learning a language takestime. Third and fifth grade ELL students get reclassifiedat the highest rates (Kindler, 2002). We suspect this isdue <strong>to</strong> a combination of two fac<strong>to</strong>rs. On the one hand,many of these children have been in school since kindergarten,having had four <strong>to</strong> six years of exposure <strong>to</strong> academic<strong>English</strong>. On the other hand, unlike at the middleschool or high school level, the kind of <strong>English</strong> languageacademic competency required in elementary schooland measured by elementary-level assessments is relativelyeasy <strong>to</strong> achieve, as we will explain below.Where Do ELLs Live and Go <strong>to</strong> School?ELLs are heavily concentrated in six states. Table4 shows the states with the largest number of publicschool ELLs in 2004-05 and their numbers. 10Table 4. Number of Public School ELLs2004-05StateNumberCalifornia 1,591,525Texas 684,007Florida 299,346New York 203,583Illinois 192,764Arizona 155,789Source: NCELA, 2006.ELL students make up a large proportion of the .<strong>to</strong>tal K-12 population in several other states, even if theiroverall numbers are not as large as in these six states.For instance, ELL students make up 25% of the <strong>to</strong>talschool enrollment of California, but New Mexico runsa close second with 24% ELL students. After Californiaand New Mexico, the greatest proportion of ELL schoolstudents is in Nevada (18%), Texas (16%), Alaska (15%),and Arizona (15%) (NCELA, 2006). 11However, the greatest growth in the number ofELL students in the last decade has been outside of all .of these states in a new set of southeastern and midwesternstates, including South Carolina and Indiana .(see Table 5).
- Page 1 and 2: EQUITY MATTERS: Research Review No.
- Page 3 and 4: TABLE of CONTENTSWhat’s in a Name
- Page 5 and 6: … [T]here is no equality of treat
- Page 7: Part I.Who Are the English Language
- Page 12 and 13: Table 5. Percentage Growth of ELL P
- Page 14 and 15: High-LEP schools are more likely to
- Page 16 and 17: Who Are the Latino ELLs?Spanish is
- Page 18 and 19: Table 8. Types of Educational Progr
- Page 20 and 21: lish speaking students in the quick
- Page 22 and 23: programs. In 1998, 30% of ELLs had
- Page 24 and 25: The Silencing of Bilingualism and B
- Page 26 and 27: studies of literacy. We argue that
- Page 28 and 29: there is much research support for
- Page 30 and 31: y the end of elementary school, whi
- Page 32 and 33: substantially from 34% to 48% (Zehl
- Page 34 and 35: content validity for these students
- Page 36 and 37: can have the question in English an
- Page 38 and 39: In a standards-based era, alignment
- Page 40 and 41: more difficult to find quality teac
- Page 42 and 43: In other words, there is great vari
- Page 44 and 45: Mercado (2005a) describes funds of
- Page 46 and 47: • Extend educational support to e
- Page 48 and 49: 12. We believe that the 75% estimat
- Page 50 and 51: Batalova, J. (2006). Spotlight on l
- Page 52 and 53: Epstein, J. L. (1990). School and f
- Page 54 and 55: Jewett, C., & Kress, G. (2003). Mul
- Page 56 and 57: Oakes, J., & Saunders, M. (2002, Oc
- Page 58 and 59: U.S. Census Bureau (2005) American
- Page 60 and 61:
AcknowledgmentsA number of people h