

exam-factories
exam-factories
exam-factories

You also want an ePaper? Increase the reach of your titles
YUMPU automatically turns print PDFs into web optimized ePapers that Google loves.
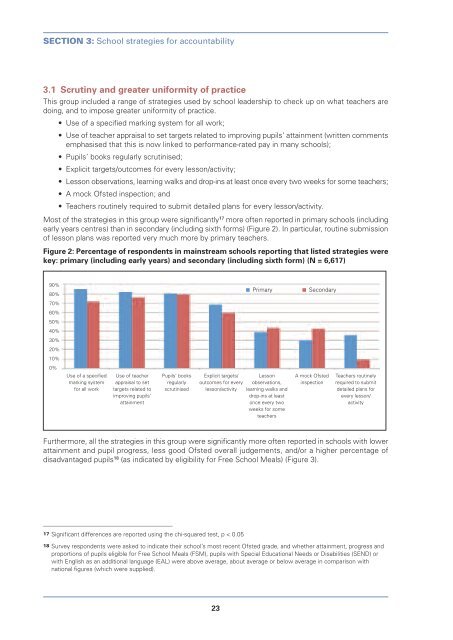
SECTION 3: School strategies for accountability3.1 Scrutiny and greater uniformity of practiceThis group included a range of strategies used by school leadership to check up on what teachers aredoing, and to impose greater uniformity of practice.• Use of a specified marking system for all work;• Use of teacher appraisal to set targets related to improving pupils’ attainment (written commentsemphasised that this is now linked to performance-rated pay in many schools);• Pupils’ books regularly scrutinised;• Explicit targets/outcomes for every lesson/activity;• Lesson observations, learning walks and drop-ins at least once every two weeks for some teachers;• A mock Ofsted inspection; and• Teachers routinely required to submit detailed plans for every lesson/activity.Most of the strategies in this group were significantly 17 more often reported in primary schools (includingearly years centres) than in secondary (including sixth forms) (Figure 2). In particular, routine submissionof lesson plans was reported very much more by primary teachers.Figure 2: Percentage of respondents in mainstream schools reporting that listed strategies werekey: primary (including early years) and secondary (including sixth form) (N = 6,617)90%80%70%60%50%40%30%20%10%0%PrimarySecondaryUse of a specifiedmarking systemfor all workUse of teacherappraisal to settargets related toimproving pupils’attainmentPupils’ booksregularlyscrutinisedExplicit targets/outcomes for everylesson/activityLessonobservations,learning walks anddrop-ins at leastonce every twoweeks for someteachersA mock OfstedinspectionTeachers routinelyrequired to submitdetailed plans forevery lesson/activityFurthermore, all the strategies in this group were significantly more often reported in schools with lowerattainment and pupil progress, less good Ofsted overall judgements, and/or a higher percentage ofdisadvantaged pupils 18 (as indicated by eligibility for Free School Meals) (Figure 3).17 Significant differences are reported using the chi-squared test, p < 0.0518 Survey respondents were asked to indicate their school’s most recent Ofsted grade, and whether attainment, progress andproportions of pupils eligible for Free School Meals (FSM), pupils with Special Educational Needs or Disabilities (SEND) orwith English as an additional language (EAL) were above average, about average or below average in comparison withnational figures (which were supplied).23