Counting Statistics and Error Prediction
Counting Statistics and Error Prediction
Counting Statistics and Error Prediction

Create successful ePaper yourself
Turn your PDF publications into a flip-book with our unique Google optimized e-Paper software.
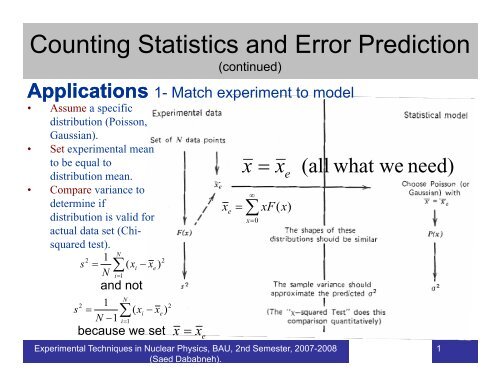
<strong>Counting</strong> <strong>Statistics</strong> <strong>and</strong> <strong>Error</strong> <strong>Prediction</strong>(continued)Applications 1- Match experiment to model• Assume a specificdistribution ib ti (Poisson,Gaussian).• Set experimental meanto be equal todistribution mean.• Compare variance todetermine ifxex =∑ ∞xdistribution is valid for=0actual data set (Chisquaredtest).N2 12s =∑(x i−x e)N i= 1<strong>and</strong> nots21=N1N∑( x i− x e)eN − i = 1because we set2x =x e= xF(x)Experimental Techniques in Nuclear Physics, BAU, 2nd Semester, 2007-2008(Saed Dababneh).xe(allwhat we need)1
<strong>Counting</strong> <strong>Statistics</strong> <strong>and</strong> <strong>Error</strong> <strong>Prediction</strong>• We can’t use Gaussianmodel for this data set.Why?• Qualitative comparison.•Is σ 2 close to s 2 ?s22σ1= ∑ NNi=11= x = 8.8( x i− x)2= 7.36• Close!? Less fluctuationthan predicted!• But quantitatively?• Chi-squared test.Back to our exampleOnly to guidethe eye!HW 17Experimental Techniques in Nuclear Physics, BAU, 2nd Semester, 2007-2008(Saed Dababneh).2
<strong>Counting</strong> <strong>Statistics</strong> <strong>and</strong> <strong>Error</strong> <strong>Prediction</strong>Chi-squared2 1Nxei=1∑By definition: χ = ( x − x )Thus:or2χ2χi2( N −1) s ( N −1)e22s ⎛ 19×7.36 ⎞= =⎜== 15. 8912⎟x σ ⎝ 8.8 ⎠=s22( N −1) σeThe degree to which χ 2 differs from (N-1) is a measure of the departure of thedata from predictions of the distribution.Experimental Techniques in Nuclear Physics, BAU, 2nd Semester, 2007-2008(Saed Dababneh).3
<strong>Counting</strong> <strong>Statistics</strong> <strong>and</strong> <strong>Error</strong> <strong>Prediction</strong>smaller largerPerfectfit15.891 (interpolation) orhttp://www.anu.edu.au/nceph/surfstat/surfstat-home/tables/chi.phpeither gives ρ = 0.6645Conclusion:no abnormal fluctuation.Experimental Techniques in Nuclear Physics, BAU, 2 nd Semester, 2007-2008(Saed Dababneh).4
<strong>Counting</strong> <strong>Statistics</strong> <strong>and</strong> <strong>Error</strong> <strong>Prediction</strong>Single measurementS 2 = σ 2≈ xx = xx ± ∆ ± σ=x ±x68% probability that thisinterval includes the trueaverage value.What if we want 99%..?Fractional st<strong>and</strong>ard deviation∆x 1=Need 1%?x Count 10000.xExperimental Techniques in Nuclear Physics, BAU, 2nd Semester, 2007-2008(Saed Dababneh).5
<strong>Counting</strong> <strong>Statistics</strong> <strong>and</strong> <strong>Error</strong> <strong>Prediction</strong>A series of“single”measurements.Experimental Techniques in Nuclear Physics, BAU, 2nd Semester, 2007-2008(Saed Dababneh).6
<strong>Counting</strong> <strong>Statistics</strong> <strong>and</strong> <strong>Error</strong> <strong>Prediction</strong>• What about derived quantities? (<strong>Error</strong> propagation).Net counts = Gross counts – BackgroundDerivedMeasuredGross counts = 1000Background counts = 400Net counts = 600 ± 37 (not 600 ± 24)Compare to additioninstead of subtraction.(Count, stop, count).Count Rate = ? ± ?Experimental Techniques in Nuclear Physics, BAU, 2nd Semester, 2007-2008(Saed Dababneh).7
<strong>Counting</strong> <strong>Statistics</strong> <strong>and</strong> <strong>Error</strong> <strong>Prediction</strong>Mean value of multiple independent counts.• Assume we record N repeated counts from a single source for equal countingtimes:∑ =x+x++x1 2...N2 2 2σ ∑=σx+σx+ ...+• For Poisson or Gaussian distributions:σ2x1 2Nσ=ixXx iSo thatσ2∑=x +x+ ...1 2+xN= ∑σ∑=∑Experimental Techniques in Nuclear Physics, BAU, 2nd Semester, 2007-2008(Saed Dababneh).8
<strong>Counting</strong> <strong>Statistics</strong> <strong>and</strong> <strong>Error</strong> <strong>Prediction</strong>x = ∑ NxSt<strong>and</strong>ard d error of the mean σ x = N= σ ∑ ∑ Nxσ x = =N N N• To improve statistical precision of a given measurement by a factor of tworequires four times the initial counting time.Experimental Techniques in Nuclear Physics, BAU, 2nd Semester, 2007-2008(Saed Dababneh).9
<strong>Counting</strong> <strong>Statistics</strong> <strong>and</strong> <strong>Error</strong> <strong>Prediction</strong>Optimizing counting time.S = source count rate.B = background count rate.T S+B = time to count source + background.T B = time to count background.How to divide the limited available beam time?To minimize σ s :T S+B= S + BBT BoptimumExperimental Techniques in Nuclear Physics, BAU, 2nd Semester, 2007-2008(Saed Dababneh).10
<strong>Counting</strong> <strong>Statistics</strong> <strong>and</strong> <strong>Error</strong> <strong>Prediction</strong>• Background measurement?• Without the “source”.• Should include all sourcesexcept the “source”.• Accelerator applications:background with beam.HW 18• Minimum detectable amount.• False positives <strong>and</strong> false negatives.• Rest of Chapter 3.Experimental Techniques in Nuclear Physics, BAU, 2nd Semester, 2007-2008(Saed Dababneh).11