Automated SKS splitting and upper-mantle anisotropy beneath ... - bris
Automated SKS splitting and upper-mantle anisotropy beneath ... - bris
Automated SKS splitting and upper-mantle anisotropy beneath ... - bris

Create successful ePaper yourself
Turn your PDF publications into a flip-book with our unique Google optimized e-Paper software.
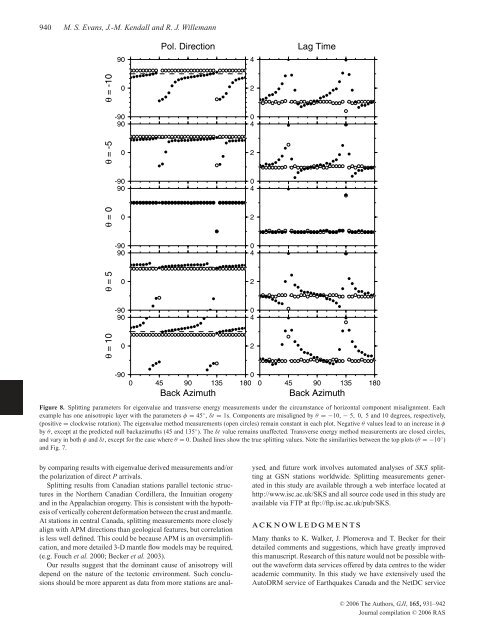
940 M. S. Evans, J.-M. Kendall <strong>and</strong> R. J. WillemannFigure 8. Splitting parameters for eigenvalue <strong>and</strong> transverse energy measurements under the circumstance of horizontal component misalignment. Eachexample has one anisotropic layer with the parameters φ = 45 ◦ , δt = 1s. Components are misaligned by θ = −10, − 5, 0, 5 <strong>and</strong> 10 degrees, respectively,(positive = clockwise rotation). The eigenvalue method measurements (open circles) remain constant in each plot. Negative θ values lead to an increase in φby θ, except at the predicted null backazimuths (45 <strong>and</strong> 135 ◦ ). The δt value remains unaffected. Transverse energy method measurements are closed circles,<strong>and</strong> vary in both φ <strong>and</strong> δt, except for the case where θ = 0. Dashed lines show the true <strong>splitting</strong> values. Note the similarities between the top plots (θ = −10 ◦ )<strong>and</strong> Fig. 7.by comparing results with eigenvalue derived measurements <strong>and</strong>/orthe polarization of direct P arrivals.Splitting results from Canadian stations parallel tectonic structuresin the Northern Canadian Cordillera, the Innuitian orogeny<strong>and</strong> in the Appalachian orogeny. This is consistent with the hypothesisof vertically coherent deformation between the crust <strong>and</strong> <strong>mantle</strong>.At stations in central Canada, <strong>splitting</strong> measurements more closelyalign with APM directions than geological features, but correlationis less well defined. This could be because APM is an oversimplification,<strong>and</strong> more detailed 3-D <strong>mantle</strong> flow models may be required,(e.g. Fouch et al. 2000; Becker et al. 2003).Our results suggest that the dominant cause of <strong>anisotropy</strong> willdepend on the nature of the tectonic environment. Such conclusionsshould be more apparent as data from more stations are analysed,<strong>and</strong> future work involves automated analyses of <strong>SKS</strong> <strong>splitting</strong>at GSN stations worldwide. Splitting measurements generatedin this study are available through a web interface located athttp://www.isc.ac.uk/<strong>SKS</strong> <strong>and</strong> all source code used in this study areavailable via FTP at ftp://ftp.isc.ac.uk/pub/<strong>SKS</strong>.A C K N O W L E D G M E N T SMany thanks to K. Walker, J. Plomerova <strong>and</strong> T. Becker for theirdetailed comments <strong>and</strong> suggestions, which have greatly improvedthis manuscript. Research of this nature would not be possible withoutthe waveform data services offered by data centres to the wideracademic community. In this study we have extensively used theAutoDRM service of Earthquakes Canada <strong>and</strong> the NetDC serviceC○ 2006 The Authors, GJI, 165, 931–942Journal compilation C○ 2006 RAS