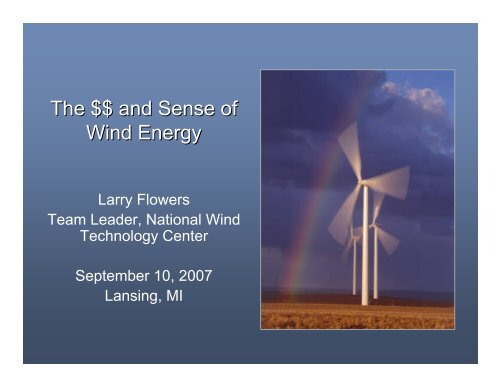
The $$ and Sense of Wind Energy - Noble Environmental Power
The $$ and Sense of Wind Energy - Noble Environmental Power
The $$ and Sense of Wind Energy - Noble Environmental Power
- No tags were found...
Create successful ePaper yourself
Turn your PDF publications into a flip-book with our unique Google optimized e-Paper software.
Historical Coal PricesSource: EIA
“<strong>Wind</strong> energy adds diversity to our generation fleet <strong>and</strong> provides a hedgeagainst fossil fuel price increases. In addition, the development <strong>of</strong> renewableenergy resources is widely supported by the public <strong>and</strong> our customers.”Rick Walker, director, Renewable <strong>Energy</strong> Business Development, AEP<strong>Energy</strong> Services, Inc., Dallas, TX
<strong>Wind</strong> <strong>Energy</strong> Investors
<strong>Wind</strong> energy boosts economic development
Economic Development Impacts• L<strong>and</strong> Lease Payments: 2-3% <strong>of</strong> grossrevenue $2500-4000/MW/year• Local property tax revenue: ranges widely -$300K-1700K/yr per 100MW• 100-200 jobs/100MW during construction• 6-10 permanent O&M jobs per 100 MW• Local construction <strong>and</strong> service industry:concrete, towers usually done locally
Case Study: TexasUtilities <strong>and</strong> wind companiesinvested $1B in 2001 to build912 MW <strong>of</strong> new wind power,resulting in:• 2,500 quality jobs with apayroll <strong>of</strong> $75M• $13.3M in tax revenuesfor schools <strong>and</strong> counties• $2.5M in 2002 royaltyincome to l<strong>and</strong>owners• Another 2,900 indirectjobs as a result <strong>of</strong> themultiplier effect• $4.6M increase in PecosCounty property taxrevenue in 2002
“Converting the wind into a much-needed commodity while providinggood jobs, the Colorado Green <strong>Wind</strong> Farm is a boost to the localeconomy <strong>and</strong> tax base.”John Stulp, Ag Commissioner, Colorado
Michigan resultsTotal economic impacts from new wind <strong>and</strong> coal plants in Michigan(direct, indirect <strong>and</strong> induced)Construction + 20 yrs <strong>of</strong> operationMillions$1,400$1,200$1,000$800$600$400$200L<strong>and</strong>owner revenueProperty taxesOperationsConstruction$-<strong>Wind</strong> (715 MW) <strong>Wind</strong> (2.5% tax) Coal (250 MW)
Michigan – Economic Impactsfrom 1000 MW <strong>of</strong> new wind development<strong>Wind</strong> energy’s economic “ripple effect”Direct ImpactsPayments to L<strong>and</strong>owners:• $2.7 million/yearLocal Property Tax Revenue:• $18.6 million/yearConstruction Phase:• 1426 new construction jobs• $188.5 M to local economiesOperational Phase:• 230 new long-term jobs• $21.2 M/yr to local economiesIndirect ImpactsConstruction Phase:• 560 new jobs• $53.5 M to localeconomiesOperational Phase:• 60 local jobs• $6.6 M/yr to localeconomiesInduced ImpactsConstruction Phase:• 844 new jobs• $83.4 M to localeconomiesOperational Phase:• 217 local jobs• $21.5 M/yr to localeconomiesTotals (construction + 20 yrs)Total economic benefit to Michigan = $1.3 billionNew local jobs during construction = 2830New local long-term jobs = 507Construction Phase = 1-2 yearsOperational Phase = 20+ years
<strong>Wind</strong> energy doesn’t t consume water
Sustainable Withdrawal Of FreshwaterIs National IssueSource: EPRI 2003
<strong>Wind</strong> is a homegrown energy source
Michigan <strong>Wind</strong> Resources<strong>Wind</strong> Potential: 0.85 GW(> 32% Capacity Factor)<strong>Wind</strong> Potential: 15 GW<strong>Wind</strong> Potential: 254 GW
NorthAmericanNatural GasFuture
<strong>Wind</strong> energy isinexhaustible <strong>and</strong> infinitely renewable
U.S. OIL PRODUCTION 1900 TO 2050PEAK 1970GONE: 65% OFU.S. OIL HASBEEN USED.IT’S HISTORY.2001DOWNTHE OIL“OFFRAMP”1900 1910 1920 1930 1940 1950 1960 1970 1980 1990 2000 2010 2020 2030 2040 2050PRUDHOE BAY PRODUCTIONGONELEFT
<strong>The</strong> North Carolina Analog
<strong>Wind</strong> energy has many environmentalbenefits
<strong>Environmental</strong> Benefits•No SOxor NOx• No particulates• No mercury•No CO2•No water
People Want Renewable <strong>Energy</strong>!Capacity (MW)8000075000700006500060000550005000045000400003500030000250002000015000100005000019821983Source: <strong>Wind</strong><strong>Power</strong> Monthly1. Germany: 20952 MW2. Spain: 12500 MW3. United States: 12376 MW4. India: 7093 MW5. Denmark: 3136 MW1984198519861987198819891990Total Installed <strong>Wind</strong> CapacityWorld total July 2007: 78728 MWUnited States Europe Rest <strong>of</strong> World19911992199319941995199619971998199920002001200220032004200520062007
Installed <strong>Wind</strong> Capacities (99-May 07)
Renewables Portfolio St<strong>and</strong>ards*WA: 15% by 2020OR: 25% by 2025 (large utilities)5% - 10% by 2025 (smaller utilities)CA: 20% by 2010☼ *NV: 20% by 2015☼ AZ: 15% by 2025MT: 15% by 2015☼ NM: 20% by 2020 (IOUs)10% by 2020 (co-ops)ND: 10% by 2015MN: 25% by 2025(Xcel: 30% by 2020)IA: 105 MW☼ CO: 20% by 2020 (IOUs)*10% by 2020 (co-ops & large munis)WI: requirement varies byutility; 10% by 2015 goalIL: 25% by 2025MO: 11% by 2020VT: RE meets loadgrowth by 2012☼ NC: 12.5% by 2021 (IOUs)10% by 2018 (co-ops & munis)ME: 30% by 200010% by 2017 - new RE☼ NH: 23.8% in 2025MA: 4% by 2009 +1% annual increaseRI: 16% by 2020CT: 23% by 2020☼ NY: 24% by 2013☼ NJ: 22.5% by 2021☼ PA: 18%¹ by 2020☼ MD: 9.5% in 2022☼ *DE: 20% by 2019☼ DC: 11% by 2022*VA: 12% by 2022HI: 20% by 2020TX: 5,880 MW by 2015☼ Minimum solar or customer-sited RE requirement* Increased credit for solar or customer-sited RE¹PA: 8% Tier I / 10% Tier II (includes non-renewables); SWH is a Tier II resourceState RPSState GoalDSIRE: www.dsireusa.org August 2007
“In my 44 years in the municipal utility business, no utility project has evergenerated more customer support <strong>and</strong> interest than our wind turbineproject.”Nick Scholer, former manager <strong>of</strong> Algona Municipal Utilities, Algona, Iowa
<strong>Wind</strong> energy is the fuel <strong>of</strong> today <strong>and</strong> tomorrow
“<strong>The</strong> future ain’t what it used to be.”- Yogi Berra
Note about Ohio.
Levelized Cost <strong>of</strong> <strong>Energy</strong>, $/MWh14012010080604020OnshoreClass 7Class 6Class 5Class 4Class 3OffshoreClass 7Class 6Class 5Class 4Class 310% AvailableTransmission0- 200 400 600 800 1,000Quantity Available, GW2010 Costs w/ PTC, $1,600/MW-mile, w/o Integration costs
What does 20% <strong>Wind</strong> look like?Cumulative Installed Capacity (GW)50045040035030025020015010050Cumulative Capacity (left scale)Annual Capacity (right scale)18161412108642Annual Installed Capacity (GW)02000 2006 2012 2018 2024 20300Source: AWEA 20% Vision
Conclusions• 20% wind energy penetration is possible• 20% penetration is not going to happen under businessas usual scenario• Policy choices will have a large impact on assessing thetiming <strong>and</strong> rate <strong>of</strong> achieving a 20% goal• Key Issues: market transformation, transmission, projectdiversity, technology development, policy, publicacceptance• 20% Vision action plan: Fall 2007Source: AWEA 20% Vision
“With public sentiment nothing can fail;without it, nothing can succeed.”- A. Lincoln
Carpe Ventemwww.windpoweringamerica.gov


