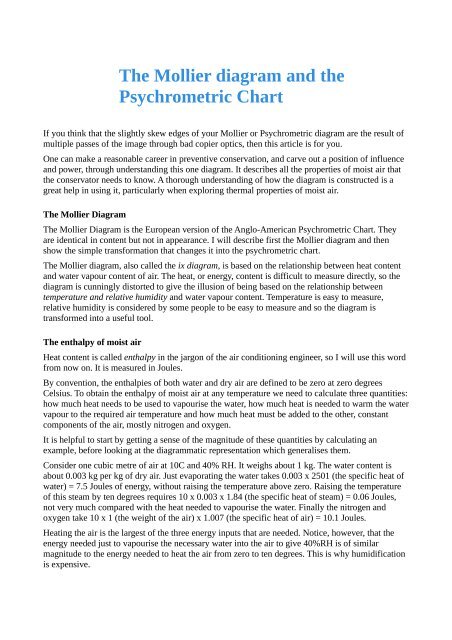
The Mollier diagram and the Psychrometric Chart - Conservation ...
The Mollier diagram and the Psychrometric Chart - Conservation ...
The Mollier diagram and the Psychrometric Chart - Conservation ...

Create successful ePaper yourself
Turn your PDF publications into a flip-book with our unique Google optimized e-Paper software.
<strong>The</strong> <strong>Mollier</strong> <strong>diagram</strong> <strong>and</strong> <strong>the</strong><strong>Psychrometric</strong> <strong>Chart</strong>If you think that <strong>the</strong> slightly skew edges of your <strong>Mollier</strong> or <strong>Psychrometric</strong> <strong>diagram</strong> are <strong>the</strong> result ofmultiple passes of <strong>the</strong> image through bad copier optics, <strong>the</strong>n this article is for you.One can make a reasonable career in preventive conservation, <strong>and</strong> carve out a position of influence<strong>and</strong> power, through underst<strong>and</strong>ing this one <strong>diagram</strong>. It describes all <strong>the</strong> properties of moist air that<strong>the</strong> conservator needs to know. A thorough underst<strong>and</strong>ing of how <strong>the</strong> <strong>diagram</strong> is constructed is agreat help in using it, particularly when exploring <strong>the</strong>rmal properties of moist air.<strong>The</strong> <strong>Mollier</strong> Diagram<strong>The</strong> <strong>Mollier</strong> Diagram is <strong>the</strong> European version of <strong>the</strong> Anglo-American <strong>Psychrometric</strong> <strong>Chart</strong>. <strong>The</strong>yare identical in content but not in appearance. I will describe first <strong>the</strong> <strong>Mollier</strong> <strong>diagram</strong> <strong>and</strong> <strong>the</strong>nshow <strong>the</strong> simple transformation that changes it into <strong>the</strong> psychrometric chart.<strong>The</strong> <strong>Mollier</strong> <strong>diagram</strong>, also called <strong>the</strong> ix <strong>diagram</strong>, is based on <strong>the</strong> relationship between heat content<strong>and</strong> water vapour content of air. <strong>The</strong> heat, or energy, content is difficult to measure directly, so <strong>the</strong><strong>diagram</strong> is cunningly distorted to give <strong>the</strong> illusion of being based on <strong>the</strong> relationship betweentemperature <strong>and</strong> relative humidity <strong>and</strong> water vapour content. Temperature is easy to measure,relative humidity is considered by some people to be easy to measure <strong>and</strong> so <strong>the</strong> <strong>diagram</strong> istransformed into a useful tool.<strong>The</strong> enthalpy of moist airHeat content is called enthalpy in <strong>the</strong> jargon of <strong>the</strong> air conditioning engineer, so I will use this wordfrom now on. It is measured in Joules.By convention, <strong>the</strong> enthalpies of both water <strong>and</strong> dry air are defined to be zero at zero degreesCelsius. To obtain <strong>the</strong> enthalpy of moist air at any temperature we need to calculate three quantities:how much heat needs to be used to vapourise <strong>the</strong> water, how much heat is needed to warm <strong>the</strong> watervapour to <strong>the</strong> required air temperature <strong>and</strong> how much heat must be added to <strong>the</strong> o<strong>the</strong>r, constantcomponents of <strong>the</strong> air, mostly nitrogen <strong>and</strong> oxygen.It is helpful to start by getting a sense of <strong>the</strong> magnitude of <strong>the</strong>se quantities by calculating anexample, before looking at <strong>the</strong> <strong>diagram</strong>matic representation which generalises <strong>the</strong>m.Consider one cubic metre of air at 10C <strong>and</strong> 40% RH. It weighs about 1 kg. <strong>The</strong> water content isabout 0.003 kg per kg of dry air. Just evaporating <strong>the</strong> water takes 0.003 x 2501 (<strong>the</strong> specific heat ofwater) = 7.5 Joules of energy, without raising <strong>the</strong> temperature above zero. Raising <strong>the</strong> temperatureof this steam by ten degrees requires 10 x 0.003 x 1.84 (<strong>the</strong> specific heat of steam) = 0.06 Joules,not very much compared with <strong>the</strong> heat needed to vapourise <strong>the</strong> water. Finally <strong>the</strong> nitrogen <strong>and</strong>oxygen take 10 x 1 (<strong>the</strong> weight of <strong>the</strong> air) x 1.007 (<strong>the</strong> specific heat of air) = 10.1 Joules.Heating <strong>the</strong> air is <strong>the</strong> largest of <strong>the</strong> three energy inputs that are needed. Notice, however, that <strong>the</strong>energy needed just to vapourise <strong>the</strong> necessary water into <strong>the</strong> air to give 40%RH is of similarmagnitude to <strong>the</strong> energy needed to heat <strong>the</strong> air from zero to ten degrees. This is why humidificationis expensive.
per cubic metre will be exactly <strong>the</strong> same as in air at normal atmospheric pressure. <strong>The</strong> concentrationof air in kilograms per cubic metre has, however, doubled. <strong>The</strong>refore <strong>the</strong> concentration of watervapour per kilogram of air will be only half that in air at atmospheric pressure. <strong>The</strong> st<strong>and</strong>ardatmospheric pressure for <strong>the</strong> <strong>Mollier</strong> Diagram is 100.3 kiloPascal. I will return to <strong>the</strong> effect of airpressure in a later article: it causes some ra<strong>the</strong>r mysterious traces on dataloggers packed with artworks into aircraft baggage compartments.<strong>The</strong> limit for <strong>the</strong> amount of water vapour in air increases ever more rapidly with temperature. <strong>The</strong>limit is shown as <strong>the</strong> blue curve on <strong>the</strong> <strong>diagram</strong> to <strong>the</strong> left. <strong>The</strong> region to <strong>the</strong> right of <strong>the</strong> curvecannot be reached in reality, so we can remove <strong>the</strong> lines in this region. Notice that <strong>the</strong> horizontalaxis is still water vapour, x, even after shearing <strong>the</strong> <strong>diagram</strong>. We can <strong>the</strong>refore tidy up by removing<strong>the</strong> bottom of <strong>the</strong> <strong>diagram</strong>, so that it fills a rectangular page better.<strong>The</strong> only thing remaining to do is to embellish <strong>the</strong> left h<strong>and</strong> sideof <strong>the</strong> <strong>diagram</strong> with lines which run at a constant distance ratiobetween <strong>the</strong> vertical axis <strong>and</strong> <strong>the</strong> heavy blue curve. <strong>The</strong>se linesjoin points of equal relative humidity. Relative humidity is <strong>the</strong>water vapour concentration expressed as a percentage (or afraction, to be pedantic) of <strong>the</strong> maximum possible water vapourconcentration. 50%RH will <strong>the</strong>refore be represented by <strong>the</strong> lineexactly half way between <strong>the</strong> vertical axis <strong>and</strong> <strong>the</strong> limitingwater content.At this point <strong>the</strong> Central European reader can choose to stop,unless she uses Garry Thomson's book <strong>The</strong> MuseumEnvironment as an essential reference. For her, <strong>and</strong> for AngloAmerican readers <strong>the</strong>re is one fur<strong>the</strong>r step:
Transforming <strong>the</strong> <strong>Mollier</strong> <strong>diagram</strong> into <strong>the</strong> psychrometric chart<strong>The</strong> <strong>Psychrometric</strong> <strong>Chart</strong> is <strong>the</strong> same as <strong>the</strong> <strong>Mollier</strong> <strong>diagram</strong>, first reflected in a vertical mirror <strong>and</strong><strong>the</strong>n rotated through 90 degrees:Copyright: Tim Padfield 2008. Creative Commons licence: you may copy <strong>and</strong> redistribute thisarticle but you must acknowledge <strong>the</strong> author, you may not make changes <strong>and</strong> you may not sell <strong>the</strong>article.