Partial Least Square Model for Customer Re ... - Wbiaus.org
Partial Least Square Model for Customer Re ... - Wbiaus.org
Partial Least Square Model for Customer Re ... - Wbiaus.org

You also want an ePaper? Increase the reach of your titles
YUMPU automatically turns print PDFs into web optimized ePapers that Google loves.
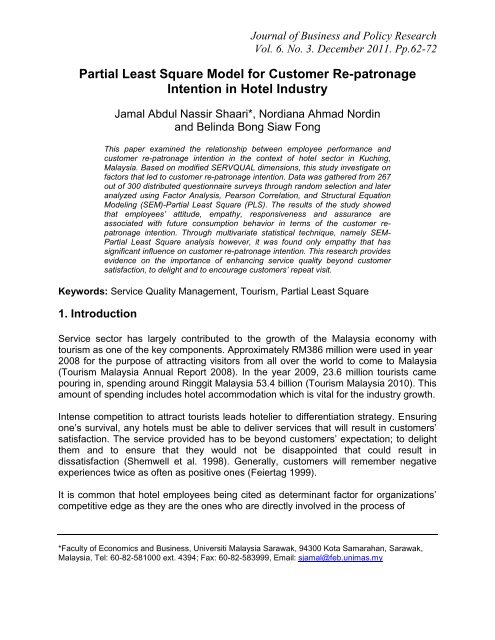
Journal of Business and Policy <strong>Re</strong>searchVol. 6. No. 3. December 2011. Pp.62-72<strong>Partial</strong> <strong>Least</strong> <strong>Square</strong> <strong>Model</strong> <strong>for</strong> <strong>Customer</strong> <strong>Re</strong>-patronageIntention in Hotel IndustryJamal Abdul Nassir Shaari*, Nordiana Ahmad Nordinand Belinda Bong Siaw FongThis paper examined the relationship between employee per<strong>for</strong>mance andcustomer re-patronage intention in the context of hotel sector in Kuching,Malaysia. Based on modified SERVQUAL dimensions, this study investigate onfactors that led to customer re-patronage intention. Data was gathered from 267out of 300 distributed questionnaire surveys through random selection and lateranalyzed using Factor Analysis, Pearson Correlation, and Structural Equation<strong>Model</strong>ing (SEM)-<strong>Partial</strong> <strong>Least</strong> <strong>Square</strong> (PLS). The results of the study showedthat employees’ attitude, empathy, responsiveness and assurance areassociated with future consumption behavior in terms of the customer repatronageintention. Through multivariate statistical technique, namely SEM-<strong>Partial</strong> <strong>Least</strong> <strong>Square</strong> analysis however, it was found only empathy that hassignificant influence on customer re-patronage intention. This research providesevidence on the importance of enhancing service quality beyond customersatisfaction, to delight and to encourage customers’ repeat visit.Keywords: Service Quality Management, Tourism, <strong>Partial</strong> <strong>Least</strong> <strong>Square</strong>1. IntroductionService sector has largely contributed to the growth of the Malaysia economy withtourism as one of the key components. Approximately RM386 million were used in year2008 <strong>for</strong> the purpose of attracting visitors from all over the world to come to Malaysia(Tourism Malaysia Annual <strong>Re</strong>port 2008). In the year 2009, 23.6 million tourists camepouring in, spending around Ringgit Malaysia 53.4 billion (Tourism Malaysia 2010). Thisamount of spending includes hotel accommodation which is vital <strong>for</strong> the industry growth.Intense competition to attract tourists leads hotelier to differentiation strategy. Ensuringone’s survival, any hotels must be able to deliver services that will result in customers’satisfaction. The service provided has to be beyond customers’ expectation; to delightthem and to ensure that they would not be disappointed that could result indissatisfaction (Shemwell et al. 1998). Generally, customers will remember negativeexperiences twice as often as positive ones (Feiertag 1999).It is common that hotel employees being cited as determinant factor <strong>for</strong> <strong>org</strong>anizations’competitive edge as they are the ones who are directly involved in the process of*Faculty of Economics and Business, Universiti Malaysia Sarawak, 94300 Kota Samarahan, Sarawak,Malaysia, Tel: 60-82-581000 ext. 4394; Fax: 60-82-583999, Email: sjamal@feb.unimas.my
Shaari, Nordin & Fongservice encounter with customers; hence, influencing customers’ satisfaction be itpositively or negatively. As the quality of services that customers encounter might bedifferent each time they visit a particular hotel, their level of satisfaction could also beaffected that eventually would influence their re-patronage intentions.This research focused on assessment of guest’s satisfaction towards hotel personnelservice quality and its effect on customer re-patronage intention in the hotel industry.Following this introduction, the paper discusses on related literature, suitablemethodology, findings and discussion of the study, and it wraps up with the implicationand conclusion of the study.2. Literature <strong>Re</strong>view2.1 Service Quality, Employee Per<strong>for</strong>mance, <strong>Customer</strong> SatisfactionAt the peak of rivalry, quality is seen as a useful tool in improving productivity in the<strong>org</strong>anization and become the key strategy to achieve and maintain competitiveadvantage. Harris (2000) stated that one of the most effective and cheapest ways tomarket a business is through providing excellent customer service. The key tooutstanding service delivery lies in the interaction between service employees andcustomer, commonly referred as service encounter. It is a critical part of the servicedelivery process because it greatly impact customers’ evaluations of whole serviceexperience (Soloman et al. 1985).Many services <strong>org</strong>anizations, particularly in this case of hotels require personalinteractions between customers and employees. These interactions would stronglyinfluence the customers’ perception of service quality (Rust, Zahorik & Keiningham1996) as it serves as signs of quality and value to customers. Service quality is a centralissue in services marketing and has been discussed in a number of writings (e.g. Lewis& Booms 1983; Gro¨nroos 1984) even be<strong>for</strong>e the well-known SERVQUAL research byParasuraman et al. (1985). Gro¨nroos (1984) postulated two types of service quality:technical quality (i.e. what the customers actually received from the service), andfunctional quality (i.e. the manner in which the service is delivered). Later he proposedthat service quality can be described in terms of professionalism and skills, attitudesand behaviour, accessibility and flexibility, reliability and trustworthiness, servicerecovery, servicescape, reputation and credibility (Gro¨nroos 2000).Employee per<strong>for</strong>mance is an element of functional quality on how the service isdelivered. Poor employee per<strong>for</strong>mance will lead to customer dissatisfaction andbehavior such as customer complaints and likelihood to switch to other service provider(Kozark & Rimmington 2000). On the other hand, when employee gives commendableper<strong>for</strong>mance such as serving with a smile, it helps to improve the perceived servicequality, customer satisfaction and thus increase the intention to re-patronage in thefuture.63
2.2 <strong>Customer</strong> <strong>Re</strong>-Patronage IntentionShaari, Nordin & Fong<strong>Customer</strong> re-patronage intention is conceptualized as customer likelihood to revisitservice provider (Hellier et al. 2003). In the post-purchase phase, consumer evaluatesservices and decides whether he/she will develop ongoing relationships with the serviceprovider. There are overwhelming arguments that it is more expensive to win newcustomers than to keep existing ones (Ennew & Binks 1996; Hormozi & Giles 2004).This is in line with Athanassopoulos, Gounaris & Stathakopoulos’s (2001) argument thatcustomer replacement costs such as advertising, promotion and sales expenses arehigh and it takes time <strong>for</strong> company with new customers to become profitable.Furthermore, the increase of retention rate could also imply greater positive word ofmouth (Appiah-Adu 1999), decrease price sensitivity and future transaction costs(<strong>Re</strong>ichheld & Sasser 1990) which would lead to better business per<strong>for</strong>mance (Fornell1992; Bolton 1998).2.3 Effect of Service Quality on <strong>Re</strong>-patronage IntentionStudies and theoretical evidences in literatures suggest that there is direct link betweenservice quality and behavioral intentions (Bitner 1990; Bolton & Drew 1991). Among thevarious behavioral intentions, considerable emphasis has been placed on the impact ofservice quality in determining repeat purchase and customer loyalty (Jones & Farquhar2003). As pointed out by Bolton (1998), service quality influences a customer’ssubsequent behavior, intentions and preferences. When a customer chooses a providerthat provides service quality that meets or exceeds his or her expectations, thecustomer is more likely to choose the same provider again. Other studies whichsupport that repurchase intentions are positively influenced by service quality includeZeithaml, Berry &Parasuraman (1996); Cronin & Taylor (1992, 1994); Cronin, Brady &Hult (2000) and Choi et al. (2004).3. MethodologyA set of self-administrated questionnaire in English with Malay translation wasdeveloped. The questionnaire comprised of three sections. The first section gatheredrespondents’ demographic data, the second on items respective to measure employeeper<strong>for</strong>mance and attitude, and the third on customer re-patronage intention with a fivepointLikert scale ranging from 1 (strongly disagree) to 5 (strongly agree) utilized. 300questionnaires were distributed to respondents who have stayed in three star and fourstar hotels in Kuching, Sarawak. This meets the ratio of observations to independentvariables of minimum 5:1 by Hair et al. (2006) that also fit with Sekaran (2007) thatstates 30 to 500 samples should be sufficient <strong>for</strong> most studies. 267 questionnaires werecollected and found usable, giving a quite good response rate of 89 percent.64
Shaari, Nordin & FongTable 1: Definition of IVs<strong>Re</strong>liability: The ability to per<strong>for</strong>m the promised service dependably and accurately. Neveroverpromise and always keep your promises.<strong>Re</strong>sponsiveness: The willingness to help customers and provide prompt service. Always getthe definition of prompt from the customer.Assurance: The knowledge and courtesy of employees and their ability to inspire trust andconfidence. Employees need to be empowered to carry out this assurance of both power andknowledge.Empathy: The degree of caring, individualized attention the firm provides its customers.Attitude: Employees are happy, eager, willing to help, be positive and prepared to meet guest’sneeds to the list.The measurement of employees’ per<strong>for</strong>mance employed <strong>for</strong> this research is based onthe SERQUAL scale developed by Parasuraman et al. (1988) as it is found to berelatively simple yet powerful in providing valuable in<strong>for</strong>mation and valid measurementon <strong>org</strong>anization’s service quality. SERQUAL model has five distinct dimensions thatcomprise 22 items which are assurance, empathy, reliability, responsiveness andtangibles. However, the questionnaire was also modified to suit the needs of research inthe hotel industry. The Tangibility dimension was opted out as the main focus of theresearch is on measuring quality of service delivery by hotel personnel. On the otherhand, another dimension named attitude that include the way employee talks andinteracts with hotel guest is added (Yun 2001). Table 1 gives definitions of theindependent variables; while Table 2 depicts the sources of the variables used in thestudy.Table 2: Sources Used <strong>for</strong> QuestionnaireSection Variables SourcesA Demographics -BCEmployeesPer<strong>for</strong>manceAttitude Yun, S. (2001)AssuranceEmpathy<strong>Re</strong>liability<strong>Re</strong>sponsiveness<strong>Customer</strong> <strong>Re</strong>-patronage IntentionSERVQUAL model by Parasuraman et al.(1988)Lee, H., Lee, Y., & Yoo, D. (2000)4. FindingsOut of the 300 questionnaires which were distributed to guests of three and four starratedhotels in Kuching, a total of 267 (89%) were collected. It was found out that 40.1percent respondents were male and 59.9 percent were female with a fair distribution ofage range between 21-30 (39%), 31-40 (35.6%), 41-50 (16.5%) and 51-60 (9%). 71.1%of the respondents have at least secondary school education. As <strong>for</strong> respondentsoccupation, they range from student (14.2%), government servant (51.3%), privateworker (18.4%), self-employed (13.1%), and pensioner (2.2%). Table 3 summarizes thedemography of the respondents.65
Shaari, Nordin & FongTable 3: <strong>Re</strong>spondent ProfileVariables Frequency %GenderMale 107 40.1Female 160 59.921-30 104 39.0Age31-40 95 35.641-50 44 16.551-60 24 9.0Primary school 2 0.7LCE / SPR / PMR 8 3.0Education MCE / SPM / SPMV 61 22.8level STPM / Diploma 118 44.2Bachelor Degree or higher 75 28.1Others 3 1.1< RM2,001 111 41.6RM2,001 – RM4,000 130 48.7Income level RM4,001 – RM6,000 22 8.2RM6,001 – RM8,000 3 1.1RM8,001 – RM10,000 1 0.4Student 38 14.2Government servant 137 51.3OccupationSelf-employed 35 13.1Private worker 49 18.4Pensioner 6 2.2Others 2 0.7Factor analysis was carried out on the variables that describe employees’ per<strong>for</strong>mance.As shown in Table 4, Attitude component plays important role in overall hotelemployee’s per<strong>for</strong>mance, explaining 34 percent of the variance. This componentincludes ‘hotel employees serve me with a smile’, ‘hotel employees always willing tohelp me’, ‘hotel employees always give me a positive answer’, ‘hotel employees talk tome in a pleasant way’, ‘hotel employees show a sincere interest in solving my problems’and ‘hotel employees per<strong>for</strong>m the service right the first time’. The reliability <strong>for</strong> thiscomponent is 0.862.66
Shaari, Nordin & FongTable 4: Rotated Component Matrix on Employees’ Per<strong>for</strong>manceVariablesAttitudeHotel employees serve me with a smile. 0.819Hotel employees always willing to help me. 0.794Hotel employees always give me a positive answer. 0.735Hotel employees talk to me in a pleasant way. 0.734Hotel employees show a sincere interest in solving myproblems.0.720Hotel employees per<strong>for</strong>m the service right the first time. 0.575EmpathyHotel employees understand my specific needs. 0.813Hotel employees willing to handle special request. 0.755Hotel employees give me individual attention. 0.721Hotel employees have my best interest at heart. 0.657Hotel employees can answer my questions completely. 0.616<strong>Re</strong>sponsivenessHotel employees give me prompt service. 0.806Hotel employees tell me exactly when they will help me. 0.741Hotel employees are dependable in handling problems. 0.684Hotel employees always respond to my request. 0.621Hotel employees provide its service at the time itpromises to do so.0.530AssuranceHotel employees consistently courteous with me. 0.711Hotel employees correct mistakes quickly. 0.687The behaviour of hotel employees instills confidence inme.Hotel employees have the knowledge to answer myquestions.0.6850.557Eigen value 6.801 2.341 1.833 1.153% of variance 34.006 11.704 9.164 5.763Cumulative % of Variance 34.006 45.711 54.875 65.029<strong>Re</strong>liability 0.862 0.806 0.816 0.757Extraction Method: Principal Component Analysis. Rotation Method: Varimax with Kaiser Normalization.a. Rotation converged in 6 iterations.Table 5: Correlation between Employee Per<strong>for</strong>mance and <strong>Customer</strong> <strong>Re</strong>-PatronageIndependent Variable<strong>Re</strong>-patronageAttitude .345 **Empathy .455 **<strong>Re</strong>sponsiveness .329 **Assurance .347 ****. Correlation is significant at the 0.01 level (2-tailed).Table 5 depicts Pearson Correlation findings that were used to test the associationbetween hotel employee’s per<strong>for</strong>mance (attitude, empathy, responsiveness,assurance), and customer re-patronage intention. The result shows a significant positiverelationship exists among attitude, empathy, responsiveness, assurance and customer67
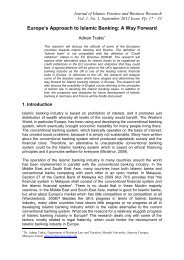
Shaari, Nordin & Fongre-patronage intention. Empathy has a moderate relationship with re-patronage (r =0.455, p < 0.01) while Assurance (r = 0.347, p < 0.01), Attitude (r = 0.345, p < 0.01) and<strong>Re</strong>sponsiveness (r = 0.329, p < 0.01) have a slight most negligible relationship with repatronageintention.4.1 HypothesesFrom the correlation results, the authors hypothesized that:H1: There is positive influence of Attitude on guest <strong>Re</strong>-patronage intention.H2: There is positive influence of Empathy on guest <strong>Re</strong>-patronage intention.H3: There is positive influence of <strong>Re</strong>sponsiveness on guest <strong>Re</strong>-patronageintention.H4: There is positive influence of Assurance on guest <strong>Re</strong>-patronage intention.4.2 <strong>Partial</strong> <strong>Least</strong> <strong>Square</strong>s Analyses<strong>Partial</strong> <strong>Least</strong> <strong>Square</strong> is considered to be a better alternative to multiple linearregressions with cited advantages such as stronger predictions; able to model multipledependent as well as multiple independence variables, can handle multicollinearity inIVs; robust despite data noise and missing data; and could be applied to small sample(Falk & Miller 1992; Geladi & Kowalski 1986; D. Pirouz 2006). Figure 1 depicts theproposed structural model.Figure 1: PLS Structural <strong>Model</strong>68
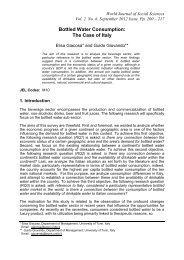
Shaari, Nordin & Fong4.3 Evaluation of the Measurement <strong>Model</strong>Table 6: <strong>Model</strong> Construct, Average Extracted Variance, and Cronbach Alpha<strong>Model</strong> ConstructAVEComposite<strong>Re</strong>liabilityR<strong>Square</strong>CronbachsAlphaAssurance 0.577085 0.844834 0.757213Attitude 0.587158 0.89488 0.861756Empathy 0.562951 0.864995 0.806156<strong>Re</strong>sponsiveness 0.575338 0.87081 0.816057<strong>Re</strong>-Patronage 0.801815 0.890006 0.272361 0.752909Table 6 summarize the evaluation <strong>for</strong> PLS measurement model. The convergent validitywas measured by average extracted variance (AVE) where AVE should exceed 0.5(Fornell & Larcker 1981; Bagozzi & Yi 1988); all constructs satisfied this condition. Thecomposite reliabilities ranged from .844 (Assurance) to .894 (Attitude) were above therecommended 0.7 level (Nunnally 1978; Gefen et al. 2000). Cronbach alpha rules statethat the values should be 0.7 or higher to indicate adequate convergence or internalconsistency (Nunnally 1978). Conclusively, the measurement model showed goodreliability and validity.Figure 2: Structural <strong>Model</strong> with R 2 <strong>Re</strong>sultFigure 2 portray the structural model depicting the R 2 result. The t-values weregenerated using the bootstrapping with re-samples of 200 (Chin 1998). Table 7summarizes the hypotheses, path coefficients (β), and t-values.69
Shaari, Nordin & FongH1H2H3H4Table 7: Path Coefficients (β), t -values and Hypotheses<strong>Re</strong>lationship Coefficient t-value SupportedASSURE REPATRONATTITUDE REPATRONEMPATHY REPATRONRESPONS REPATRON0.1190.1810.3330.0330.9301.6903.015**0.236NONOYESNOt-values > 1.96* (p< 0.05); t-values > 2.58** (p< 0.01)5. DiscussionThe main findings of this study suggest that one winning strategy in competition isthrough focusing on employee service per<strong>for</strong>mance. While it could be said that it ispredictable that hotel guest would expect efficient services from hotel employees asembedded in all of the tested dimension of ‘Assurance’, ‘Attitude’, ‘Empathy’ and‘<strong>Re</strong>sponsiveness’; the effective ways to promote their intention to revisit the hotel goesbeyond that. Employees’ ‘Empathy’ was found to be what matter the most to hotelguests. Through empathy dimension focusing on individual attention, understandingspecific needs, and special request, these extra qualities are what needed to wincustomers’ heart, encouraging the potential revisits. These characteristics indicate thesignificant of interactive qualities between service provider and the customer in theservice encounter. According to Svensson (2001), the importance of service quality is inthe phenomenon that contributes to the strength of interpersonal service encounters.6. Implication and ConclusionConclusively, this study contributes to knowledge on service per<strong>for</strong>mance and servicequality. The implication and recommendation of the study is <strong>for</strong> hotel management to goextra miles in ensuring that employees are focusing not only on the efficiency of theservices, but also on the effectiveness; on what makes the guest really happy!Enhanced service quality would lead to customer satisfaction, thus increase thepotential <strong>for</strong> customer re-patronage intention. Service <strong>org</strong>anizations need to focus moreon employees, particularly those at the frontline who see and have frequent interactionwith customers. It is imperative that these employees are trained to be more caring andsensitive to customer needs.AcknowledgementThis research was supported by Universiti Malaysia Sarawak (UNIMAS) through DanaPenyelidikan Khas UNIMAS grant No DPK/20/2010 to Dr Jamal Abdul Nassir binShaari.70
Shaari, Nordin & Fong<strong>Re</strong>ferencesAppiah-Adu, K 1999, ‘Marketing effectiveness and customer retention in the servicesector’, The Service Industries Journal, vol. 19, no. 3, pp. 26-41.Athanassopoulos, A, Gounaris, S & Stathakopoulos, V 2001, ‘Behavioral <strong>Re</strong>sponses to<strong>Customer</strong> Satisfaction: An Empirical Study’, European Journal of Marketing, vol.35 no. 6, pp. 687-707.Bagozzi, RP, Yi, Y, & Philipps, LW 1991, ‘Assessing construct validity in <strong>org</strong>anizationalresearch’, Administrative Science Quarterly, vol. 36, pp. 421–458.Bitner, MJ 1990, ‘Evaluating Service Encounters: The Effects of Physical Surroundingsand Employee <strong>Re</strong>sponses’, Journal of Marketing, vol. 54, no. 2, pp. 69–82.Bolton, RN 1998, ‘A Dynamic <strong>Model</strong> of the Duration of the <strong>Customer</strong>’s <strong>Re</strong>lationship withA Continuous Service Provider’, Marketing Science, vol. 17, no. 1, pp. 45–66.Chin, WW 1998b, ‘Issues and opinion on structural equation modeling’, MIS Quarterly,vol. 22, no. 1, pp. 7-16.Choi, KS, Cho, WH, Lee, SH, Lee, HJ, & Kim, CK 2004, ‘The <strong>Re</strong>lationships AmongQuality, Value, Satisfaction And Behavioral Intention In Health Care ProviderChoice: A South Korean Study’, Journal of Business <strong>Re</strong>search, vol. 57, no. 8, pp.913–921.Cronin, JJ, Brady, MK & Hult, G 2000, ‘Assessing the Effects of Quality, Value, and<strong>Customer</strong> Satisfaction on Consumer Behavioral Intentions in ServiceEnvironments’, Journal of <strong>Re</strong>tailing, vol. 76, no. 2, pp. 193–218.Cronin, JJ & Taylor, SA 1992, ‘Measuring service quality: a reexamination andextension’, Journal of Marketing, vol. 56, no. 3, pp. 55–68.D. Pirouz, M 2006, An Overview of <strong>Partial</strong> <strong>Least</strong> <strong>Square</strong>s, The Paul Merage School ofBusiness University of Cali<strong>for</strong>nia, IrvineEnnew, CT & Binks, MR 1996, ‘The Impact of Service Quality and ServiceCharacteristics On <strong>Customer</strong> <strong>Re</strong>tention: Small Businesses and Their Banks in theUK’, British Journal of Management, vol. 7, no. 1, pp. 219-230.Falk, RF & Nancy BM 1992, A Primer <strong>for</strong> Soft <strong>Model</strong>ing. Akron: University of Akron.Feiertag, H 1999, ‘Poor customer service will ruin your sales ef<strong>for</strong>t’, Hotel and MotelManagement, vol. 214, no. 11, pp. 26.Fornell, C 1992, ‘A national customer satisfaction barometer: the Swedish experience’,Journal of Marketing, vol. 56, no. 1, pp. 6–21.Fornell, C, & Larcker, DF 1981, ‘Evaluating Structural Equation <strong>Model</strong>s WithUnobservable Variables And Measurement Error’, Journal of Marketing <strong>Re</strong>search,vol. 18, no. 1, pp. 39-50.Geladi, P & Kowalski, BR 1986, ‘<strong>Partial</strong> <strong>Least</strong> <strong>Square</strong>s <strong>Re</strong>gression: A Tutorial’,Analytica Chimica Acta, vol. 185, pp. 1-17.Gro¨nroos, C 1984, ‘A service quality model and its marketing implications’, EuropeanJournal of Marketing, vol. 18, no. 4, pp. 36-44.Gro¨nroos, C 2000, Service Management and Marketing: A <strong>Customer</strong> <strong>Re</strong>lationshipManagement Approach, Wiley, New York, NYHair, JF, Black, WC, Babin, BJ, Anderson, RE, & Tatham, RL 2006, Multivariate DataAnalysis 6 th edn, Upper Saddle River, New Jersey: Pearson Prentice Hall.71
Shaari, Nordin & FongHaneb<strong>org</strong>, LC. 1998, ‘Ten Steps to Quality Service’, Franchising World, vol. 30, no. 5,pp 19-20.Hellier, PK, Geursen, GM, Carr, RA & Rickard, J. A. 2003, ‘<strong>Customer</strong> <strong>Re</strong>purchaseIntention: A General Structural Equation <strong>Model</strong>’, European Journal of Marketing,vol. 37, no. 11/12, pp. 1762–1800.Hormozi, AM & Giles, S 2004, ‘Data Mining: A Competitive Weapon <strong>for</strong> Banking and<strong>Re</strong>tail Industries’, In<strong>for</strong>mation System ManagementJones, H & Farquhar, JD 2003, ‘Contact management and customer loyalty’, Journal ofFinancial Services Marketing, vol. 8, no. 1, pp.71–78.Kaplan, RS & Norton, DP 2001, ‘The Strategy-Focused Organization: How BalancedScorecard Companies Thrive In The New Business Environment’, HarvardBusiness School Press.Kozark, M & Rimmigton, M 2000, ‘Tourists Satisfaction with Mallorca, Spain As An Off-Season Holiday Destination’, Journal of Traveler <strong>Re</strong>search, vol. 38, pp. 260-269.Lovelock, CH, Patterson, PG & Walker, RH 2001, Services Marketing: An Asia-PacificPerspective, 2nd Ed. Australia: Prentice Hall.Nunnally, JC 1978, Psychometric theory, New York: McGraw-Hill.Parasuraman, A, Zeithaml, V & Berry, L 1985, ‘A Conceptual <strong>Model</strong> of Service Qualityand Its Implication <strong>for</strong> Future <strong>Re</strong>search’, Journal of Marketing, vol. 49, pp. 41–50.Parasuraman, A, Zeithaml, V, & Berry, LL 1988, ‘SERVQUAL: A multiple item scale <strong>for</strong>measuring customer perceptions of service quality’, Journal of <strong>Re</strong>tailing, vol. 64.Qualls, WJ 1993, Industrial Buyer Satisfaction: Linking <strong>Customer</strong> Perceptions of Qualityto <strong>Re</strong>peat Purchase Behaviour, MIT-Sloan School of Management, Boston, MA,Working Paper.<strong>Re</strong>ichheld, FF & Sasser, WE 1990, ‘Zero Defections: Quality Comes to Services’,Harvard Business <strong>Re</strong>view, vol. 68, no. 5, pp.105–112.Rust, RT, Zahorik, AJ & Keiningham, LT 1996, Service marketing, New York:HarperCollins College PublishersShemwell, DY, Yavas, U & Bilgin, Z 1998, ‘<strong>Customer</strong>-Service Provider <strong>Re</strong>lationship: AnEmpirical Test of A <strong>Model</strong> of Service Quality, Satisfaction and <strong>Re</strong>lationship-Oriented Outcome’, International Journal of Service Industry Management, vol. 9,pp. 155-168.Svensson, G 2001, ‘The direction of change in multi-item measures of service quality’,Managing Service Quality, vol. 11, no. 4, pp. 262-71.Tornow, W & Wiley, J 1991, ‘Service Quality and Management Practices: A Look atEmployee Attitudes, <strong>Customer</strong> Satisfaction, And Bottom-Line Consequences’,Human <strong>Re</strong>source Planning, vol. 14, no. 2, pp. 105-15.Tourism Malaysia Annual <strong>Re</strong>port 2008, Annual <strong>Re</strong>port 08, viewed Sept 20, 2010,Tourism Malaysia 2010, Facts & Figures: Tourist Arrivals and <strong>Re</strong>ceipts to Malaysia,viewed Sept 20, 2010,Yun, S 2001, ‘Assessment of guest satisfaction of service quality of the hotel’, UnpublishedMaster <strong>Re</strong>search, University of Wisconsin-Stout, Menomonie, WI72