Modelling and analysis of T-cell epitope screening data.
Modelling and analysis of T-cell epitope screening data.
Modelling and analysis of T-cell epitope screening data.

Create successful ePaper yourself
Turn your PDF publications into a flip-book with our unique Google optimized e-Paper software.
<strong>Modelling</strong> <strong>and</strong> <strong>analysis</strong> <strong>of</strong> T-<strong>cell</strong> <strong>epitope</strong><br />
<strong>screening</strong> <strong>data</strong>.<br />
Tim Beißbarth 2 , Jason A. Tye-Din 1 , Gordon K. Smyth 1 ,<br />
Robert P. Anderson 1 <strong>and</strong> Terence P. Speed 1<br />
1 WEHI, 1G Royal Parade, Parkville, VIC 3050, Australia<br />
2 Deutsches Krebsforschungszentrum, Im Neuenheimer Feld 580, 69120 Heidel-<br />
berg, Germany<br />
Abstract: Proposed for Oral Presentation by Tim Beissbarth.<br />
The human immune system is designed to recognize, eradicate <strong>and</strong> “remember”<br />
invading pathogens. T-<strong>cell</strong>s play a critical role in sensing <strong>and</strong> triggering immune<br />
responses. Every individual has a pool <strong>of</strong> T-<strong>cell</strong>s, each with a distinct T-<strong>cell</strong><br />
receptor (TCR) relatively specific for certain 9-aminoacid sequences bound to<br />
specialized <strong>cell</strong> surface proteins, MHC Class I for viral <strong>and</strong> intra-<strong>cell</strong>ular proteins<br />
or MHC Class II on specialized antigen-presenting <strong>cell</strong>s (APC) for extra-<strong>cell</strong>ular<br />
proteins. An important challenge <strong>of</strong> human immunology is the identification <strong>of</strong><br />
peptides (<strong>epitope</strong>s) that activate T-<strong>cell</strong>s causing protective or destructive immune<br />
responses that could be used to develop protective vaccines or to induce tolerance<br />
to antigens causing inappropriate immune responses e.g. autoimmune diseases.<br />
The simplest <strong>and</strong> earliest approach was to incubate peripheral blood T-<strong>cell</strong>s with<br />
20mer peptides overlapping by 10–12 aminoacids spanning a protein <strong>of</strong> interest,<br />
<strong>and</strong> measure proliferation <strong>of</strong> T-<strong>cell</strong>s. We sought to take advantage <strong>of</strong> the falling<br />
cost <strong>of</strong> synthetic, <strong>screening</strong> grade peptides, <strong>and</strong> devise a comprehensive, nonhypothesis-driven<br />
screen for T-<strong>cell</strong> <strong>epitope</strong>s for a family <strong>of</strong> proteins. The use <strong>of</strong><br />
the ELISPOT reader to count spots in 96 well plates has been essential to provide<br />
high-throughput, reproducible <strong>data</strong>, <strong>and</strong> has facilitated increasingly large scale<br />
testing <strong>of</strong> T-<strong>cell</strong> <strong>epitope</strong>s.<br />
We were interested in the study <strong>of</strong> coeliac disease (CD). CD is a T-<strong>cell</strong> mediated<br />
allergy caused by gluten proteins from wheat, rye <strong>and</strong> barley in many foods. CD<br />
affects 1% <strong>of</strong> western populations <strong>and</strong> is over 90% associated with a specific MHC<br />
Class II molecule, HLA-DQ2. We have developed a method to comprehensively<br />
screen for T-<strong>cell</strong> <strong>epitope</strong>s implicated with CD. We have synthesized <strong>and</strong> tested<br />
unique 20mer peptides that incorporate all possible <strong>epitope</strong>s within glutens. T<strong>cell</strong><br />
assays were performed in 96 well plates using the ELISPOT assay to screen<br />
for responses in CD patients. To our knowledge, no statistical method to analyse<br />
such <strong>data</strong> has been proposed so far. We describe a statistical model to fit the <strong>data</strong><br />
<strong>and</strong> an EM (Expectation Maximization) algorithm to estimate the parameters <strong>of</strong><br />
interest <strong>and</strong> analyse the resulting <strong>data</strong>.<br />
Keywords: Biostatistics; Immunoinformatics; Biological <strong>data</strong> modelling; T-<strong>cell</strong><br />
assays; Coeliac disease.
2 <strong>Modelling</strong> T-<strong>cell</strong> assay <strong>data</strong>.<br />
1 Data<br />
We have generated <strong>data</strong> to study the T-<strong>cell</strong> <strong>epitope</strong>s responsible for CD.<br />
T-<strong>cell</strong> assays are used to measure how many T-<strong>cell</strong>s react against a certain<br />
peptide <strong>epitope</strong>. Blood is taken from a patient, <strong>and</strong> the peripheral blood<br />
mononuclear <strong>cell</strong>s are isolated from the whole blood. 200,000–1,000,000<br />
blood <strong>cell</strong>s are then incubated with the peptide <strong>epitope</strong> that is to be tested.<br />
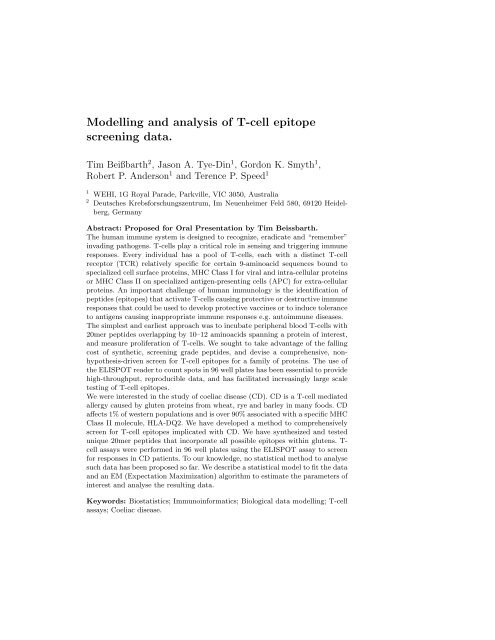
Figure 1 illustrates the process. The assay is carried out in a 96 well plate<br />
format <strong>and</strong> the resulting spots, which indicate the responding T-<strong>cell</strong>s, are<br />
photographed <strong>and</strong> counted using an ELISPOT reader.<br />
Here we use this assay to determine against which parts <strong>of</strong> the gluten proteins<br />
in wheat, rye, barley or oats people having CD react, i.e. which peptides<br />
<strong>of</strong> these proteins are T-<strong>cell</strong> stimulating <strong>epitope</strong>s. CD patients agreed<br />
to follow a gluten free diet for 3 months, <strong>and</strong> then ate defined amounts <strong>of</strong><br />
wheat, rye or barley for three days, before the test. After the gluten challenge<br />
blood was taken from the patient <strong>and</strong> used to perform between 500<br />
<strong>and</strong> 2,000 T-<strong>cell</strong> assays with different peptides. We screened every unique<br />
20mer peptide occurring within all families <strong>of</strong> gluten proteins.<br />
The following steps were performed: 1) Select families <strong>of</strong> gluten proteins<br />
from GENBANK. 2) Select 20mer peptides to screen for <strong>epitope</strong>s. 3) Synthesize<br />
<strong>screening</strong> grade peptides for all selected 20mers. 4) Recruit CD<br />
patients <strong>and</strong> perform gluten challenge. 5) Perform ELISPOT T-<strong>cell</strong> assays<br />
using the blood from CD patients <strong>and</strong> the synthesized peptides in 96 well<br />
plates. 6) Analyse <strong>data</strong> from T-<strong>cell</strong> assays. 7) Based on previously found<br />
positive 20mer peptides design shorter peptides <strong>and</strong> use them for further<br />
tests. Here, we focus on the statistical modelling <strong>and</strong> <strong>analysis</strong> <strong>of</strong> the <strong>data</strong>.<br />
a) Illustration <strong>of</strong> T−<strong>cell</strong> assay<br />
1. imobilize Antibody<br />
2. wash<br />
3. incubate blocking solution<br />
Peptide<br />
4. wash<br />
APC<br />
5. add Peptide<br />
6. add Cells<br />
MHCII<br />
T−Rez.<br />
T−Cell<br />
7. incubate 16 h 37C<br />
8. wash<br />
gamma−interferon<br />
9. develop<br />
10. count spots<br />
b) Assays are performed in 96 well plates<br />
Patient: i = 1 ... 29<br />
Peptide: j = 1 ... 652 = m x k x l<br />
Plate: m = 1 ... 7<br />
k = 1 ... 8<br />
l = 1 ... 12<br />
Observed count: y = 0 ... 300<br />
FIGURE 1. a) Schematic representation <strong>of</strong> the T-<strong>cell</strong> assay. Blood <strong>cell</strong>s <strong>of</strong> a<br />
patient are incubated with a peptide <strong>and</strong> the number <strong>of</strong> responding T-<strong>cell</strong>s is<br />
measured by a spot count. b) T-<strong>cell</strong> assays are performed in 96 well plate format<br />
<strong>and</strong> spots are counted using an ELISPOT reader.
2 Statistical <strong>Modelling</strong><br />
Beissbarth et al. 3<br />
The <strong>data</strong> generated as a result <strong>of</strong> T-<strong>cell</strong> <strong>epitope</strong> <strong>screening</strong> are counts <strong>of</strong><br />
spots, representing the number <strong>of</strong> T-<strong>cell</strong>s <strong>of</strong> a certain patient responding to<br />
a given peptide. Ideally we want to find out: how many people respond to<br />
each peptide <strong>and</strong> what is the expected response rate (i.e. count <strong>of</strong> spots)<br />
for the patients who do respond to this peptide. We also have to include<br />
some normalization between patients, as we observe that different patients<br />
respond with quite different overall response rates.<br />
We model this as an incomplete <strong>data</strong> problem. Our observed <strong>data</strong> yij are<br />
the counts <strong>of</strong> spots for the different patients i <strong>and</strong> peptides j, which we<br />
get from the ELISPOT reader as a result <strong>of</strong> our T-<strong>cell</strong> assays. Whether a<br />
patient responds or not is unknown at this stage. We assume a response<br />
indicator zij that is either 1, indicating that patient i responds to peptide<br />
j, or 0. We model the observed <strong>data</strong> using independent Poisson distributions:<br />
yij ∼ Poisson(αiλj), if patient i is responding to peptide j, or<br />
yij ∼ Poisson(αiλ0), if the patient is not responding. The complete <strong>data</strong><br />
log likelihood is thus:<br />
log Lc(α, λ, λ0) = �<br />
{zij log pj + (1 − zij) log(1 − pj) + yij log λij − λij)}<br />
ij<br />
with λij = zijαiλj + (1 − zij)αiλ0<br />
<strong>and</strong> parameters: αi, a factor indicating the overall responsiveness <strong>of</strong> patient<br />
i; pj, the proportion <strong>of</strong> people that respond to peptide j; λj, the rate<br />
<strong>of</strong> response for patients responding to peptide j; λ0, the rate <strong>of</strong> response<br />
for patients not responding.<br />
We estimate the parameters <strong>and</strong> unobserved values using an Expectation<br />
Maximization (EM) algorithm. The EM algorithm cycles between assuming<br />
current parameters <strong>and</strong> computing expected values ˆzij, <strong>and</strong> maximizing<br />
the complete <strong>data</strong> log likelihood using the expected values ˆzij <strong>and</strong> recomputing<br />
new parameters. The algorithm starts with initial guesses for the<br />
parameters <strong>and</strong> cycles until convergence. Given a set <strong>of</strong> parameters, we can<br />
then estimate expected values for zij:<br />
ˆzij = pr(zij = 1|yij) = pr(zij = 1)pr(yij|zij = 1)<br />
pr(yij)<br />
=<br />
pje−αiλj (αiλj) yij<br />
pje−αiλj (αiλj) yij + (1 − pj)e−αiλ0(αiλ0) yij<br />
When maximizing the likelihood we observe two problems. First, because<br />
αi appears in both the background distribution as well as in the response<br />
distribution, αs <strong>and</strong> λs cannot be estimated independently. To fix this we<br />
adjust the αs after each iteration to have a mean <strong>of</strong> 1. Second, we need to<br />
put in the constraint that λj ≥ λ0.
4 <strong>Modelling</strong> T-<strong>cell</strong> assay <strong>data</strong>.<br />
3 Results <strong>and</strong> Discussion<br />
We have applied <strong>and</strong> tested these methods in a comprehensive study to<br />
determine the T-<strong>cell</strong> <strong>epitope</strong>s involved in coeliac disease. Patients with CD<br />
react against proteins in wheat, rye, barley or oats.<br />
To test how well our Poisson assumption fits the <strong>data</strong> <strong>and</strong> how well we<br />
fit the parameters, we have designed several control experiments. Among<br />
them we have included repeated measurements for several peptides. We<br />
observe that our model <strong>and</strong> estimates fit the <strong>data</strong> well, although some overdispersion<br />
is apparent. Deviance residuals were computed as described in<br />
McCullagh <strong>and</strong> Nelder, 1989. We note that the variance <strong>of</strong> measurements<br />
with very high spot counts is <strong>of</strong>ten higher than the theoretical Poisson variance.<br />
This is not unexpected, as with very high spot counts the ELISPOT<br />
reader is unable to determine the number <strong>of</strong> spots accurately. It is not<br />
overly concerning, though, as for high spot counts the background <strong>and</strong><br />
response distribution are easily distinguished. Also the model should still<br />
work satisfactorily, even if the variances are a multiple <strong>of</strong> the estimated<br />
Poisson variances.<br />
The estimated response indicator zij distinguishes between measurements<br />
that seem to follow background rate <strong>and</strong> those which are true responses,<br />
the estimated value <strong>of</strong> zij is usually 1.0 or very close for responses. It gets<br />
more difficult to decide for weak responders, especially when there are no<br />
observed responses for a peptide, i.e. λj = λ0 in these cases the estimated<br />
zij is usually between 0.2 <strong>and</strong> 0.5.<br />
We used the estimated response rate λj <strong>and</strong> the estimated number <strong>of</strong> people<br />
responding to select peptides which are to be further tested. The product <strong>of</strong><br />
the estimated response rate <strong>and</strong> proportion <strong>of</strong> responders λjpj also seems<br />
to be a good indicator <strong>of</strong> how potent a peptide can can be as an <strong>epitope</strong>. In<br />
the subsequent <strong>analysis</strong> fine mapping was performed using shorter peptides<br />
that were derived from responsive 20mers.<br />
We have proposed novel methodology to study immune responses, including<br />
a comprehensive screen for T-<strong>cell</strong> <strong>epitope</strong>s <strong>and</strong> subsequent statistical <strong>data</strong><br />
<strong>analysis</strong>. Using our model we were able to distinguish what responses are<br />
likely to be significantly different from background. Furthermore, we were<br />
able to estimate parameters, such as the expected response rate for each<br />
tested peptide <strong>and</strong> the proportion <strong>of</strong> people that show positive responses<br />
to each peptide. This amount <strong>of</strong> peptide- <strong>and</strong> patient-specific <strong>data</strong> has<br />
not been available in previous T-<strong>cell</strong> <strong>epitope</strong> mapping studies <strong>of</strong> human<br />
immune-mediated diseases. We have shown that these methods were useful<br />
in CD research. We believe, however, that similar methodology can be<br />
applied as well in other diseases where fairly large scale ELISPOT studies<br />
have already been performed, e.g. HIV, hepatitis, diabetes, <strong>and</strong> cancer.
References<br />
Beissbarth et al. 5<br />
Anderson R.P., Degano P., Godkin A.J., Jewell D.P., Hill A.V. (2000). In<br />
vivo antigen challenge in celiac disease identifies a single transglutaminasemodified<br />
peptide as the dominant A-gliadin T-<strong>cell</strong> <strong>epitope</strong>.. Nature<br />
Medicine, 6, 337-342.<br />
Anthony D.D., Lehmann P.V. (2000). T-<strong>cell</strong> <strong>epitope</strong> mapping using the<br />
ELISPOT approach. Methods, 29, 260-269.<br />
Dempster A.P., Laird N.M., Rubin, D.B. (1977). Maximum likelihood from<br />
incomplete <strong>data</strong> using the EM-algorithm. Journal <strong>of</strong> the Royal Statistical<br />
Society, 39, 1-38.<br />
McCullagh P., Nelder J.A. (1989). Generalized Linear Models, Second Edition.<br />
Chapman & Hall.<br />
Townsend A.R. (1987). Recognition <strong>of</strong> influenza virus proteins by cytotoxic<br />
T lymphocytes. Immunological Research, 6, 80-100.