rice monitoring in spain by means of time series of terrasar-x dual ...
rice monitoring in spain by means of time series of terrasar-x dual ...
rice monitoring in spain by means of time series of terrasar-x dual ...
Create successful ePaper yourself
Turn your PDF publications into a flip-book with our unique Google optimized e-Paper software.
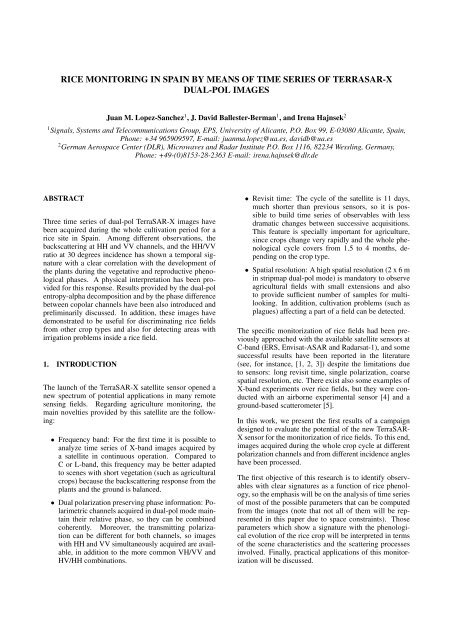
RICE MONITORING IN SPAIN BY MEANS OF TIME SERIES OF TERRASAR-XDUAL-POL IMAGESJuan M. Lopez-Sanchez 1 , J. David Ballester-Berman 1 , and Irena Hajnsek 21 Signals, Systems and Telecommunications Group, EPS, University <strong>of</strong> Alicante, P.O. Box 99, E-03080 Alicante, Spa<strong>in</strong>,Phone: +34 965909597, E-mail: juanma.lopez@ua.es, davidb@ua.es2 German Aerospace Center (DLR), Microwaves and Radar Institute P.O. Box 1116, 82234 Wessl<strong>in</strong>g, Germany,Phone: +49-(0)8153-28-2363 E-mail: irena.hajnsek@dlr.deABSTRACTThree <strong>time</strong> <strong>series</strong> <strong>of</strong> <strong>dual</strong>-pol TerraSAR-X images havebeen acquired dur<strong>in</strong>g the whole cultivation period for a<strong>rice</strong> site <strong>in</strong> Spa<strong>in</strong>. Among different observations, thebackscatter<strong>in</strong>g at HH and VV channels, and the HH/VVratio at 30 degrees <strong>in</strong>cidence has shown a temporal signaturewith a clear correlation with the development <strong>of</strong>the plants dur<strong>in</strong>g the vegetative and reproductive phenologicalphases. A physical <strong>in</strong>terpretation has been providedfor this response. Results provided <strong>by</strong> the <strong>dual</strong>-polentropy-alpha decomposition and <strong>by</strong> the phase differencebetween copolar channels have been also <strong>in</strong>troduced andprelim<strong>in</strong>arily discussed. In addition, these images havedemonstrated to be useful for discrim<strong>in</strong>at<strong>in</strong>g <strong>rice</strong> fieldsfrom other crop types and also for detect<strong>in</strong>g areas withirrigation problems <strong>in</strong>side a <strong>rice</strong> field.1. INTRODUCTIONThe launch <strong>of</strong> the TerraSAR-X satellite sensor opened anew spectrum <strong>of</strong> potential applications <strong>in</strong> many remotesens<strong>in</strong>g fields. Regard<strong>in</strong>g agriculture <strong>monitor<strong>in</strong>g</strong>, thema<strong>in</strong> novelties provided <strong>by</strong> this satellite are the follow<strong>in</strong>g:• Frequency band: For the first <strong>time</strong> it is possible toanalyze <strong>time</strong> <strong>series</strong> <strong>of</strong> X-band images acquired <strong>by</strong>a satellite <strong>in</strong> cont<strong>in</strong>uous operation. Compared toC or L-band, this frequency may be better adaptedto scenes with short vegetation (such as agriculturalcrops) because the backscatter<strong>in</strong>g response from theplants and the ground is balanced.• Dual polarization preserv<strong>in</strong>g phase <strong>in</strong>formation: Polarimetricchannels acquired <strong>in</strong> <strong>dual</strong>-pol mode ma<strong>in</strong>ta<strong>in</strong>their relative phase, so they can be comb<strong>in</strong>edcoherently. Moreover, the transmitt<strong>in</strong>g polarizationcan be different for both channels, so imageswith HH and VV simultaneously acquired are available,<strong>in</strong> addition to the more common VH/VV andHV/HH comb<strong>in</strong>ations.• Revisit <strong>time</strong>: The cycle <strong>of</strong> the satellite is 11 days,much shorter than previous sensors, so it is possibleto build <strong>time</strong> <strong>series</strong> <strong>of</strong> observables with lessdramatic changes between successive acquisitions.This feature is specially important for agriculture,s<strong>in</strong>ce crops change very rapidly and the whole phenologicalcycle covers from 1.5 to 4 months, depend<strong>in</strong>gon the crop type.• Spatial resolution: A high spatial resolution (2 x 6 m<strong>in</strong> stripmap <strong>dual</strong>-pol mode) is mandatory to observeagricultural fields with small extensions and alsoto provide sufficient number <strong>of</strong> samples for multilook<strong>in</strong>g.In addition, cultivation problems (such asplagues) affect<strong>in</strong>g a part <strong>of</strong> a field can be detected.The specific monitorization <strong>of</strong> <strong>rice</strong> fields had been previouslyapproached with the available satellite sensors atC-band (ERS, Envisat-ASAR and Radarsat-1), and somesuccessful results have been reported <strong>in</strong> the literature(see, for <strong>in</strong>stance, [1, 2, 3]) despite the limitations dueto sensors: long revisit <strong>time</strong>, s<strong>in</strong>gle polarization, coarsespatial resolution, etc. There exist also some examples <strong>of</strong>X-band experiments over <strong>rice</strong> fields, but they were conductedwith an airborne experimental sensor [4] and aground-based scatterometer [5].In this work, we present the first results <strong>of</strong> a campaigndesigned to evaluate the potential <strong>of</strong> the new TerraSAR-X sensor for the monitorization <strong>of</strong> <strong>rice</strong> fields. To this end,images acquired dur<strong>in</strong>g the whole crop cycle at differentpolarization channels and from different <strong>in</strong>cidence angleshave been processed.The first objective <strong>of</strong> this research is to identify observableswith clear signatures as a function <strong>of</strong> <strong>rice</strong> phenology,so the emphasis will be on the analysis <strong>of</strong> <strong>time</strong> <strong>series</strong><strong>of</strong> most <strong>of</strong> the possible parameters that can be computedfrom the images (note that not all <strong>of</strong> them will be represented<strong>in</strong> this paper due to space constra<strong>in</strong>ts). Thoseparameters which show a signature with the phenologicalevolution <strong>of</strong> the <strong>rice</strong> crop will be <strong>in</strong>terpreted <strong>in</strong> terms<strong>of</strong> the scene characteristics and the scatter<strong>in</strong>g processes<strong>in</strong>volved. F<strong>in</strong>ally, practical applications <strong>of</strong> this monitorizationwill be discussed.
MAY JUN JUL AUG SEP OCTNOVVH/VV22ºHH/VV 30ºXVH/VV40ºXX X X XSow<strong>in</strong>gHarvestFigure 1. Schedule <strong>of</strong> acquisitions organized as 3 <strong>series</strong><strong>of</strong> images. Black circles denote acquired images, andcrosses denote images which were ordered but not acquireddue to ma<strong>in</strong>tenance operations and collision withorders from another users2. SAR DATA AND GROUND TRUTH CAM-PAIGNThe test site consists <strong>of</strong> an area <strong>of</strong> 30 km x 30 km <strong>in</strong> themouth <strong>of</strong> the Guadalquivir river, SW <strong>of</strong> Spa<strong>in</strong>, where <strong>rice</strong>is cultivated annually from May to October.Dur<strong>in</strong>g the 2008 campaign, the local association <strong>of</strong> <strong>rice</strong>farmers (Federacion de Arroceros de Sevilla) has collectedseveral ground truth parameters on a weekly basis.For this research project, 8 specific parcels, spreadover the whole area, were selected for ground-truth monitorization.The area <strong>of</strong> each parcel is around 8–14 ha.Phenological stage and vegetation height on these parcelshave been annotated dur<strong>in</strong>g the whole period. In addition,specific aspects for some <strong>of</strong> them have been registered,such as irrigation conditions, water sal<strong>in</strong>ity and presence<strong>of</strong> plagues. F<strong>in</strong>ally, there is also climate <strong>in</strong>formation provided<strong>by</strong> the Spanish Agency <strong>of</strong> Meteorology (AEMET),<strong>in</strong>clud<strong>in</strong>g daily files <strong>of</strong> temperature, precipitations, humidityand w<strong>in</strong>d.In order to maximize the <strong>in</strong>vestigation <strong>of</strong> the capabilities<strong>of</strong> the TerraSAR-X sensor, the acquisition <strong>of</strong> imageswas organized as a set <strong>of</strong> three parallel <strong>time</strong> <strong>series</strong>. Each<strong>time</strong> <strong>series</strong>, with an 11-days revisit period, correspondsto <strong>dual</strong>-pol stripmap images obta<strong>in</strong>ed with a different <strong>in</strong>cidenceangle, namely 22, 30 and 40 degrees. Note thatthe operational range <strong>of</strong> <strong>in</strong>cidence angles <strong>of</strong> TerraSAR-Xcomprises 20 to 45 degrees. In addition, different polarizationcomb<strong>in</strong>ations were chosen for the <strong>time</strong> <strong>series</strong>:VH/VV for two <strong>of</strong> them (22 and 40 degrees) and HH/VVfor the 30 degrees case. The schedule <strong>of</strong> the acquisitionsis illustrated <strong>in</strong> Fig. 1, where the dates employed for sow<strong>in</strong>gand harvest are also <strong>in</strong>dicated. Note that sow<strong>in</strong>g isnot simultaneous <strong>in</strong> all parcels <strong>of</strong> the site. In addition,the <strong>time</strong> span dedicated to harvest is about one month becausesome fields exhibit different development periodsand because there were some ra<strong>in</strong> events <strong>in</strong> the last dates,which complicated the harvest and post-harvest practices.The temporal gaps between acquisitions are only 2, 4 and5 days, thus provid<strong>in</strong>g a very frequent coverage <strong>of</strong> the testsite.As a consequence <strong>of</strong> the <strong>dual</strong>-pol operation, the swath <strong>of</strong>each image is half the swath <strong>of</strong> s<strong>in</strong>gle-pol case, so thef<strong>in</strong>al area covered <strong>by</strong> each image is about 15 km (ground-Figure 2. Temporal evolution <strong>of</strong> the backscatter<strong>in</strong>g coefficientsfor HH and VV for a s<strong>in</strong>gle <strong>rice</strong> field (parcel #34)at 30 ◦ <strong>in</strong>cidencerange) x 40 km (azimuth). Therefore, the whole <strong>rice</strong> areais not fully covered <strong>by</strong> the images, but the center region iscovered <strong>by</strong> all images (note that two <strong>series</strong> are descend<strong>in</strong>gand one is ascend<strong>in</strong>g).3. TEMPORAL EVOLUTION OF POLSAR OB-SERVABLESWith the objective <strong>of</strong> facilitat<strong>in</strong>g the analysis <strong>of</strong> the observations,we start this section <strong>by</strong> show<strong>in</strong>g the results for as<strong>in</strong>gle parcel. The temporal evolution <strong>of</strong> the backscatter<strong>in</strong>gcoefficients (σ 0 ) at HH and VV channels at 30 ◦ <strong>in</strong>cidenceis plotted <strong>in</strong> Fig. 2. The vertical l<strong>in</strong>e at DoY 156denotes the date <strong>of</strong> sow<strong>in</strong>g.Backscatter<strong>in</strong>g from the field is very low just after sow<strong>in</strong>gat both polarizations because the ground was completelyflooded and, consequently, all the <strong>in</strong>cident radarsignal is scattered <strong>in</strong> the specular direction (see blackareas <strong>in</strong> Fig. 3). From that moment, backscatter<strong>in</strong>g <strong>in</strong>creasesas the vegetation grows, and the HH channel providesa higher response than VV, reach<strong>in</strong>g a maximumon July 13. Then, from this date, the radar signal decreasesfor both channels, but the decrease rate is alsomore pronounced for vertical polarization. In fact, <strong>in</strong> theVV images acquired on August 26 and September 6 theaspect <strong>of</strong> the field is the same as the first image after sow<strong>in</strong>g(see Fig. 3), i.e. extremely low backscatter, despitethe fact that the vegetation is fully developed.From September 6 to September 17, both backscatter<strong>in</strong>gchannels <strong>in</strong>crease slightly. The images acquired onSeptember 28 exhibit a very high backscatter<strong>in</strong>g <strong>in</strong> thewhole area. After consult<strong>in</strong>g the weather archive, it wasnoticed that there was a strong ra<strong>in</strong> the day before (55mm/m 2 ), and also some ra<strong>in</strong> dur<strong>in</strong>g the acquisition day.As a result <strong>of</strong> the ra<strong>in</strong>, the water content <strong>in</strong> the vegetationvolume <strong>in</strong>creases, and this is the reason <strong>of</strong> a higherbackscatter<strong>in</strong>g. More details about this <strong>in</strong>terpretation are<strong>in</strong>cluded below.
10-Jun-2008 DoY = 16113-Jul-2008 DoY = 194Figure 4. Daily precipitations registered at a meteorologicalstation (Isla Mayor) located <strong>in</strong> the center <strong>of</strong> the testsite26-Aug-2008 DoY = 238HHVVFigure 3. Images <strong>of</strong> σ 0 at HH (left) and VV (right) channelsat 30 ◦ acquired at three dates (from top to bottom)Unfortunately, dur<strong>in</strong>g most <strong>of</strong> image acquisitions afterOctober 1, there were ra<strong>in</strong> events and, some<strong>time</strong>s, theywere accompanied <strong>by</strong> moderate w<strong>in</strong>ds (see Fig. 4). Consequently,it is very difficult to <strong>in</strong>terpret this last stage <strong>of</strong>the cultivation campaign.In addition to the observation <strong>of</strong> HH and VV, it is <strong>in</strong>terest<strong>in</strong>gto study the ratio between both channel powers(HH/VV) as a function <strong>of</strong> <strong>time</strong>. The HH/VV ratio (seeFig. 5) <strong>in</strong>creases <strong>in</strong> the first stages from 0 to more than 10dB. Then it decreases down to 2 dB, and it presents someoscillations <strong>in</strong> the last dates.When deal<strong>in</strong>g with backscatter<strong>in</strong>g coefficients, the products<strong>of</strong> TerraSAR-X can be calibrated <strong>in</strong> two differentways. The conventional calibration [6] allows the translation<strong>of</strong> DN (for detected products) or complex values(for s<strong>in</strong>gle-look complex products, as <strong>in</strong> this case) to β 0and σ 0 , and can be performed on a pixel-<strong>by</strong>-pixel basis.The second possible calibration, also named radiomet<strong>rice</strong>nhanced (RE) [7], <strong>in</strong>cludes also a statistical subtraction<strong>of</strong> a noise estimation annotated <strong>in</strong> the products. The REcalibration is necessary when work<strong>in</strong>g with low backscatter<strong>in</strong>gvalues, specially those close or lower to the noiseFigure 5. Temporal evolution <strong>of</strong> the HH/VV ratio for as<strong>in</strong>gle <strong>rice</strong> field (parcel #34) at 30 ◦ <strong>in</strong>cidencelevel. The drawback <strong>of</strong> the RE calibration is that it canbe only performed on multi-looked power images, so thephase <strong>in</strong>formation is not available anymore <strong>in</strong> the calibratedresults and spatial resolution is slightly degraded.The backscatter<strong>in</strong>g coefficients after the RE calibrationare shown <strong>in</strong> Fig. 6 for the same case <strong>of</strong> Fig. 2. We canobserve that differences are only evident for σ 0 valuesbelow -15 dB. This was expected because the NESZ isaround -19 dB for these images.In the rest <strong>of</strong> the paper we have used only the conventionalcalibration because we are <strong>in</strong>terested <strong>in</strong> exploit<strong>in</strong>galso the phase <strong>in</strong>formation provided <strong>by</strong> the sensor. Ofcourse, <strong>in</strong> cases where low σ 0 values are requested fora particular application and phase is not necessary, theRE calibrated data should be used <strong>in</strong>stead. Note also thatthe differences between the HH/VV ratio <strong>of</strong> the RE calibrateddata and the ratio provided <strong>by</strong> the conventionalcalibration are only evident at the po<strong>in</strong>ts with very lowVV backscatter<strong>in</strong>g.After observ<strong>in</strong>g the response at VV and HH for one parcel,we show now <strong>in</strong> Figs. 7 and 8 the evolutions <strong>of</strong>both backscatter<strong>in</strong>g coefficients and their ratio for all the
Figure 6. Temporal evolution <strong>of</strong> the radiometrically enhanced(RE) backscatter<strong>in</strong>g coefficients for HH and VVfor the same <strong>rice</strong> field (parcel #34) at 30 ◦ <strong>in</strong>cidenceFigure 8. Temporal evolution <strong>of</strong> the HH/VV ratio for allthe monitored parcels at 30 ◦ <strong>in</strong>cidencetion height <strong>in</strong>creases from 0 to about 70-90 cm. Then,the appearance <strong>of</strong> the panicle def<strong>in</strong>es the transition to thereproductive stage. In the reproductive stage there alsoappears a cluster <strong>of</strong> curved leaves <strong>in</strong> the top <strong>of</strong> the plants,as well as flower<strong>in</strong>g elements. Moreover, the stems becomedrier and tend to present a cane structure. F<strong>in</strong>ally,<strong>in</strong> the mature phase the gra<strong>in</strong>s appear and develop. Thewater content <strong>of</strong> the gra<strong>in</strong>s changes up and down until itis about 18-22 percent before harvest<strong>in</strong>g. For parcel #34,the vegetative phase f<strong>in</strong>ished about day 225 <strong>of</strong> the year(mid August), and the mature phase started around day270 (end <strong>of</strong> September).The <strong>in</strong>fluence <strong>of</strong> phenology <strong>in</strong> the radar responses can be<strong>in</strong>terpreted as expla<strong>in</strong>ed <strong>in</strong> the follow<strong>in</strong>g:Figure 7. Temporal evolution <strong>of</strong> the HH and VV backscatter<strong>in</strong>gcoefficients for all the monitored parcels at 30 ◦ <strong>in</strong>cidenceparcels with available ground truth. S<strong>in</strong>ce the sow<strong>in</strong>g datewas different for the parcels, the <strong>time</strong> <strong>series</strong> are not plottedversus the date (DoY), but shift<strong>in</strong>g them to a common<strong>time</strong> orig<strong>in</strong> at sow<strong>in</strong>g date.It is important to stress that the responses <strong>of</strong> all parcelsbut one (plotted <strong>in</strong> red) are very co<strong>in</strong>cident, both for the<strong>in</strong>divi<strong>dual</strong> σ 0 and the HH/VV ratio. Therefore, we canconclude that these temporal signatures are associatedwith this <strong>rice</strong> crop type and, <strong>in</strong> pr<strong>in</strong>ciple, can be used fordescrib<strong>in</strong>g its phenological evolution. The peculiarities<strong>of</strong> the outlier parcel (<strong>in</strong> red) will be expla<strong>in</strong>ed <strong>in</strong> the nextsection.The <strong>in</strong>terpretation <strong>of</strong> the overall temporal evolution canbe carried out <strong>by</strong> tak<strong>in</strong>g <strong>in</strong>to account the phenologicalevolution <strong>of</strong> the plants. In general, the cultivation periodis divided <strong>in</strong>to 3 ma<strong>in</strong> phenological phases: vegetative,reproductive and mature [8]. Dur<strong>in</strong>g the vegetative stagethe plant is composed <strong>of</strong> up to 10 stems (the ma<strong>in</strong> oneand new ones appear<strong>in</strong>g dur<strong>in</strong>g this period), and someleaves at the top <strong>in</strong> the late part <strong>of</strong> this phase. Vegeta-Vegetative phase The HH/VV ratio <strong>in</strong>creases with <strong>time</strong>from 0 after sow<strong>in</strong>g to around 8-12 dB, just at theend <strong>of</strong> the vegetative phase. Three considerationsdef<strong>in</strong>e this response:1. Radar backscatter<strong>in</strong>g at X-band and 30 degrees<strong>in</strong>cidence is dom<strong>in</strong>ated <strong>by</strong> the double-bounce<strong>in</strong>teraction between the flooded soil and thequasi-vertical stems. For this scatter<strong>in</strong>g mechanism,if ext<strong>in</strong>ction is ignored, it is known that:(a) When the stems are not very th<strong>in</strong>, totalbackscatter<strong>in</strong>g at HH is higher than at VVdue to the presence <strong>of</strong> the two bounces,with their correspond<strong>in</strong>g Brewster angles,which attenuate the VV echo more thanthe HH one.(b) For very th<strong>in</strong> stems (like <strong>in</strong> this scene) thef<strong>in</strong>al values <strong>of</strong> HH and VV depend importantlyon the <strong>in</strong>cidence angle and other parameters(such as the dielectric constants<strong>of</strong> stems and water). This is a consequence<strong>of</strong> the weak scatter<strong>in</strong>g at horizontalpolarization for such th<strong>in</strong> stems.(c) In general, when the double-bounce dom<strong>in</strong>ates,the value <strong>of</strong> the HH/VV ratio is
almost <strong>in</strong>dependent from the vegetationheight.2. For a scene composed <strong>by</strong> almost vertical veryth<strong>in</strong> cyl<strong>in</strong>ders, ext<strong>in</strong>ction coefficient at verticalpolarization is larger than at horizontal polarization,i.e. there exists differential ext<strong>in</strong>ction.Aga<strong>in</strong>, the values <strong>of</strong> the ext<strong>in</strong>ction coefficientsdo not depend on vegetation height.3. As vegetation height <strong>in</strong>creases (plants grow),the total attenuation is stronger for verticalthan for horizontal polarization, due to longerpropagation paths <strong>in</strong>side the vegetation volumeand the aforementioned differential ext<strong>in</strong>ction,and this is the mechanism driv<strong>in</strong>g the observedresponse. Note that attenuation at vertical polarizationis so strong that the backscatter<strong>in</strong>g atthe end <strong>of</strong> the vegetative stage (with already 90cm high plants) is around the noise level, likeat the <strong>time</strong> <strong>of</strong> flooded fields.Reproductive phase In this stage, the backscatter<strong>in</strong>gvalues at both polarizations approach each other, asa result <strong>of</strong> the follow<strong>in</strong>g aspects:1. The stems become drier than before (likecanes), so the reduced water content <strong>in</strong>ducesless vertical ext<strong>in</strong>ction and, as a result, asmaller differential ext<strong>in</strong>ction. This entailsa progressive <strong>in</strong>crease <strong>in</strong> the received VVbackscatter<strong>in</strong>g.2. The top part <strong>of</strong> the plants conta<strong>in</strong> more elements(panicle, leaves, etc.) than <strong>in</strong> the vegetativephase. These elements are not vertical, butrandomly oriented and bent, so there is morescatter<strong>in</strong>g at this layer, and it is not as polarizationdriven as before.Maturation phase In pr<strong>in</strong>ciple, <strong>in</strong>dependence from polarizationis expected at this stage before harvest,s<strong>in</strong>ce the plants become mostly a random volume.However, this has not been confirmed dur<strong>in</strong>g thiscampaign due to the presence <strong>of</strong> strong ra<strong>in</strong> andw<strong>in</strong>d at this stage (see Fig. 4), which have alteredimportantly their radar signatures.As already mentioned, we are also <strong>in</strong>terested <strong>in</strong> analyz<strong>in</strong>gthe phase <strong>in</strong>formation provided <strong>by</strong> this new sensor.Fig. 9 presents the evolution <strong>of</strong> the phase difference betweenboth copolar channels. This parameter (usuallynamed as polarization phase difference, PPD, <strong>in</strong> the literature[9]), is computed as the phase <strong>of</strong> the complex crosscorrelation between both channels. In this case, it is quiteevident that for all fields there exists a jump <strong>in</strong> the phaseat 30 to 40 days after sow<strong>in</strong>g, when the plants are visibleenough above the water level. This would be used as an<strong>in</strong>dicator <strong>of</strong> the emergence <strong>time</strong> for the plants. In addition,for all fields the phase difference exhibits a plateauuntil day 90-110, i.e. until the end <strong>of</strong> the vegetative phaseapproximately.Maps <strong>of</strong> the PPD for a part <strong>of</strong> the <strong>rice</strong> test site are alsoshown <strong>in</strong> Fig. 10, correspond<strong>in</strong>g to May 30 (about sow<strong>in</strong>gFigure 9. Temporal evolution <strong>of</strong> the phase difference betweenVV and HH for all the monitored parcels at 30 ◦<strong>in</strong>cidenceFigure 10. Images <strong>of</strong> the PPD from a part <strong>of</strong> the test site.Dates: Top - May 30. Bottom - August 26date) and August 26. The presence <strong>of</strong> the developed <strong>rice</strong>fields is quite evident <strong>in</strong> the second image, whereas thereis no PPD differences between fields <strong>in</strong> the first one.Thanks to the availability <strong>of</strong> phase <strong>in</strong>formation betweenthe copolar channels, we can also generate images for thefirst two elements <strong>of</strong> the Pauli basis, HH+VV and HH-VV, which are usually identified to direct and dihedraltypescatter<strong>in</strong>g. The result for the same parcel as beforeis shown <strong>in</strong> Fig. 11. In this case, however, the low level<strong>of</strong> VV backscatter<strong>in</strong>g when compared to HH makes bothPauli scatter<strong>in</strong>g mechanisms very similar, and hence bothare approximately equal to HH.The angular diversity provided for the VV channel <strong>by</strong>the three <strong>series</strong> <strong>of</strong> images has been also exploited here toshow the <strong>in</strong>fluence <strong>of</strong> the <strong>in</strong>cidence angle on this channel.As observed <strong>in</strong> Fig. 12, at the very early stages after sow<strong>in</strong>g,backscatter<strong>in</strong>g is higher for oblique <strong>in</strong>cidences s<strong>in</strong>cethe presence <strong>of</strong> very short plants can be observed betterat oblique angles. However, at the end <strong>of</strong> the vegetativephase, the order is the opposite, due to a stronger totalattenuation at more oblique <strong>in</strong>cidences because the paths<strong>of</strong> the waves <strong>in</strong>side the vegetation volume are longer foroblique angles.In addition to the previous results, it is possible to applyto these <strong>dual</strong>-pol images a polarimetric decomposition
and a decrease dur<strong>in</strong>g the reproductive phase. A physical<strong>in</strong>terpretation <strong>of</strong> these signatures, based on scatter<strong>in</strong>gand ext<strong>in</strong>ction mechanisms present <strong>in</strong> the scene, has beenprovided. Other observations, like the phase differencebetween channels, the angular variation <strong>of</strong> backscatter<strong>in</strong>g,and the <strong>dual</strong>-pol entropy-alpha decomposition havebeen also tested. In addition, a quick identification <strong>of</strong>the cultivated <strong>rice</strong> fields and the detection <strong>of</strong> areas withcultivation problems have been proposed as possible applications<strong>of</strong> this remote sens<strong>in</strong>g tool.The next steps <strong>in</strong> this project will cover different objectives.First, an electromagnetic model <strong>of</strong> the scene will bedeveloped <strong>in</strong> order to better understand the radar responseand to enable the construction <strong>of</strong> future algorithms for theretrieval <strong>of</strong> biophysical parameters <strong>of</strong> <strong>in</strong>terest. To date, aprelim<strong>in</strong>ary model for the first part <strong>of</strong> the vegetative phasebased on Monte Carlo simulations [11], with the plantsmodelled only <strong>by</strong> the stems, have been implemented andtested. The addition <strong>of</strong> a layer <strong>of</strong> leaves, a better description<strong>of</strong> the plants morphology <strong>by</strong> chang<strong>in</strong>g it as a function<strong>of</strong> phenology stage, and the <strong>in</strong>corporation <strong>of</strong> multiplescatter<strong>in</strong>g to simulate cluster<strong>in</strong>g effects are currently be<strong>in</strong>g<strong>in</strong>corporated to the model. Second, the automation <strong>of</strong>the image process<strong>in</strong>g required for the proposed applications(e.g. <strong>rice</strong> fields identification, problems detection,etc.) is required. Third, the correlation <strong>of</strong> the observableswith the precise phenological phase and with theavailable biophysical parameters, provided <strong>by</strong> the groundtruth campaign, has to be conducted. The new observationspresented <strong>in</strong> this paper (phase differences betweencopolar channels and <strong>dual</strong>-pol entropy-alpha decompositionoutputs) should be also <strong>in</strong>terpreted <strong>in</strong> terms <strong>of</strong> thescatter<strong>in</strong>g mechanisms present <strong>in</strong> the scene.Despite the fast growth <strong>of</strong> this type <strong>of</strong> crop, SAR <strong>in</strong>terferometryobservables (coherence and phase) obta<strong>in</strong>ed <strong>by</strong>comb<strong>in</strong><strong>in</strong>g images separated 11 days may provide alsohelpful <strong>in</strong>formation, so this will be also tested.F<strong>in</strong>ally, a plan for the 2009 campaign has to be def<strong>in</strong>ed <strong>in</strong>the framework <strong>of</strong> the same project. Among the decisionsto be taken, the selection <strong>of</strong> polarization channels and thetrade-<strong>of</strong>f between spatial and temporal coverage will bestudied <strong>by</strong> attend<strong>in</strong>g the requests <strong>of</strong> the <strong>rice</strong> farmers.ACKNOWLEDGMENTSAll SAR images have been provided <strong>by</strong> DLR <strong>in</strong> theframework <strong>of</strong> project LAN0021 <strong>of</strong> the pre-launch AO <strong>of</strong>TerraSAR-X.This work has been supported <strong>by</strong> the Spanish M<strong>in</strong>istry<strong>of</strong> Education and Science (MEC) under projectsTEC2005-06863-C02-02, TEC2008-06764-C02-02, andHA2007-075, <strong>by</strong> the Generalitat Valenciana underproject GVPRE/2008/344, and <strong>by</strong> the University <strong>of</strong> Alicanteunder project GRE08J01.The authors would like to thank the support <strong>of</strong> ManuelCano, Fernando Carrascal and Santiago Aparicio, allfrom the Federacion de Arroceros de Sevilla, for provid<strong>in</strong>gthe ground-truth data.REFERENCES[1] T. Kurosu, M. Fujita, and K. Chiba. Monitor<strong>in</strong>g<strong>of</strong> <strong>rice</strong> crop growth from space us<strong>in</strong>g the ERS-1 C-band SAR. IEEE Trans. Geosci. Remote Sens<strong>in</strong>g,33(4):1092–1096, July 1995.[2] T. Le Toan, F. Ribbes, L.-F. Wang, N. Floury, K.-H.D<strong>in</strong>g, J. A. Kong, M. Fujita, and T. Kurosu. Ricecrop mapp<strong>in</strong>g and <strong>monitor<strong>in</strong>g</strong> us<strong>in</strong>g ERS-1 databased on experiment and model<strong>in</strong>g results. IEEETrans. Geosci. Remote Sens<strong>in</strong>g, 35(1):41–56, January1997.[3] J.-Y. Koay et al. Paddy fields as electrically densemedia: Theoretical model<strong>in</strong>g and measurementcomparisons. IEEE Trans. Geosci. Remote Sens<strong>in</strong>g,45(9):2837–2849, September 2007.[4] T. Le Toan, H. Laur, E. Moug<strong>in</strong>, and A. Lopes.Multitemporal and <strong>dual</strong>-polarization observations<strong>of</strong> agricultural vegetation covers <strong>by</strong> X-band SARimages. IEEE Trans. Geosci. Remote Sens<strong>in</strong>g,27(6):709–718, November 1989.[5] Y. Inoue et al. Season-long daily measurements<strong>of</strong> multifrequency (Ka, Ku, X, C, and L) and fullpolarizationbackscatter signatures over paddy <strong>rice</strong>field and their relationship with biological variables.Remote Sens<strong>in</strong>g <strong>of</strong> Environment, 81:194–204, 2002.[6] T. Fritz et al. TerraSAR-X Ground Segment. Level1b Product Format Specification. Annex B. DLR.Doc. TX-GS-DD-3307, 2007.[7] T. Fritz. Tips & tricks for spectral, radiometric andgeometric <strong>in</strong>terpretation <strong>of</strong> TerraSAR-X products.Part I. In Proceed<strong>in</strong>gs <strong>of</strong> the 3rd TerraSAR-X ScienceTeam Meet<strong>in</strong>g, Wessl<strong>in</strong>g, Germany, November2008.[8] U. Meier, editor. Growth Stages <strong>of</strong>Mono- and Dicotyledonous Plants.BBCH Monograph. 2nd edition, 2001.http://www.bba.de/veroeff/bbch/bbcheng.pdf.[9] F. T. Ula<strong>by</strong>, D. N. Held, M. C. Dobson, K. C. Mc-Donald, and T. B. A. Senior. Relat<strong>in</strong>g polarizationphase difference <strong>of</strong> SAR signals to scene properties.IEEE Trans. Geosci. Remote Sens<strong>in</strong>g, 25(1):83–92,January 1987.[10] S. R. Cloude. The <strong>dual</strong> polarization entropy/alphadecomposition: a PALSAR case study. In Proceed<strong>in</strong>gs<strong>of</strong> the 3rd PolInSAR Workshop, Frascati, Italy,January 2007.[11] L. Tsang, K. D<strong>in</strong>g, G. Zhang, and J. A. Kong.Backscatter<strong>in</strong>g enhancement and cluster<strong>in</strong>g effects<strong>of</strong> randomly distributed dielectric cil<strong>in</strong>ders overly<strong>in</strong>ga dielectric half space based on Monte-Carlosimulations. 43(5):488–499, May 1995.


