

nfplyk9
nfplyk9
nfplyk9

Create successful ePaper yourself
Turn your PDF publications into a flip-book with our unique Google optimized e-Paper software.
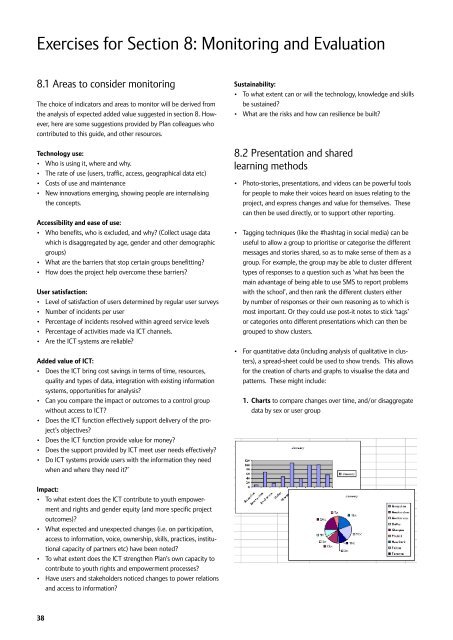
Exercises for Section 8: Monitoring and Evaluation8.1 Areas to consider monitoringThe choice of indicators and areas to monitor will be derived fromthe analysis of expected added value suggested in section 8. However,here are some suggestions provided by Plan colleagues whocontributed to this guide, and other resources.Technology use:• Who is using it, where and why.• The rate of use (users, traffic, access, geographical data etc)• Costs of use and maintenance• New innovations emerging, showing people are internalisingthe concepts.Accessibility and ease of use:• Who benefits, who is excluded, and why? (Collect usage datawhich is disaggregated by age, gender and other demographicgroups)• What are the barriers that stop certain groups benefitting?• How does the project help overcome these barriers?User satisfaction:• Level of satisfaction of users determined by regular user surveys• Number of incidents per user• Percentage of incidents resolved within agreed service levels• Percentage of activities made via ICT channels.• Are the ICT systems are reliable?Added value of ICT:• Does the ICT bring cost savings in terms of time, resources,quality and types of data, integration with existing informationsystems, opportunities for analysis?• Can you compare the impact or outcomes to a control groupwithout access to ICT?• Does the ICT function effectively support delivery of the project’sobjectives?• Does the ICT function provide value for money?• Does the support provided by ICT meet user needs effectively?• Do ICT systems provide users with the information they needwhen and where they need it?’Sustainability:• To what extent can or will the technology, knowledge and skillsbe sustained?• What are the risks and how can resilience be built?8.2 Presentation and sharedlearning methods• Photo-stories, presentations, and videos can be powerful toolsfor people to make their voices heard on issues relating to theproject, and express changes and value for themselves. Thesecan then be used directly, or to support other reporting.• Tagging techniques (like the #hashtag in social media) can beuseful to allow a group to prioritise or categorise the differentmessages and stories shared, so as to make sense of them as agroup. For example, the group may be able to cluster differenttypes of responses to a question such as ‘what has been themain advantage of being able to use SMS to report problemswith the school’, and then rank the different clusters eitherby number of responses or their own reasoning as to which ismost important. Or they could use post-it notes to stick ‘tags’or categories onto different presentations which can then begrouped to show clusters.• For quantitative data (including analysis of qualitative in clusters),a spread-sheet could be used to show trends. This allowsfor the creation of charts and graphs to visualise the data andpatterns. These might include:1. Charts to compare changes over time, and/or disaggregatedata by sex or user groupImpact:• To what extent does the ICT contribute to youth empowermentand rights and gender equity (and more specific projectoutcomes)?• What expected and unexpected changes (i.e. on participation,access to information, voice, ownership, skills, practices, institutionalcapacity of partners etc) have been noted?• To what extent does the ICT strengthen Plan’s own capacity tocontribute to youth rights and empowerment processes?• Have users and stakeholders noticed changes to power relationsand access to information?38