Practice Midterm 2 1. Suppose that you wish to compare two means ...
Practice Midterm 2 1. Suppose that you wish to compare two means ...
Practice Midterm 2 1. Suppose that you wish to compare two means ...
- No tags were found...

Create successful ePaper yourself
Turn your PDF publications into a flip-book with our unique Google optimized e-Paper software.
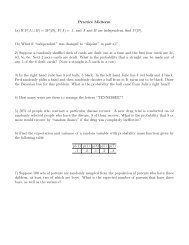
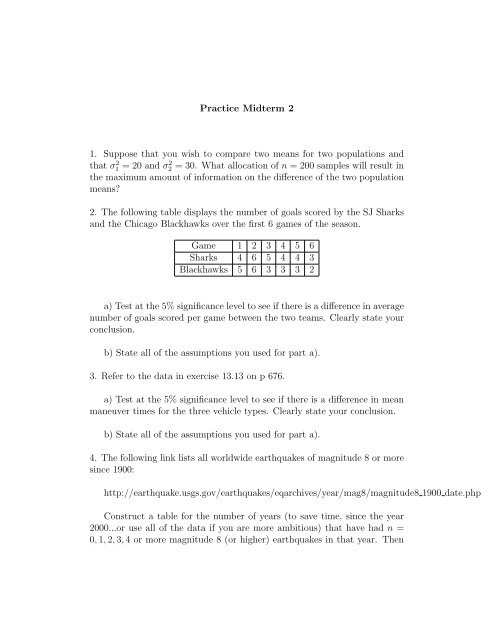
<strong>Practice</strong> <strong>Midterm</strong> 2<strong>1.</strong> <strong>Suppose</strong> <strong>that</strong> <strong>you</strong> <strong>wish</strong> <strong>to</strong> <strong>compare</strong> <strong>two</strong> <strong>means</strong> for <strong>two</strong> populations and<strong>that</strong> σ 2 1 =20andσ 2 2 = 30. What allocation of n =200sampleswillresultinthe maximum amount of information on the difference of the <strong>two</strong> population<strong>means</strong>?2. The following table displays the number of goals scored by the SJ Sharksand the Chicago Blackhawks over the first 6 games of the season.Game 1 2 3 4 5 6Sharks 4 6 5 4 4 3Blackhawks 5 6 3 3 3 2a) Test at the 5% significance level <strong>to</strong> see if there is a difference in averagenumber of goals scored per game between the <strong>two</strong> teams. Clearly state <strong>you</strong>rconclusion.b) State all of the assumptions <strong>you</strong> used for part a).3. Refer <strong>to</strong> the data in exercise 13.13 on p 676.a) Test at the 5% significance level <strong>to</strong> see if there is a difference in meanmaneuver times for the three vehicle types. Clearly state <strong>you</strong>r conclusion.b) State all of the assumptions <strong>you</strong> used for part a).4. The following link lists all worldwide earthquakes of magnitude 8 or moresince 1900:http://earthquake.usgs.gov/earthquakes/eqarchives/year/mag8/magnitude8 1900 date.phpConstruct a table for the number of years (<strong>to</strong> save time, since the year2000...or use all of the data if <strong>you</strong> are more ambitious) <strong>that</strong> have had n =0, 1, 2, 3, 4ormoremagnitude8(orhigher)earthquakesin<strong>that</strong>year. Then
use a chi square test <strong>to</strong> determine whether the data follows a Poisson distribution.Clearly state <strong>you</strong>r conclusion.5. <strong>Suppose</strong> <strong>you</strong> have observations (x i ,y i )fori =1,...,n and <strong>you</strong> want <strong>to</strong>run a linear regression where y is the target variable and x is the predic<strong>to</strong>rvariable.a) Write down the linear model equation for y i in terms of x i and explainthe assumptions about each term.b) Now consider the case of multiple linear regression where x i is nowa vec<strong>to</strong>r. The R function “summary” returns information on a fitted linearmodel, in particular the p-values of the estimated coefficients. What is themeaning of these p-values and how can they be used <strong>to</strong> improve the model?