Download Document - Universities UK
Download Document - Universities UK
Download Document - Universities UK

You also want an ePaper? Increase the reach of your titles
YUMPU automatically turns print PDFs into web optimized ePapers that Google loves.
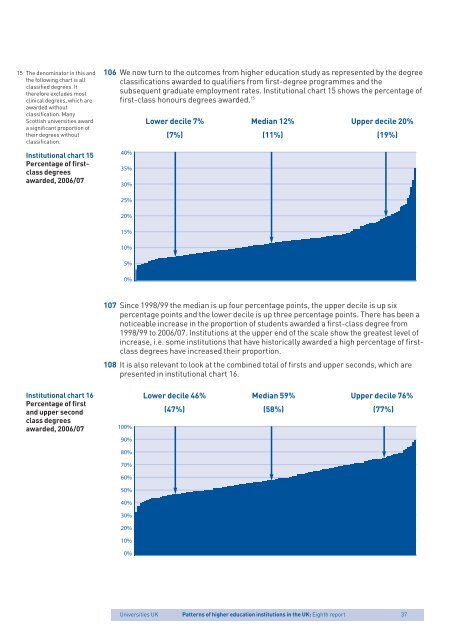
15 The denominator in this andthe following chart is allclassified degrees. Ittherefore excludes mostclinical degrees, which areawarded withoutclassification. ManyScottish universities awarda significant proportion oftheir degrees withoutclassification.Institutional chart 15Percentage of firstclassdegreesawarded, 2006/07106 We now turn to the outcomes from higher education study as represented by the degreeclassifications awarded to qualifiers from first-degree programmes and thesubsequent graduate employment rates. Institutional chart 15 shows the percentage offirst-class honours degrees awarded. 1540%35%30%Lower decile 7%(7%)Median 12%(11%)Upper decile 20%(19%)25%20%15%10%5%0%107 Since 1998/99 the median is up four percentage points, the upper decile is up sixpercentage points and the lower decile is up three percentage points. There has been anoticeable increase in the proportion of students awarded a first-class degree from1998/99 to 2006/07. Institutions at the upper end of the scale show the greatest level ofincrease, i.e. some institutions that have historically awarded a high percentage of firstclassdegrees have increased their proportion.108 It is also relevant to look at the combined total of firsts and upper seconds, which arepresented in institutional chart 16.Institutional chart 16Percentage of firstand upper secondclass degreesawarded, 2006/07100%Lower decile 46%(47%)Median 59%(58%)Upper decile 76%(77%)90%80%70%60%50%40%30%20%10%0%<strong>Universities</strong> <strong>UK</strong>Patterns of higher education institutions in the <strong>UK</strong>: Eighth report37