rig 4 04 Book.book - Associazione Geotecnica Italiana
rig 4 04 Book.book - Associazione Geotecnica Italiana
rig 4 04 Book.book - Associazione Geotecnica Italiana

You also want an ePaper? Increase the reach of your titles
YUMPU automatically turns print PDFs into web optimized ePapers that Google loves.
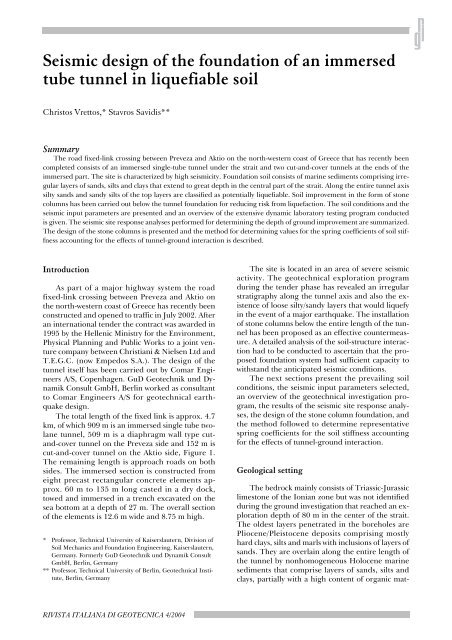
Seismic design of the foundation of an immersedtube tunnel in liquefiable soilChristos Vrettos,* Stavros Savidis**SummaryThe road fixed-link crossing between Preveza and Aktio on the north-western coast of Greece that has recently beencompleted consists of an immersed single-tube tunnel under the strait and two cut-and-cover tunnels at the ends of theimmersed part. The site is characterized by high seismicity. Foundation soil consists of marine sediments comprising irregularlayers of sands, silts and clays that extend to great depth in the central part of the strait. Along the entire tunnel axissilty sands and sandy silts of the top layers are classified as potentially liquefiable. Soil improvement in the form of stonecolumns has been carried out below the tunnel foundation for reducing risk from liquefaction. The soil conditions and theseismic input parameters are presented and an overview of the extensive dynamic laboratory testing program conductedis given. The seismic site response analyses performed for determining the depth of ground improvement are summarized.The design of the stone columns is presented and the method for determining values for the spring coefficients of soil stiffnessaccounting for the effects of tunnel-ground interaction is described.IntroductionAs part of a major highway system the roadfixed-link crossing between Preveza and Aktio onthe north-western coast of Greece has recently beenconstructed and opened to traffic in July 2002. Afteran international tender the contract was awarded in1995 by the Hellenic Ministry for the Environment,Physical Planning and Public Works to a joint venturecompany between Christiani & Nielsen Ltd andT.E.G.C. (now Empedos S.A.). The design of thetunnel itself has been carried out by Comar EngineersA/S, Copenhagen. GuD Geotechnik und DynamikConsult GmbH, Berlin worked as consultantto Comar Engineers A/S for geotechnical earthquakedesign.The total length of the fixed link is approx. 4.7km, of which 909 m is an immersed single tube twolanetunnel, 509 m is a diaphragm wall type cutand-covertunnel on the Preveza side and 152 m iscut-and-cover tunnel on the Aktio side, Figure 1.The remaining length is approach roads on bothsides. The immersed section is constructed fromeight precast rectangular concrete elements approx.60 m to 135 m long casted in a dry dock,towed and immersed in a trench excavated on thesea bottom at a depth of 27 m. The overall sectionof the elements is 12.6 m wide and 8.75 m high.* Professor, Technical University of Kaiserslautern, Division ofSoil Mechanics and Foundation Engineering, Kaiserslautern,Germany. Formerly GuD Geotechnik und Dynamik ConsultGmbH, Berlin, Germany** Professor, Technical University of Berlin, Geotechnical Institute,Berlin, GermanyThe site is located in an area of severe seismicactivity. The geotechnical exploration programduring the tender phase has revealed an irregularstratigraphy along the tunnel axis and also the existenceof loose silty/sandy layers that would liquefyin the event of a major earthquake. The installationof stone columns below the entire length of the tunnelhas been proposed as an effective countermeasure.A detailed analysis of the soil-structure interactionhad to be conducted to ascertain that the proposedfoundation system had sufficient capacity towithstand the anticipated seismic conditions.The next sections present the prevailing soilconditions, the seismic input parameters selected,an overview of the geotechnical investigation program,the results of the seismic site response analyses,the design of the stone column foundation, andthe method followed to determine representativespring coefficients for the soil stiffness accountingfor the effects of tunnel-ground interaction.Geological settingThe bedrock mainly consists of Triassic-Jurassiclimestone of the Ionian zone but was not identifiedduring the ground investigation that reached an explorationdepth of 80 m in the center of the strait.The oldest layers penetrated in the boreholes arePliocene/Pleistocene deposits comprising mostlyhard clays, silts and marls with inclusions of layers ofsands. They are overlain along the entire length ofthe tunnel by nonhomogeneous Holocene marinesediments that comprise layers of sands, silts andclays, partially with a high content of organic mat-RIVISTA ITALIANA DI GEOTECNICA 4/20<strong>04</strong>
42 VRETTOS - SAVIDISFig. 1 – Longitudinal section showing geology with soil units.Fig. 1 – Sezione longitudinale che mostra la geologia del sito completo delle unità stratigrafiche.ter. The longitudinal section as obtained from theborehole logs is depicted in Figure 1 and shows thatthe immersed tunnel is founded wholly within thesesoft sediments.Design earthquakeThe seismological study carried out in 1995concluded that the site is characterized by highseismicity. A detailed seismic hazard estimationyielded a peak ground acceleration at the free surfaceof 0.32g for a return period of 475 years and0.40g for 949 years return period. Synthesizedstrong ground motions have been derived by consideringthree cases: near field, moderate distance,and far field earthquake with different values ofmagnitude, epicentral distance, and focal depth.The maximum acceleration a max is obtained fromthe near field earthquake of magnitude M S =6.5yielding at base rock level a value of 0.27g. For thebedrock a shear wave velocity V S = 600 m/s was assumed.Based on these findings the following valueshave finally been suggested for use in the tunneldesign: Synthesized strong motions were scaled toyield a max = 0.33g for the near field earthquakeand assigned to the rock outcrop. The accelerationtime history of the design earthquake and its responsespectrum are depicted in Figure 2.Geotechnical investigations and soil parametersAn extensive in-situ and laboratory testing programhas been carried out both off-shore and onshore.Standard tests included all common laboratorytests for soil classification, soil shear resist-Fig. 2 – Time history and 5% damping response spectrumof the design earthquake scaled at 0.33g.Fig. 2 – Variazione temporale dell’accelerazione del sisma diprogetto riscalata a 0.33g (in basso) e spettro di risposta relativoad un fattore di smorzamento del 5%.RIVISTA ITALIANA DI GEOTECNICA
SEISMIC DESIGN OF THE FOUNDATION OF AN IMMERSED TUBE TUNNEL IN LIQUEFIABLE SOIL43ance, and compressibility as well as in-situ such asStandard Penetration Tests (SPT) at the 14 boreholelocations and a large number of DynamicProbings Super Heavy (DPSH) along the tunnelaxis. Two pumping tests have been carried out toevaluate soil permeability.In order to obtain a continuous profile of thesoil conditions a total of 72 Cone Penetration Testswith pore pressure measurement (CPTU) havebeen performed on land and at sea. In addition 10Seismic Cone Penetration Tests (SCPTU) havebeen conducted on land to gain information on thein-situ shear wave velocity.Information on the dynamic soil properties(shear modulus and damping ratio) over a widestrain range was obtained from the results of 30Resonant Column Tests. 18 Cyclic Direct SimpleShear Tests were carried out on sandy/silty samplesto determine liquefaction potential in terms ofpore water pressure build-up. Tests were suitablyadjusted to allow for in-situ field conditions.Idealized soil profiles for the seismic site responseanalysis has been established by combiningempirical correlations and results from the geotechnicalinvestigation program. Particular attentionhas been paid to the nonlinearity of the soil properties.Soil stratigraphy and densityThe layering sequence was taken from the boreholelogs and verified from the results of the CPTUtests by adopting the empirical chart given by RO-BERTSON [1990] that classifies soil from cone pointresistance, sleeve friction, and pore pressurechange. Agreement between borehole logs andCPTU interpretation was very good. The in situdensity of the cohesionless soils, that is the crucialproperty for the liquefaction susceptibility, was determinedin terms of the relative density D r from theSPT N-values by using the empirical relation bySKEMPTON [1986] and also from the CPTU conepoint resistance q c using the empirical relation byLUNNE and CHRISTOFFERSEN [1983]. Both data reductionprocedures consider the effects of effective confiningpressure. For verification purposes, the ratioq c / N has also been determined in dependence ofthe mean grain size of the soil and compared withthe respective range of values given by ROBERTSON etal. [1983]. Values of relative density were requiredin the specification of the cyclic shear tests.Soil density inferred from CPTU tests was ingeneral higher compared to that from SPT tests.The latter results were used in the design, theformer being considered as an addition safety factor.Cyclic soil resistanceStress-controlled cyclic simple shear tests wereconducted both on sandy-silty and sandy soil samples.Due to the cohesion the former could be testedon undisturbed status while the latter have beentested on reconstituted samples at different valuesof relative density. Various combinations of cyclicshear stress τ cyc and effective consolidation stress σ vc ’have been selected. The onset of liquefaction wasdefined at 100% pore pressure ratio or when cyclicshear strain amplitude reached a value of 10% indouble amplitude, SEED and IDRISS [1982].More specifically, seven tests have been conductedon reconstituted sandy samples(d 10 =0.14 mm, d 60 =0.3 mm) at two levels of cyclicstress ratio τ cyc / σ vc ’ equal to 0.2 and 0.4, respectively.Consolidation stress σ vc ’ and relative densityD r varied in narrow ranges from 120 kPa to 180 kPaand from 0.27 to 0.42, respectively, and no cleartrend regarding their influence could be establishedfrom the tests. Number of cycles to liquefaction observedin the tests was equal to 2 at the higher levelof cyclic stress ratio of 0.4, while at the lower level of0.2 the respective cycles number varied between 6and 10.A silty sand sample with d 10 =0.02 mm andd 60 =0.25 mm tested at τ cyc / σ vc ’=0.4 with σ vc ’ from75 kPa to 150 kPa also showed initial liquefaction after2 to 10 cycles. Typical sandy silt samples with50% fines contents tested under σ vc ’ =100 kPa didnot exhibit initial liquefaction but developed highstrains reaching 10% double amplitude after 5 to 7loading cycles at cyclic stress ratios between 0.3 and0.4.Dynamic soil stiffness and soil dampingDue to the strong variability of the soil strataand the large size of the site the project-specificresonant column tests were not sufficient to definevalues for the dynamic soil properties at all desiredlocations. Additional data have been taken fromtests on marine samples from a project in the CorinthianGulf with similar soil characteristics. Thetest results referring to medium plasticity clays arepresented by VRETTOS and SAVIDIS [1999]. Resonantcolumn tests for each sample have been conductedat two levels of confining pressure. In the firststage, strain levels were kept within the range ofelastic soil behaviour while in the second stage theexcitation force was increased reaching shearstrain levels of up to 0.5%, depending on the soilmaterial and the apparatus capacity.From the various design equations available inthe literature for the value of the shear modulus atOTTOBRE - DICEMBRE 20<strong>04</strong>
44 VRETTOS - SAVIDISlow strain G max the one suggested by HARDIN [1978]for normally consolidated sands and clays was selectedas the general EquationG max = S ⇒[1/(0.3+0.7⇒e 2 )]⇒(p a ⇒σ m ’) 0.5 (1)where S is a stiffness factor, e is the void ratio, p a isthe atmospheric pressure, and σ m ’ is the mean effectiveconfining pressure. Hardin recommendedS=625.Another estimate of G max was made by combiningthe results of pocket penetrometer tests (unconfinedcompression strength q u ) and an empirical relationbetween the undrained shear strength c u andG max , whereby c u is obtained from c u = q u / 2 and theratio G max / c u is determined in dependence of thesoil plasticity index following the summary byWEILER [1988].Shear wave velocities at small strains V S,max (andaccordingly G max ) were also estimated from the SPTN-values using the empirical correlations given byIWASAKI [1988] for marine soils:V S, max = 38.8 ⇒F i ⇒ (σ 0 ’) 0.175 ⇒ (N+1) 0.244 (2)where F i is a soil factor with the values 1.0 for clay,0.922 for sand, and 0.851 for gravel, σ 0 ’ is the verticaleffective overburden stress in kPa, and V S,max isgiven in m/sec.For the sandy soil the following relation basedon the corrected and normalized SPT blow countnumber (N 1 ) 60 proposed by SEED et al. [1986] wasalso used to estimate the in-situ shear modulus:G max = 4400 ⇒[(N 1 ) 60 ] 1/3 ⇒( m ’) 0.5 (3)with G max and σ m ’ given in kPa.Using engineering judgement the various valuesgiven above have been combined at each particularlocation to a single, best estimate value. SCPTUresults showed considerably higher velocities thanexpected and were used mainly as indicator for thedepth-variation of the shear wave velocity.Values for the shear modulus reduction and thedamping ratio increase with increasing shear strainamplitude, G/G max vs. γ and D vs. γ curves, for equivalent-lineardynamic analysis were taken from thesite-specific resonant column tests and werechecked against the set of curves proposed byVUCETIC and DOBRY [1991]. For the numerical analysisthe foundation soils along the tunnel axis havebeen divided into 17 types by introducing the followingtwo general design equations:G / G max = 1 / (1 + α γ c ) (4)D = D min + D max / [1 + 1/(β⇒γ d )] (5)Tab. I – Soil parameters for the profiles in Fig. 3.Tab. I – Parametri del terreno relativi ai profili stratigrafici diFig. 3.MaterialNo.α[-]c[-]D min[%]D max[%]β[-]d[-]1 25.0 1.0 1.5 24.0 7.4 1.02 22.0 1.0 2.0 24.0 7.4 1.03 7.7 0.8 2.0 20.0 5.4 0.84 28.0 1.2 6.0 22.0 4.8 1.05 23.0 1.0 1.8 20.0 5.4 0.86 7.7 1.1 2.0 20.0 3.7 1.07 9.5 0.8 2.0 21.0 6.0 0.88 7.7 0.8 2.0 20.0 5.4 0.89 20.0 1.0 2.0 22.0 9.0 1.010 6.5 1.0 3.5 18.0 3.9 0.811 5.0 1.0 4.0 24.0 1.7 1.012 25.0 1.0 1.5 22.0 7.7 1.013 23.0 1.3 2.5 22.0 7.3 1.3Tab. II – Soil parameters for alternative soil profile.Tab. II – Parametri del terreno riferiti al profilo stratigrafico diprogetto alternativo.MaterialNo.α[-]c[-]D min[%]D max[%]β[-]d[-]21 – Clay 3.0 0.77 0.0 30.0 2.2 0.6722 – Sand 17.1 1.0 0.0 30.0 2.2 0.67where γ is given in %, α, β, c, and d, are constants forthe particular soil type and D min and D max are the valuesof damping ratio at the two ends of the D(γ) curve,i.e. at very low and very high shear strain amplitudes,respectively. The large number of sub-groupsreflects the complexity of the encountered soils conditions.Numerical values of the parameters for thesoil profiles presented herein are given in Table I.In addition to these site-specific curves a set ofcurves, one for sands and one for clays, was alsoused to establish an alternative design soil profile.The respective G/G max vs. γ and D vs. γ relationshipshave been derived by linear regression for the dataof the sample problem in the manual of SHAKE91,IDRISS and SUN [1992]. The parameters in terms ofEquations (4) and (5) are given in Table II. Thesecurves describe a more linear soil behaviour andlead in general to higher amplification values.The inherent uncertainty in modelling dynamicsoil properties in site response analyses was tackledby first defining a best-estimate basic soil profile andthen varying the dynamic soil properties within aprescribed range. The idealized basic profiles atthree representative borehole locations includingCPTU-logs, SPT N-values, shear wave velocities,and material numbers are depicted in Figure 3. Thedepth of the first layer, that has no entry, defines thedepth of excavation for the tunnel.RIVISTA ITALIANA DI GEOTECNICA
SEISMIC DESIGN OF THE FOUNDATION OF AN IMMERSED TUBE TUNNEL IN LIQUEFIABLE SOIL45Fig. 3 – Representative soil profiles at three locations. BH8 is near the portal at the Aktio shore, BH12 is at the center ofthe strait, and BH10 is midway between the center of the strait and the Preveza shore.Fig. 3 – Profili stratigrafici riferiti a tre differenti sezioni. BH8 è posto vicino all’imbocco presso la baia di Aktio, BH12 al centro dellostretto e BH10 a metà fra il centro dello stretto e la baia di Preveza.OTTOBRE - DICEMBRE 20<strong>04</strong>
46 VRETTOS - SAVIDISLiquefaction potentialFig. 4 – Cyclic stress ratio due to design earthquake. Thesolid lines are for the basic soil profiles, the dotted linesfor profiles with 20% higher shear modulus for all soillayers.Fig. 4 – Rapporto di sforzo ciclico dovuto al sisma di progetto. Lelinee continue sono relative ai profili stratigrafici di riferimento,mentre le linee tratteggiate ai profili caratterizzati da unincremento del 20% del modulo di taglio assegnato a tutti glistrati.The classical method based on a total stress approachwas adopted for the liquefaction study.The cyclic stress developed in the soil due to theearthquake shaking was calculated by the codeSHAKE91 at five representative locations along thetunnel axis. Between these five locations the cyclicstress ratio was determined by the simplifiedmethod suggested by SEED and IDRISS [1982] consideringan appropriate depth reduction factor.The cyclic resistance of the soil was determinedon the basis of field tests, the results of cyclic testsbeing used mainly as supporting evidence. The simplifiedprocedure based on SPT blow count numberswas adopted, SEED et al. [1985]. Appropriatescaling factors were applied to account for earthquakeswith magnitude less than 7.5, SEED and IDRISS[1982], and also for the effects of overburden stress,SEED and HARDER [1990].For plastic fine-grained soil the liquefaction potentialwas estimated by using the so-called Chinesecriteria based on liquid limit, water content, and percent fines less or equal 0.5μm, as described by FINN[1992].Due to the vast amount of CPT results availableand in order to attain a consistent evaluation of liquefactionresistance, criteria based on CPT testswere also applied at each site location investigatedusing the charts by ROBERTSON and FEAR [1995].For the assessment of liquefaction susceptibilityusing results of cyclic tests the number of significantcycles for the earthquake under consideration isneeded. This number was determined by interpolationfrom the recommendations by SEED and IDRISS[1982] yielding a value of Neq = 8 for M S = 6.5.The seismic site response analysis was first conductedat the location BH8. Figure 4 shows typicalresults for the distribution of cyclic stress ratio at thelocations BH8 and BH12, whereby τ av denotes theaverage shear stress due to the earthquake and σ 0 ’ isthe vertical effective overburden stress after excavation.The screening procedure described aboveyielded a liquefiable zone of approx. 15 m thicknessalong the entire length of the immersed and most ofthe cut-and-cover parts of the tunnel. The installationof stone columns was proposed as an effectivecountermeasure primarily due to the increaseddrainage capacity of the improved composite soil.The associated densification and reinforcement ofthe loose soil layers were considered as a secondarybenefit. Although at some locations no improvementwas necessary for protection against liquefaction,stone columns have been placed along the entirelength of the tunnel to provide a continuous distributionof foundation stiffness and dynamic forcesin the structure.Design of stone columnsThe method suggested by SEED and BOOKER[1977] was used for the analysis. Parameters that enterthe calculation are given below together withtheir numerical values as determined specifically forthis project: i) earthquake characteristics: magnitudeM S = 6.5, number of equivalent cycles N eq = 8,duration of ground shaking t d = 15 sec, ii) soil properties:permeability in the horizontal directionk=2⇒10 -5 m/sec and coefficient of compressibilitym v =4⇒10 -5 m 2 /kN, iii) liquefaction resistance of naturalsoil: number of cycles to liquefaction Nliq = 4.After specifying a maximum allowable porepressure ratior g = u / σ 0 ’ (6)where u is the excess pore pressure and σ 0 ’ theeffective stress, the required spacing between stonecolumns is calculated for given column diameterd col .Here, we set r g = 0.6 and selected d col . = 0.60 m,yielding for a square grid the required minimumcenter to center spacing between columnss = 1.8 m (7)RIVISTA ITALIANA DI GEOTECNICA
SEISMIC DESIGN OF THE FOUNDATION OF AN IMMERSED TUBE TUNNEL IN LIQUEFIABLE SOIL47The grading of the stone column material is selectedso as to satisfy two requirements: i) differencein permeability of the drain material and the surroundingsoil should be large enough to permit ahydraulic gradient, and ii) particle sizes of the drainmaterial should be small enough to prevent clogging.Usually, in geotechnical practice the criteriasuggested by Terzaghi are applied, i.e.D 15 / d 15 > 4 and D 15 / d 85 < 5 (8)where D and d refer to grain diameter of the filtermaterial and the natural soil, respectively. However,the application of these criteria would lead to a nonpracticablesolution. Laboratory tests in Japan indicatethat for dynamic loading a coarser drainagematerial is needed to guarantee effective permeabilityand a less restrictive lower limit for clogging maybe applied. The corresponding design equationsuggested by SAITO et al. [1987] is20⇒d 15 < D 15 < 9⇒d 85 (9)and was adopted for the design.The resulting grain size distribution of the stonecolumn material is given in Figure 5 together with atypical curve for the liquefiable loose silty sand.A total of 8782 columns of 60 cm diameter havebeen installed using the wet displacement method.The procedure has been performed for the marinesection, as well as for most of the land based cutand-covertunnels. The marine stone columns havebeen installed in the dredged trench at sea from abarge equipped with a crane. Nominal length ofstone columns was 15 m, i.e. the maximum installationdepth was 42 m below sea level.Site response analysis for the improved soilFor the seismic site response analysis of the improvedsoil a composite soil consisting of stone columnsand natural soil was used. The stiffness of thiscomposite system was determined by applying theconcept of stress concentration. The simplifiedanalysis suggested by PRIEBE [1995] was adopted.The method was developed primarily for static conditions,but was applied here also for dynamic loadingby using the respective soil parameters properlyadjusted to account for the nonlinearity of soil behaviour.The effect of stone column placement is expressedin terms of an improvement factor n that isdefined as the ratio between the moduli of the compositeimproved soil and the natural unimprovedsoil. It is determined by considering the grid geometryand the compressibility of the stone columnmaterial: The effects of the overburden and of thefoundation width have been neglected. For detailsFig. 5 – Grain-size distribution of the stone column materialand of the liquefiable sandy soil.Fig. 5 – Curve granulometriche della ghiaia che caratterizza lecolonne e della sabbia liquefacibile.the reader is referred to the o<strong>rig</strong>inal publication.Dynamic shear modulus values for the gravel materialhave been derived from the data summarized byISHIHARA [1992]. The different behaviour of graveland natural soil material with respect to shear modulusreduction with increasing shear strain has beenconsidered by means of an approximate averagingprocedure. For BH8, for example, the strain leveladjusted modulus of the gravel was selected equal to3 times the respective value of the natural soil surroundingthe columns.Application of the method by Priebe at the locationof BH8 yielded for the top silty sand layer thathas been improved by stone columns an improvementfactor n=1.3. At the other locations the improvementfactor varied slightly ranging between1.54 for the organic soft top layers at Preveza side to1.2 for the top foundation layers at the locations inthe center of the strait.Following Priebe’s suggestion, the reciprocalvalue of the improvement factor p soil / p = 1 / n,where p is total overburden pressure and p soil the remainingstress on the soil between the columns, maybe used for estimating the remaining liquefactionpotential. The cyclic stress ratio developed in thefield by the earthquake multiplied by this stress reductionfactor yields an approximation for the expectedcyclic stress ratio in the natural soil betweenthe stone columns. In the present case, this beneficialeffect was not considered in the design being regardedas an additional safety factor.The site response analysis has been performedusing SHAKE91 and followed the same lines as forthe unimproved soil. In order to cover the uncertaintiesassociated with the approximate homogenisationprocedure for the composite soil outlinedabove, a variation of shear modulus and dampingwas included in the analysis: Response spectra havebeen computed by considering four profiles at eachOTTOBRE - DICEMBRE 20<strong>04</strong>
48 VRETTOS - SAVIDISlocation: i) basic profile, ii) basic profile with 20%higher G max for all layers, iii) basic profile but withshear modulus reduction and damping relationshipsfrom table II, iv) like profile iii) but with 20% higherG max . At each frequency the maximum value of theresponse from all profiles considered was taken toconstruct an envelope curve that was used in the subsequent3D-structural analyses of the tunnel. Typicalresults at two locations are given in Figure 6.Soil-structure interactionFor the analysis of the global tunnel responsevalues of the modulus of subgrade reaction are required.They describe the essential features of thesoil-tunnel-interaction. For the derivation of thesespring coefficients there is no consensus among designengineers. The method followed in the projectis based on a quasi-static analysis and considers inan approximate manner the relevant parameters,i.e. geometry of the foundation, embedment depth,and non-linear effects of soil-structure interaction.Numerical values of the modulus of subgradereaction were determined for a <strong>rig</strong>id single tunnelelement with aspect ratio 5:1 (short elements) and10:1 (long elements). Perfect bonding between plate(tunnel) and foundation soil, and linear-elastic theoryare assumed. The shear modulus of the foundationsoil is taken equal to the one determined fromthe equivalent nonlinear free-field seismic site responseanalysis of the soil deposit, i.e. it is a reducedshear modulus including the effects of cyclic loading.With these values the modulus of subgrade reactionis determined first for a surface foundation.The effects of tunnel embedment are then takenFig. 6 – Envelope curve of response spectra for 5% structuraldamping at locations BH8 and BH12.Fig. 6 – Curve inviluppo dello spettro di risposta nelle sezioniBH8 e BH12 ottenuto con uno smorzamento strutturale del 5%.into account that lead to an increase of the values ofsubgrade reaction. An additional increase is associatedwith the assumption made that the shear modulusdegradation of the soil underneath the tunnelwill be smaller than under free-field conditions dueto the effects of the tunnel-soil interaction.The equation for the spring constant per unittunnel length reads:k = α ·G (10)The factor α is composed of three terms:α = α 0 · α 1 · α 2 (11)where α 0 represents the response of the surfacefoundation, the factor α 1 reflects the effect of embedment,and α 2 the effect of reduced seismic strainamplitude of the near surface ground due to thepresence of the tunnel. All three factors depend onthe depth variation of the effective strain compatibleshear modulus, on the geometry of the foundation,and on the vibration mode.The approximate formulas given by GAZETAS[1991], and PAIS and KAUSEL [1988] are used to determinenumerical values for the static stiffness ofthe rectangular plate, i.e. α 0 and α 1 . For the calculationof the embedment factor the actual sidewall-soilcontact surface is used, which in the case of tunnelconsists only of the two sidewalls of the tunnel elements.The embedment depth is taken equal to theheight of the tunnel elements.The parameter α 2 accounting for the effect ofreduced strain amplitude due to soil-tunnel interactionis set equal to 1.2 for horizontal motions whilein the vertical direction due to the lower level of theseismic excitation the degradation of shear moduluswill be considerably smaller justifying a factor α 2equal to 1.45.The region of soil underneath the foundationwhich participates in the tunnel-soil interaction,and consequently the value of the mean effectiveshear modulus G in that region, depends on the vibrationmode. The corresponding values are determinedat each location along the tunnel axis from astatic analysis of the soil-structure interaction problemconsidering the actual distribution of the straincompatible shear modulus as determined from thenon-linear seismic site response analysis. Amongthe four soil profiles investigated at each locationthe one yielding the highest response spectrum wasused for computing the effective shear modulus.The Poisson’s ratio was taken equal to 0.45 to simulatesaturated soil.The application of the method described aboveis demonstrated next for the long tunnel elementswith dimensions 2L x 2B, L / B=10, and B=12.5 m.First, we compute the static stiffness value per unittunnel length for a surface <strong>rig</strong>id foundation: In theRIVISTA ITALIANA DI GEOTECNICA
SEISMIC DESIGN OF THE FOUNDATION OF AN IMMERSED TUBE TUNNEL IN LIQUEFIABLE SOIL49longitudinal direction we obtain k x,surf =α 0 G withα 0 =1.22. The stiffness increase due to embedmentis given by α 1 =1.66. With α 2 =1.2 we obtain k x =α Gwith α=2.44. In the transverse horizontal directionwe have α 0 =1.52, α 1 =1.66, α 2 =1.2 and α=3.03while in the vertical direction α 0 =1.52, α 1 =1.66 andα 2 =1.45 yield α=3.57. The value for the longitudinalspring compares well with the suggestion byCLOUGH and PENZIEN [1993] to use k x =3·G.Depending on the strongly inhomogeneous soilstratigraphy typical values for the longitudinalspring coefficient k x ranged between 30 and 210MN/m/m. The calculated values were regarded asbest estimates, and a variation of ± 30% was suggestedfor the structural design.A different method for calculating the springcoefficients is based on the proposal by ST. JOHN andZAHRAH [1987] whereby the longitudinal spring isdetermined from elastic continuum theory in dependenceon the wavelength of the shear wave travellingin the soil deposit. The latter may be estimatedfrom the predominant natural period of thesoil deposit. An alternative would be to set this wavelengthequal to the harmonic mean of the shearwave lengths in the surface and base layer in a twolayer system consisting of a soft layer over a stifferbase, MATSUBARA et al. [1995]. However, this methodis very sensitive to the value of the wave length andwas used only for verification purposes.MonitoringA structural and seismic monitoring system hasbeen installed after completion of works in 2002 toobserve ambient static and dynamic loads includingseismic activity. Three triaxial force-balanced accelerometersare placed on the immersed tunnel structureand one in the free field at the Preveza shore.In addition forty-four linear variable displacementtransducers (LVDT) are mounted at the elementstunnel joints.On August 14, 2003 a magnitude 6.4 earthquakestruck close to the island of Lefkada in the IonianSea. The epicenter was located about 25 kmsouth-west of the site. Records obtained on the tunnelare presently analysed. No damage to the tunnelstructure was observed.AcknowledgementThe geological study and the geotechnical investigationshave been carried out by EdafomichanikiLtd., Athens. Dynamic laboratory tests have beencarried out by Fugro Ltd. and by the GeotechnicalInstitute of the TU Berlin under the supervision ofthe authors. The seismological study has been performedby J. Drakopoulos and G.N. Stavrakakisfrom the Institute of Geodynamics at the NationalObservatory in Athens. Installation of stone columnshas been carried out by the Joint Venture incooperation with Pennine Vibropiling Ltd, England.The tunnel monitoring system was installed byGeoSIG, Switzerland.ReferencesCLOUGH R.W. & PENZIEN J. (1993) – Dynamics of Structures.McGraw-Hill, Inc.FINN W.D.L. (1992) – Evaluation of liquefaction potential.Soil Dynamics and Geotechnical EarthquakeEngineering, (P. SECO e PINTO, Ed.) Balkema,Rotterdam, pp. 127-157.GAZETAS G. (1991) – Foundation Vibrations. FoundationEngineering Hand<strong>book</strong>, (H.-Y. FANG, Ed.),Van Nostrand Reinhold, pp. 553-593.HARDIN B.O. (1978) – The nature of stress-strain behaviourof soils. Proc. ASCE Spec. Conf. on Earthq.Eng. Soil Dyn., Pasadena, vol. I, pp. 3-90.IDRISS I.M. and SUN J.I. (1991) – SHAKE91. A ComputerProgram for Conducting Equivalent NonlinearResponse Analysis of Horizontally Layered Soil Deposits.University of California, Davis.ISHIHARA K. (1992) – Dynamic properties of soils andgravels from laboratory tests. Soil Dynamics andGeotechnical Earthquake Engineering, (SECO ePINTO, Ed.) Balkema, Rotterdam, pp. 1-17.IWASAKI Y.T. (1988) – In-situ seismic velocity and its relationshipwith soil characteristics in Osaka Bay.Earthquake Engineering and Soil Dynamics II –Recent Advances in Ground Motion Evaluation,ASCE, pp. 290-3<strong>04</strong>.LUNNE T. and CHRISTOFFERSEN H.P. (1983) – Interpretationof cone penetrometer data for offshore sands.Proc. 15th Annual OTC, Houston, vol. I, pp. 181-192.MATSUBARA K., HIRASAWA K. and URANO K. (1995) –On the wave length for seismic design of undergroundpipeline structures. Earthquake Geotechnical Engineering,(K. Ishihara, Ed.) Balkema, Rotterdam,pp. 587-590.PAIS A. and KAUSEL E. (1988) – Approximate formulas fordynamic stiffnesses of <strong>rig</strong>id foundations. Soil Dynamicsand Earthq. Engng, vol. VII, pp. 213-227.PRIEBE H.J. (1995) – The design of vibro replacement.Ground Engineering, Dec., pp. 31-37.ROBERTSON P.K. and FEAR C. (1995) – Liquefaction ofsands and its evaluation. Proc. First Int. Conf. onEarthquake Geotechnical Engineering, (K. ISHI-HARA, Ed.) Balkema, Rotterdam, pp. 1253-1289.ROBERTSON P.K. (1990) – Soil classification using theCone Penetration Test. Can. Geotech. J., vol.VXXVII, pp. 151-158.OTTOBRE - DICEMBRE 20<strong>04</strong>
50 VRETTOS - SAVIDISROBERTSON P.K., CAMPANELLA R.G. and WIGHTMAN A.(1983) – SPT-CPT correlations. J. Geotechn.Engng. ASCE, vol. CIX, pp. 1449-1459.SAITO A., TAGAWA K., TAMURA T., OISHI H., NAGAYAMAH. and SHIMAOKA H. (1987) – A countermeasure forsand liquefaction by gravel drains method. NipponKokan Technical Report Overseas, n. 51, pp. 46-52.SEED H.B. and BOOKER J.R. (1977) – Stabilization ofpotentially liquefiable sand deposits using graveldrains. J. Geotech. Engng. Div. ASCE, vol. CIII,pp. 757-768.SEED H.B., TOKIMATSU K., HARDER L.F. Jr. andCHUNG R.M. (1985) – Influence of SPT proceduresin soil liquefaction evaluations. J. Geotech. Engng.ASCE, vol. CXI, pp. 1425-1445.SEED H.B., WONG R.T., IDRISS I.M. and TOKIMATSU K.(1986) – Moduli and damping factors for dynamicanalyses of cohesionless soils. J. Geotech. Engng.ASCE, vol. CXII, pp. 1016-1032.SEED H.B. and IDRISS I.M. (1982) – Ground Motionsand Soil Liquefaction During Earthquakes. EarthquakeEngineering Research Institute Monograph.SEED R.B. and HARDER L.F. Jr. (1990) – SPT-basedanalysis of cyclic pore pressure generation and undrainedresidual strength. Proc. of the H. BoltonSeed Memorial Symposium, (J.M. Duncan, Ed.),vol. I, pp. 351-376.SKEMPTON A.W. (1986) – Standard penetartion test proceduresand the effects in sands of overburden, relativedensity, particle size, aging, and over-consolidation.Géotechnique, vol. XXXVI, pp. 425-447.ST. JOHN C.M. and ZAHRAH T.F. (1987) – Aseismic designof underground structures. Tunnelling and UndergroundSpace Technology, vol. II, n. 2, pp.165-197.VRETTOS C. and SAVIDIS S. (1999) – Shear modulus anddamping for Mediterranean clays of medium plasticity.Earthquake Geotechnical Engineering, (P. SECO ePINTO, Ed.), Balkema, Rotterdam, pp. 71-76.VUCETIC M. and DOBRY R. (1991) – Effects of soil plasticityon cyclic response. J. Geotech. Engng. ASCE,vol. CXVII, pp. 89-107.WEILER W.A. (1988) – Small strain shear modulus ofclay. Earthquake Engineering and Soil DynamicsII – Recent Advances in Ground Motion Evaluation,ASCE, pp. 331-345.Progettazione sismica di una galleriaposta all’interno di uno strato di terrenoliquefacibileSommarioLa strada, recentemente completata, che collega Preveza adAktio nel nord-ovest della costa greca ha previsto la realizzazionedi una galleria a canna singola passante sotto lo stretto e di duegallerie costruite a cielo aperto nelle due zone terminali. Il sito ècaratterizzato da un alto grado di sismicità. Lo strato di terrenoall’interno del quale è posta l’opera è costituito da sedimentimarini con sporadiche lenti sabbiose, limose e argillose che siestendono sino a grande profondità nella parte centrale dellostretto. Lungo tutto l’asse della galleria le sabbie limose e i limisabbiosi degli strati superficiali sono classificati comeliquefacibili. Sotto la fondazione del tunnel, per ridurre il rischiodi liquefazione, sono state realizzate colonne in ghiaia. Di seguitosono illustrati i risultati di un’attenta caratterizzazione delterreno ottenuta mediante un esteso programma di provesperimentali dinamiche e sono analizzati i parametri chedefiniscono l’input sismico. Le analisi sismiche di risposta localeeffettuate per definire la lunghezza delle colonne in ghiaia sonodiscusse brevemente. È presentata infine la progettazione di talicolonne così come il metodo per determinare i valori deicoefficienti di <strong>rig</strong>idezza delle molle simulanti l’interazionegalleria-terreno.RIVISTA ITALIANA DI GEOTECNICA