Multimode fibre laser Doppler anemometer with
Multimode fibre laser Doppler anemometer with
Multimode fibre laser Doppler anemometer with

You also want an ePaper? Increase the reach of your titles
YUMPU automatically turns print PDFs into web optimized ePapers that Google loves.
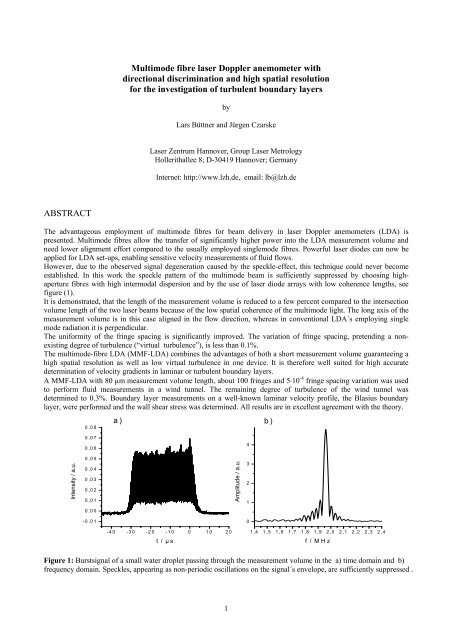
II. c) The speckle-effectIn contrast to a single mode <strong>fibre</strong> the crosssection of a beam emitted from a multimode<strong>fibre</strong> shows local intensity fluctuations, whichare known as speckles. The visibility of aspeckle pattern η Speckle can be defined in thesame way as the visibility of an interferencepattern (see section II.b).The mean size of the speckles depends on thenumber of guided modes [9]. Speckles arecaused by interference from all coherent guidedmodes in the <strong>fibre</strong>. Different path lengths arisefrom the modes propagating <strong>with</strong> differentangles to the core/cladding interface by totalreflection. The maximum path length differenceoccurs between the lowest and the highestpossible mode and is approximately given by[9]:L≈12⋅ L ⋅2DA N(4)reduction factor ξ / %987654321measurement pointshyperbolic fit00 50 100 150 200 250 300 350 400beam quality factor M 2Figure 4: Dependence of the reduction factor ξ on the beamquality factor M 2 .where L denotes the length and A N the numerical aperture of the <strong>fibre</strong>. This effect in multimode <strong>fibre</strong>s is known asmodal dispersion. In case of light <strong>with</strong> a high longitudinal coherence length l c =λ 0 2 /∆λ (λ 0 : centre wavelength, ∆λ: widthof the spectral line) the <strong>fibre</strong> output intensity profile is the result of a superposition of all guided modes underconsideration of their relative phase relations. The speckle visibility is then, of course, very high. In the <strong>fibre</strong> only thosemodes will interfere whose path length differences are shorter than the coherence length. All other modes will addincoherently and thereby reduce the visibility of the speckle pattern. Speckles introduce an additional parasitic noise onthe burst signal so that it is necessary to reduce the speckle visibility. From the preceding explanation, it follows that tothis end, long <strong>fibre</strong>s <strong>with</strong> high numerical apertures and light sources <strong>with</strong> short coherence lengths should be used.In order to measure the visibility of the speckle pattern the light of a <strong>laser</strong> diode array (wavelength λ= 807 nm,coherence length l c ≈ 513 µm) was coupled into three different <strong>fibre</strong>s. The light emitted from the <strong>fibre</strong> endface wasimaged <strong>with</strong> a Kepler telescope into free space in order to scan the beam profile. Small water droplets <strong>with</strong> diametersaround 1.5 µm acted as point-like scattering objects. To collect the stray light, a receiving unit consisting of a singlelens and a subsequent multimode <strong>fibre</strong> leading to an avalanche photo detector were placed tilted <strong>with</strong> respect to theoptical axis and directed towards the beam waist. Viewing the detector time signal on an oscilloscope, the specklevisibility η Speckle was evaluated by η Speckle = (I Max -I Min )/(I Max +I Min ), where I Max und I Min denote the maximum andminimum speckle intensities, respectivly. The estimated average speckle sizes were 2.8 µm and 1.2 µm for the A N =0.16 <strong>fibre</strong>s and the A N = 0.37, respectively.The measured speckle visibilities are summarised in the following table (L: fiber length, L D : calculated maximummodal dispersion, coherence length l c ≈ 513 µm):core-diameter/µm A N L / m L D / mm η Speckle / %200 0.16 5 26 15.4400 0.16 2 64 10.950 0.37 30 2053 5.6Table 1: Results of the measurements of the speckle visibilitiesAs expected, the speckle visibility can be reduced by increasing the modal dispersion. The modulation by the specklescan now be neglected compared to that caused by the fringe system. For a detailed investigation of the speckleinfluence we refer to [11].It is important to note, that a decrease of the longitudinal coherence length leads only to a reduction of the specklevisibility, but not to a reduction of the visibility of the fringe pattern. Though both effects arise from interference, theyare not dependent on one another because the speckle interference takes place <strong>with</strong>in one beam, i.e. the multimode<strong>fibre</strong>, whereas the fringe system in the centre of the intersection volume is caused by interference from both partialbeams generated by beam-splitting. In fact, even at very short coherence lengths the fringe system will show completemodulation, as long as only the path length difference of the two partial beams is shorter than the coherence length,5
which can easily be accomplished if a grating is used for beam-splitting. In contrast, due to the reasons mentionedabove the visibility of the speckle pattern will decrease continually as the coherence length of the light source reduces.This gets evident from experiment: A burst signal taken <strong>with</strong> a set-up described in Chapter III <strong>with</strong> water droplets ofapprox. 3 µm diameter is shown in fig. (1). The <strong>Doppler</strong> modulation is clearly evident. Speckles can be recognised assmall, non periodic oscillations on the signal. Since their modulation is significantly smaller than the modulationcaused by the fringes, they can be neglected. In the frequency spectrum a sharp, clear peak occurs, so that a precisedetermination of the <strong>Doppler</strong> frequency is still possible. Another characteristic of the MMF-LDA can be seen here:Envelopes of the burst signals are rectangular, whereas in the case of LDA´s employing single mode radiation they areGaussian. This is caused by the flat-top intensity profile of the multimode radiation. The <strong>fibre</strong> end face can be regardedas a homogenous shining object imaged through the optical system.III. Experimental set-up and characterisation of the measurement volumeThe experiments for the characterization and for the fluid flow measurements were carried out <strong>with</strong> an LDA-set-upmounted on an optical bench, see fig. (5). Light from a <strong>laser</strong> diode array (output power 700 mW at 810 nm) waslaunched by a lens system into a multimode <strong>fibre</strong> of step index type <strong>with</strong> 100 µm core diameter and 0.22 numericalaperture. The theoretical value of M 2 ≈43 was confirmed by a beam quality measurement of the emitted radiation. Forthe effect of umode scrambling, the <strong>fibre</strong> was plaited through a row of bolts (bend radii ≈1 cm, power loss
1000800PDFGaussian fit600counts40020008,05 8,10 8,15 8,20 8,25 8,30velocity v [m/s]Figure 9: Probability density function for turbulence analysis of the free wind tunnel stream.For the measurements of the Blasius boundary layer, a glass plate was placed in the centre of the test section. TheMMF-LDA was mounted on a motorized translation table in order to scan the velocity profile perpendicular to theplate. The receiving optics were placed in a forward scattering arrangement but approx. 20° inclined <strong>with</strong> respect to theplane of the partial beams so that reflexes of the glass plate had only a smaller influence. The optical power of 100 mWin the measurement volume was sufficient to produce burst signals from the avalanche photodetectors large enough foracquisition <strong>with</strong> a PC analogue-digital converter card. A LabView program controlled the table movement and thesignal processing. At each z-position, 20 valid burst signals were taken.Velocity profiles were taken at different positions, x, behind the leading edge of the glass plate and for different freestream velocities v ∞ . Fig. (10) shows the boundary layers for Reynolds numbers Re x = 5.8⋅10 3 , 2.3⋅10 4 , 5.8⋅10 4 , whereRe x is represented by xv ∞ /ν, <strong>with</strong> ν= 1.5⋅10 -5 m 2 /s as the kinematic viscosity of air. Since the Reynolds numbers aresignificantly smaller than 3.5⋅10 5 …1⋅10 6 , which is considered as the critical range for laminar to turbulent transition,laminar boundary layers were available. In order to compare the measured boundary layers <strong>with</strong> Blasius´ theory,normalised co-ordinates (v/v ∞ and η=z{v ∞ /(2νx)} ½ ) have been used. The theoretical solution f´=f´(η) was gained bysolving the Blasius equation f ´´´+f·f´= 0 (dash means differentiation by η) <strong>with</strong> the initial conditions f(0)=0, f´(0)=0and f´´(0)=0.4696 [16] <strong>with</strong> the mathematics program Maple. This solution has also been added to the plot, indicatingthe good agreement between theory and experiment.1,21,00,8v/v∞0,60,40,2Re x= 5.8*10 3Re x= 2.3*10 4Re x= 5.8*10 4Theoretical Blasius curve0,00 2 4 6 8ηFigure 10: Measured velocity profiles of boundary layer flows for different Reynolds numbers in normalisedco-ordinates v/v ∞ and η=z (v ∞ /(2νx)) ½ . A good agreement <strong>with</strong> the theoretical Blasius boundary layer occurs.9
For boundary layer measurements, special interest lies on the wall shear stress τ, since it determines directly the skinfriction drag of aerodynamic devices.With µ= 1.8⋅10 -6 Ns/m 2 as the kinematic viscosity of air the wall shear stress is defined as:τ =dvµdzz=0if the object is located at z=0. From the measured profiles the wall shear stress τ was evaluated from the slope of alinear regression in the ascending part of the curves. For a fixed position x= 51 mm behind the leading edge and variiedfree stream velocity v ∞ results are plotted in fig. (11). For a comparison, the theoretical function was also calculated:The local wall shear stress for a laminar boundary layer is τ= 0.332µ(v ∞ 3 /(νx)) ½ , [16]. This function was also added tothe plot and indicates again the good agreement between experiment and theory. Consequently, the presented sensor iswell suited for measurements of shear flows.0,20wall shear stress τ [N/m 2 ]0,180,160,140,120,100,080,060,04experimenttheory0,020,000 1 2 3 4 5 6 7 8 9free stream velocity v ∞[m/s]Figure 11: Wall shear stress τ measured 51 mm behind the leading edge of the glass platefor different free stream velocities v ∞ .10
VI. ConclusionIn this contribution the employment of multimode <strong>fibre</strong>s for beam delivery in <strong>laser</strong>-<strong>Doppler</strong>-<strong>anemometer</strong>s waspresented.The advantages of the mulitmode-<strong>fibre</strong> <strong>laser</strong>-<strong>Doppler</strong>-<strong>anemometer</strong>s (MMF-LDA) can be summarised as follows:- High-power and low-cost diode <strong>laser</strong>s can be employed- Only low alignment effort is needed for coupling into multimode-<strong>fibre</strong>s.- Short measurement volumes for high spatial resolution can be generated due to the low degree of spatial coherence- A low variation of fringe spacing, i.e. “virtual turbulence”- Directional discrimination can be attained by homodyne technique <strong>with</strong>out using active frequency shift elements.It was demonstrated that due to the low degree of spatial coherence of the multimode-radiation, the length of themeasurement volume can be reduced drastically <strong>with</strong> regard to the length of the intersection volume.The presented principle is due to small measurement volume lengths capable of measuring velocity gradients <strong>with</strong> highspatial resolution. The length of the measurement volume decreases relative to the length of the intersection volume<strong>with</strong> the beam quality, characterised by the beam quality factor M 2 . An M 2 -value of 150 leads to a measurementvolume having only ≈1% of the length of the intersection volume.It turns out that the variation of the fringe spacing <strong>with</strong>in the measurement volume cannot be described <strong>with</strong> theGaussian-beam model, which is adequate in single-mode beams. Due to the flat top intensity profile the burst signals ofparticles passing through the measurement volume show rectangular envelopes.It was demonstrated how the disturbing speckle effect, as it arises from multimode <strong>fibre</strong>s, can be reduced belowvisibilities of 6%. The remaining speckle visibility can be neglected so that a precise <strong>Doppler</strong> frequency estimation isstill possible. It was shown that the speckle effect and the interference fringe system are affected independently fromeach other, so that a fringe system <strong>with</strong> full modulation but <strong>with</strong> a low speckle visibility can be accomplished.Directional discrimination can be attained using the two-wavelength homodyne-technique. It was shown that a bichromaticmeasurement volume can be realised <strong>with</strong> a constant fringe spacing shift of π/2. Passing particles generatesine/cosine burst signal pairs, whose phase shift contain information about the direction.Fluid flow measurements were carried out <strong>with</strong> a measurement volume of 80 µm length, 100 mW available <strong>laser</strong>power, 100 fringes and fringe spacing variation of 5⋅10 -4 . Blasius boundary layers at a glass plate as well as wall shearstress were measured and compared <strong>with</strong> theory. An excellent agreement confirms the function of the sensor.As a result, a powerful, easy to adjust <strong>laser</strong> <strong>Doppler</strong> <strong>anemometer</strong> can be accomplished by the employment of highpower,low-cost diode <strong>laser</strong>s and multimode-<strong>fibre</strong>s. The multimode-<strong>fibre</strong> <strong>laser</strong> <strong>Doppler</strong> <strong>anemometer</strong> (MMF-LDA)combines the advantages of both a short measurement volume of a few ten µm guaranteeing a high spatial resolution aswell as low virtual turbulence of less than 0.1% in one device. It is therefore well suited for the measurement of shearflows.AcknowledgementsThe authors would like to thank T. Razik for developing the LabVIEW-programs, M. Boivin for his professional work<strong>with</strong> the experiments, A. Isemann for the assignment of the Polaroid <strong>laser</strong>-diode array and Dr. P. Regenfuß and D.Leong for proof-reading this paper.Thanks are due to Dr. H. Müller (PTB/Braunschweig) for making possible the LDA calibration.The support from E.-S. Zanoun, Dr. S. Becker, H. Lienhart and Prof. Dr. F. Durst, all LSTM/Erlangen, for makingavailable the wind tunnel is greatly acknowledged.This work was funded by the Deutsche Forschungsgemeinschaft (DFG, FKz: Cz 55/4-4).11
References[1] E.-J. Nijhof, W.S.J. Uijttewaal, R.M. Heethaar, “Blood particle distributions accessed by microscopic <strong>laser</strong>-<strong>Doppler</strong>velocimetry”, SPIE Vol. 2052 p. 675, Laser Anemometry Advances and Applications, p.187, 1993[2] P. Miles, P. Witze, "Evaluation of the Gaussian beam model for prediction of LDV fringe fields", 8 th InternationalSymposium on Applications of <strong>laser</strong> techniques to fluid mechanics, paper 40.1, Lisbon/Portugal 1996[3] S.L. Kaufmann, L.M. Fingerson, “Fiber Optics in LDV Applications”, on the International Conference on LaserAnemometry – Advances and Applications, 16 th –18 th Dec. 1985, Manchester/UK[4] B. Ruck, F. Durst, “Laser-<strong>Doppler</strong>-Anemometer auf der Basis von Gradientenfasern”, Heft 6, pp. 243-249,Technisches Messen 1983[5] S. Bopp, C. Tropea, L. Zhan, “The use of graded-index fibers in fiber-optic <strong>laser</strong>-<strong>Doppler</strong> anemometry probes”,Rev. Sci. Instrum. 60(10), Oct. 1989[6] M. Haag, M. Brandner, "Diode <strong>laser</strong>s - an innovative tool for production", p. 36, LaserOpto 03/2000[7] D.P. Hand, J.D. Entwistle, R.R.J. Maler, A. Kuhn, C. A. Greated, J.D.C. Jones, “Fibre optic beam delivery systemfor high peak power <strong>laser</strong> PIV illumination”, Meas. Sci. Technol, Vol. 10, pp. 239-245, 1999[8] D. Su, A.A.P. Boechat, J.D.C. Jones, “Beam delivery by large-core fibers: effect of launching conditions on nearfieldoutput profile”, Applied Optics, Vol. 31, No. 27, p. 5816, 1992[9] R.D. Morgan, D.J. Anderson, J.D.C. Jones, W. Easson, C. Greated, “Design of <strong>fibre</strong> optic beam delivery system for particle image velocimetry”, SPIE Vol. 2052 p. 675, Laser Anemometry Advances and Applications 1993[10] N. Takai, T. Asakura, “Statistical properties of <strong>laser</strong> speckles produced under illumination from a multimodeoptical <strong>fibre</strong>”, J. Opt. Soc. Am. A, Vol.2, No.8, p.1282, Aug. 1985[11] L. Buettner and J. Czarske, “A multimode-<strong>fibre</strong> <strong>laser</strong>-<strong>Doppler</strong> <strong>anemometer</strong> for highly spatially resolved velocitymeasurements using low-coherence light”, Meas. Sci. Technol. 12, pp. 1891-1903, 2001[12] H. Mueller, R. Kramer, V. Strunck, B. Mickan, D. Dopheide, “Laser-<strong>Doppler</strong>-Anemometer zur Darstellung undWeitergabe der Einheit Strömungsgeschwindigkeit”, 9 th conference “Lasermethoden in der Strömungsmeßtechnik”, pp.24.1-24.8, Winterthur/Switzerland, 18.-20.09.2001[13] L. Buettner, J. Czarske, C. Fallnich, "Diodengepumpte Faser<strong>laser</strong> in achromatischen LDA-Systemen mitRichtungserkennung und Mehrpunktmessung", 8 th conference "Lasermethoden in der Strömungsmeßtechnik", paper 8,Munich/Germany 2000[14] F. Durst, E.-S. Zanoun, M. Pashtrapanska, “In situ calibration of hot wires close to highly heat-conducting walls”,Experiments in Fluids Vol. 31, pp. 103-110, 2001[15] M. Fischer, J. Jovanovic and F. Durst, “Reynolds number effects in the near-wall region of turbulent channelflows”, Physics of Fluids Vol. 13, No. 6, pp. 1755-1767, June 2001[16] H. Schlichting, „Boundary layer theory“, McGraw-Hill, New York/USA 198712