
You also want an ePaper? Increase the reach of your titles
YUMPU automatically turns print PDFs into web optimized ePapers that Google loves.
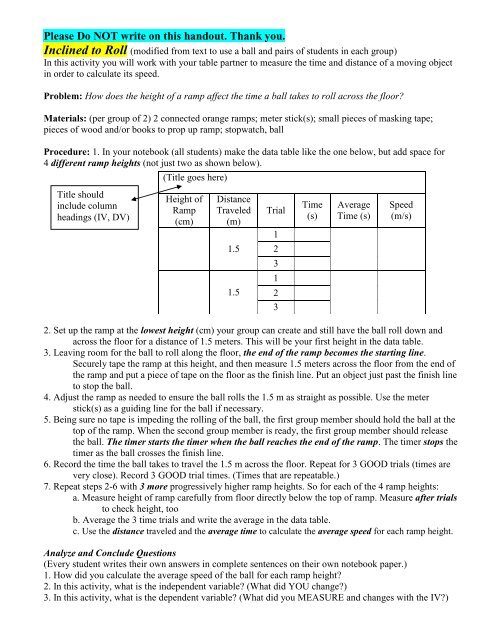
Please Do NOT write on this handout. Thank you.<strong>Inclined</strong> <strong>to</strong> <strong>Roll</strong> (modified from text <strong>to</strong> use a ball and pairs of students in each group)In this activity you will work with your table partner <strong>to</strong> measure the time and distance of a moving objectin order <strong>to</strong> calculate its speed.Problem: How does the height of a ramp affect the time a ball takes <strong>to</strong> roll across the floor?Materials: (per group of 2) 2 connected orange ramps; meter stick(s); small pieces of masking tape;pieces of wood and/or books <strong>to</strong> prop up ramp; s<strong>to</strong>pwatch, ballProcedure: 1. In your notebook (all students) make the data table like the one below, but add space for4 different ramp heights (not just two as shown below).(Title goes here)Title shouldinclude columnheadings (IV, DV)Height ofRamp(cm)DistanceTraveled(m)Trial1Time(s)AverageTime (s)Speed(m/s)1.52311.5232. Set up the ramp at the lowest height (cm) your group can create and still have the ball roll down andacross the floor for a distance of 1.5 meters. This will be your first height in the data table.3. Leaving room for the ball <strong>to</strong> roll along the floor, the end of the ramp becomes the starting line.Securely tape the ramp at this height, and then measure 1.5 meters across the floor from the end ofthe ramp and put a piece of tape on the floor as the finish line. Put an object just past the finish line<strong>to</strong> s<strong>to</strong>p the ball.4. Adjust the ramp as needed <strong>to</strong> ensure the ball rolls the 1.5 m as straight as possible. Use the meterstick(s) as a guiding line for the ball if necessary.5. Being sure no tape is impeding the rolling of the ball, the first group member should hold the ball at the<strong>to</strong>p of the ramp. When the second group member is ready, the first group member should releasethe ball. The timer starts the timer when the ball reaches the end of the ramp. The timer s<strong>to</strong>ps thetimer as the ball crosses the finish line.6. Record the time the ball takes <strong>to</strong> travel the 1.5 m across the floor. Repeat for 3 GOOD trials (times arevery close). Record 3 GOOD trial times. (Times that are repeatable.)7. Repeat steps 2-6 with 3 more progressively higher ramp heights. So for each of the 4 ramp heights:a. Measure height of ramp carefully from floor directly below the <strong>to</strong>p of ramp. Measure after trials<strong>to</strong> check height, <strong>to</strong>ob. Average the 3 time trials and write the average in the data table.c. Use the distance traveled and the average time <strong>to</strong> calculate the average speed for each ramp height.Analyze and Conclude Questions(Every student writes their own answers in complete sentences on their own notebook paper.)1. How did you calculate the average speed of the ball for each ramp height?2. In this activity, what is the independent variable? (What did YOU change?)3. In this activity, what is the dependent variable? (What did you MEASURE and changes with the IV?)
4. In this activity, what NUMBERS & UNITS did you use <strong>to</strong> calculate speed?5. Create a one labeled and colored diagram of your ramp set-up. Use 2-headed ( ) arrows <strong>to</strong>show: height of ramp and distance traveled across floor.6. Create 2 graphs: a. Graph the height (x-axis) vs. the average time <strong>to</strong> travel (y-axis)…..and b. Graph the height (x-axis) vs. the calculated speed (y-axis)USING the Requirements for Data Tables and Graphs handout. These graphs may be onthe same piece of graph paper (front and back). So for these 2 graphs:• Be sure <strong>to</strong> USE a ruler for both axis lines.• Be sure <strong>to</strong> number both axis lines evenly.• Be sure <strong>to</strong> add labels and units of measurement <strong>to</strong> both axis lines.• Be sure <strong>to</strong> graph dots correctly and connect the dots.• Be sure <strong>to</strong> add a title that includes both axis line labels.7. What is the relationship between height of the ramp and time the ball takes <strong>to</strong> travel 1.5 meters?(Begin your answer this way: “As the height of the ramp increases, the time of ..... )8. What data do you have <strong>to</strong> support your answer <strong>to</strong> #7?9. What is the relationship between the height of the ramp and the speed at which the ball travels 1.5 macross the floor? (Begin your answer: “As the height of the ramp increases, the speed of ... )10. What data do you have <strong>to</strong> support your answer <strong>to</strong> #9?11. What is your control for this experiment?(HINT: You DON’T have a zero value for your independent variable, so you’ll need <strong>to</strong> pick one of theIVs…. So pick your lowest ramp height, because you are comparing all the other higher ramp heights <strong>to</strong>this lowest one <strong>to</strong> know how increasing the ramp height affects the time and speed of the ball <strong>to</strong> travel.)12. List AT LEAST 5 of the MOST IMPORTANTS constants you and your partner used or SHOULDHAVE used for this experiment.13. Please assess the performance of your partner by copying the sentence below in your notebook andon your notebook paper circle the appropriate number.My partner was 1 2 3 4 5 during this activity.(1 is uncooperative and unhelpful; 5 is extremely cooperative and extremely helpful)REMEMBER, please DO NOT write on this handout. Thank you.