Rca1948FrequencyModu.. - The New Jersey Antique Radio Club
Rca1948FrequencyModu.. - The New Jersey Antique Radio Club
Rca1948FrequencyModu.. - The New Jersey Antique Radio Club

Create successful ePaper yourself
Turn your PDF publications into a flip-book with our unique Google optimized e-Paper software.
FREQUENCY MODULATIONVolume IEdited byALFRED N. GOLDSMITHARTHUR F. VAN DYCKROBERT S. BURNAPEDWARD T. DICKEYGEORGE M. K. BAKERJANUARY, 1948Published byRCA REVIEWRADIO CORPORATION OF AMERICARCA LABORATORIES DIVISIONPrinceton, <strong>New</strong> <strong>Jersey</strong>
Copyright, 1948, by<strong>Radio</strong> Corporation of America,RCA Laboratories DivisionPrinted is U.S.A.
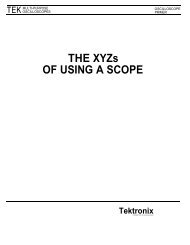
1000-3000 watt FM transmitter—1947Table-model AM-FM receiver—1947
FREQUENCY MODULATION, Vol.PREFACEFEEQUENCY MODULATION, Volume I is the seventh volumein the RCA Technical Book Series and the first on the subject of FM.Previous volumes have included material on television, radio facsimile,and ultra-high-frequency radio.-X- * * -X- *<strong>The</strong> papers in this volume cover the period 1936-1947 and are presentedin four sections : general, transmission, reception, and miscellaneous.Each section includes papers reprinted in full and severalreproduced in summary form only, with appropriate original publicationdata indicated in each case. As additional sources of reference,Appendix I includes a frequency modulation bibliography and AppendixII lists papers dealing with frequency modulation station placementand fieldsurvey techniques.* * # # #RCA REVIEW gratefully acknowledges the courtesy of theIInstituteof <strong>Radio</strong> Engineers (Proc. I.R.E.), the McGraw-Hill PublishingCompany, Inc.(Electronics), the Society of Motion Picture Engineers(Jour. Soc. Mot. Pic. Eng.), the Bryan-Davis Publishing Company(Communications) , and FM and Television in granting to RCAREVIEW permission to republish material which has appeared intheir publications. <strong>The</strong> appreciation of RCA REVIEW is also extendedto all authors whose papers appear herein.*****FREQUENCY MODULATION, Volume I is being published forscientists, engineers and others interested in frequency modulation,with the sincere hope that the material here assembled may help tospeed developments and enable frequency modulation to find its trueplace among companion arts and services.RCA Laboratories,Princeton, N. J.December 15, 1947<strong>The</strong> Manager, RCA REVIEW
:FREQUENCY MODULATIONVolume ICONTENTSPAGEFrontispiece — v —Preface<strong>The</strong> Manager, RCA REVIEW —vii—GeneralFrequency Modulation Noise Characteristics M. G. Crosby 1Frequency Modulation S. W. Seeley 44Band Width and Readability in FM M. G. Crosby 57Variation of Bandwidth with Modulation Index in Frequency ModulationM. S. CORRINGTON 65Summary:Generalized <strong>The</strong>ory of Multitone Amplitude and Frequency ModulationL. J. Giacoletto 84TransmissionFrequency Modulation Propagation Characteristics M. G. Crosby 85A Cathode-Ray Frequency Modulation Generator R. E. Shelby 101NBC Frequency-Modulation Field Test. . .R. F. Guy and R. M. Morris 111Generation and Detection of Frequency-Modulated WavesS. W. Seeley, C. N. Kimball and A. A. Barco 147A <strong>New</strong> Exciter Unit for Frequency-Modulated TransmittersN. J. Oman 165A Pretuned Turnstile Antenna G. H. Brown and J. Epstein 178Characteristics of the Pylon FM Antenna R. F. Holtz 194SummariesReactance-Tube Frequency Modulators M. G. Crosby 202A Transmitter for Frequency Modulated Broadcast Service Using a<strong>New</strong> Ultra-High-Frequency Tetrode. A. K. Wing and J. E. Young 202Drift Analysis of the Crosby Frequency-Modulated Transmitter CircuitE. S. Winlund 203Antennas for F-M Stations J. P. TAYLOR 203F-M Audio Measurements with an A-M Receiver R. J. <strong>New</strong>man 204A Square Loop F-M Antenna J. P. Taylor 204Audio Frequency Response and Distortion Measuring Techniques forF-M Transmitting Systems R. J. <strong>New</strong>man 205F-M Antenna Coupler J. P. Taylor 205Isolation Methods for F-M Antennas Mounted on A-M TowersR. F. Holtz 206Slot Antennas N. E. Lindenblad 206Reception<strong>The</strong> Service Range of Frequency Modulation M. G. Crosby 207Impulse Noise in F-M Reception V. D. Landon 230
:—.CONTENTS (Continued)PAGEIntermediate-Frequency Values for Frequency-Modulated-Wave ReceiversD. E. Foster and J. A. Rankin 245A Frequency-Dividing Locked-in Oscillator Frequency-Modulation ReceiverG. L. Beers 257Frequency-Modulation Distortion Caused by Multipath TransmissionM. S. CORRINGTON 275Input Impedance of Several Receiving-Type Pentodes at FM and TelevisionFrequencies F. Mural 305Frequency Modulation Distortion Caused by Common- and Adjacent-Channel Interference M. S. Corrington 319<strong>The</strong> Ratio Detector S. W. Seeley and J. AviNS 358Summaries:<strong>The</strong> Development of a Frequency-Modulated Police Receiver for Ultra-High-Frequency Use H. E. Thomas 394Development of an Ultra Low Loss Transmission Line for TelevisionE. 0. Johnson 394Input Circuit Noise Calculations for F-M and Television Receivers. .W. J. Stolze 395MiscellaneousDuplex Transmission of Frequency-Modulated Sound and Facsimile. .M. Artzt and D. E. Foster 396Use of Subcarrier Frequency Modulation in Communication SystemsW. H. Bliss 410<strong>The</strong> Transmission of a Frequency-Modulated Wave Through a NetworkW. J. Frantz 419Push-Pull Frequency Modulated Circuit and Its Application to VibratorySystems A. Badmaieff 452Frequency Modulation and Control by Electron BeamsL. P. Smith and C. I. ShulMan 467SummariesCarrier and Side-Frequency Relations with Multi-Tone Frequency orPhase Modulation M. G. Crosby 502Some Recent Developments inRecord Reproducing SystemsG. L. Beers and C. M. Sinnett 502Frequency Modulation of Resistance-Capacitance OscillatorsM. Artzt 503An F-M Calibrator for Disc Recording Heads H. E. Roys 503Frequency-Modulation Mobile <strong>Radio</strong>telephone Services.. H. B. Martin 504A Frequency-Modulated Magnetron for Super-High-Frequencies ....G. R. Kilgore, C. I. Shulman, and J. Kurshan 504A 1-Kilowatt Frequency-Modulated Magnetron for 900 Megacycles. .. . . . J. S. Donal, Jr., R. R. Bush, C. L. Cuccia and H. G. Hegbar 505Appendix I — FREQUENCY MODULATION — A Bibliography ofTechnical Papers by RCA Authors, 1936-1947 507Appendix II—FM Station Placement and Field Survey TechniquesSummaries 513
FREQUENCY MODULATION NOISECHARACTERISTICS*!ByMurray G. CrosbyRCA Communications, Inc., Riverhead, L. I., <strong>New</strong> YorkSummary.— <strong>The</strong>ory and experimental data are given which show the improvementsin signal-noise ratio effected by frequency modulation over amplitude modulation.It is shown that above a certain carrier-noise ratio in the frequency modulationreceiver u-hich is called the "improvement threshold, " the frequency modulation signalnoiseratio is greater than the amplitude modulation signal-noise ratio by a factorequal to the product of a constant and lite deviation ratio (the deviation ratio is equalto the ratio between the maximum frequency deviation and the audio modulationband width). <strong>The</strong> constant depends upon the type of noise, being slightly greater forimpulse than for fluctuation noise. In frequency modulation systems with highdeviation ratios, a higher carrier level isrequired to reach the improvement thresholdthan is required in systems with loiv deviation ratios; this carrier level is higher forimpulse than for fluctuation noise. At carrier-noise ratios below the improvementthreshold, the peak signal-noise ratio characteristics of the frequency modulationreceiver are approximately the same as those of the amplitude modulation receiver,but the energy content of the frequency modulation noise is reduced.An effect which is called "frequency limiting" is pointed out in which the peakvalue of the noise is limited to a value not greater than the peak value of the signal.With impulse noise this phenomenon effects a noise suppression in a manner similarto that in the recent circuits for reducing impulse noise which is stronger than thecarrier in amplitude modulation reception.When the power gain obtainable in certain types of transmitters by the use offrequency modulation is taken into account, the frequency modulation improvementfactors are increased and the improvement threshold is lowered with respect to thecarrier-noise ratio existing in a reference amplitude modulation system.INIntroductionA previously published paper,1thepropagation characteristicsof frequency modulation were considered. Prior to, and duringthese propagation tests, signal-noise ratio improvements effectedby frequency modulation were observed. <strong>The</strong>se observations weremade at an early stage of the development work and were investigatedby experimental and theoretical methods.It is the purpose of this paper to consider that phase of the frequencymodulation development work by RCA Communications,* Decimal Classification: R630.3 X R270.f Reprinted from Proc. I.R.E., April, 1937.1Muvrav G. Crosby, "Frequency Modulation Propagation Characteristics,"Proc^ I.R.E., vol. 24, pp. 898-913; June, (1936).
2 FREQUENCY MODULATION, Volume IInc., in which the signal-noise characteristics of frequency modulationare studied <strong>The</strong> theory and experimental work consider the knownsystems of frequency modulation including that independently developedby E. H Armstrong. 2Table of SymbolsC = carrier peak voltage.C/N = theory: Ratio between peak voltage of carrierand instantaneouspeak voltage of the noise in the frequency modulationreceiver. Experiment: Ratio between, peak voltage ofcarrier and maximum instantaneous peak voltage of thenoise0/n = ratio between the peak voltage of the carrier and the peakvoltage of the noise component.C a/N a= carrier-noise ratio in the amplitude modulation receiver.F a = maximum audio frequency of modulation band.F c= carrier frequencyF d = peak frequency deviation due toFa* = peak frequency deviation of the noise.applied modulation.Fi = intermediate-frequency channel width.F m — modulation frequencyF n = frequency of noise resultant or component.Fd/F a = deviation ratio.K = slope filter conversion efficiency.M = modulation factor of the amplitude modulated carrier.M/ = modulation factor at the output of the ( sloping filter.M fn = modulation factor at the output of the sloping filter whennoise modulates the carrier.iV=instantaneous peak voltage of the noise.n = peak voltage of the noise component.N a= noise peak or root-mean-square voltage at amplitude modulationreceiver output.Nf = noise peak or root-mean-square voltage at frequency modulationreceiver output.p = 2*F m.S a = signal peak or root-mean-square voltage at amplitude modulationreceiver output.S/ = signal peak or root-mean-square voltage at frequency modulationreceiver ouput.CO = 2tF c .2Edwin H. Armstrong, "A method of reducing disturbances in radio signalingby a system of frequency modulation," Proc. I.R.E., vol. 24, pp. 689-740;May, (1936).
NOISE CHARACTERISTICS 3w na - (u— u n ) =2w(F c— F n ) =2TF na .Z = C/n+n/C.(t) = phase variation of noise resultant as a function of time.<strong>The</strong>oryIn the following analysis, frequency modulation is studied by comparingit with the familiar system of amplitude modulation. In orderto do this,the characteristics of frequency modulation reception areanalyzed so as to make possible the calculation of the signal-noise ratioimprovement effected by frequency modulation over amplitude modulationat various carrier-noise ratios. 3 <strong>The</strong> amplitude modulation standardof comparison consists of a double side-band system having thesame audio modulation band as the frequency modulation system andproducing the same carrier at the receiver. Differences in transmitterpower gain due to frequency modulation are then considered separately.<strong>The</strong> frequency modulation reception process is analyzed by first consideringthe components of the receiver and the manner in which theyconvert the frequency modulated signal, and noise spectrum into anoutput signal-noise ratio.<strong>The</strong> Frequency Modulation Receiver<strong>The</strong> customary circuit arrangement used for the reception offrequency modulation is shown in the block diagram of Fig. 1. <strong>The</strong>intermediate-frequency output of a superheterodyne receiver is fedthrough a limiter to a slope filter or conversion circuit which convertsVfcFAMR&.H EI DEIB-PI-FAMRLIMITER _ SLOPE -FILTERDETA-FAMP.Fig.1—Block diagram of a frequency modulation receiver.the frequency modulation into amplitude modulation. This amplitudemodulation is then detected in the conventional amplitude modulationmanner. <strong>The</strong> audio-frequency amplifier is designed to amplify onlythe modulation frequencies; hence it acts as a low-pass filter whichrejects noise frequencies higher than the maximum modulation frequency.3Throughout this paper, carrier-noise ratio will refer to the ratio measuredat the output of the intermediate-frequency channel. Signal-noise ratio will referto that measured at the output of the receiver and will depend upon the depthof modulation as well as upon the carrier strength.
4 FREQUENCY MODULATION, Volume I<strong>The</strong> purpose of the limiter is to remove unwanted amplitude modulationso that only the frequency modulation component of the signalwill be received. It may take the form of an overloaded amplifier tubewhose output cannot rise above a certain level regardless of the input.Care must also be exercised to insure that the output of the overloadedamplifier does not fall off as the input is increased since this wouldintroduce amplitude modulation of reverse phase, but of equally undesirablecharacter.<strong>The</strong> main requirement of the conversion circuit for converting thefrequency modulation into amplitude modulation is that it slope linearlyfrom a low value of output at one side of the intermediate-frequencychannel to a high value at the other side of the channel. To dothis, an off-tuned resonant circuit or a portion of the characteristic ofFig.FREQUENCy2— -»Ideal sloping filter characteristics.one of the many forms of wave filters may be utilized. <strong>The</strong> ideal slopefilter would be one which gave zero output at one side of the channel,an output of one voltage unit at carrier frequency, and an output oftwo units at the other side of the channel. Such a characteristic isgiven by the curve JOC of Fig. 2. From this curve it is easily seen thatif the frequency is swung between the limits F and F h about the meanfrequency F c ,the output of the filter will have an amplitude modulationfactor of unity. <strong>The</strong> modulation factor for a frequency deviation,F d , will be given byFi F "2FM*{= — = =(1)(F t- F c )(F c- F ) Fiwhere F (= intermediate-frequency channel width.When the converting filter departs from the ideal characteristic inthe manner of the filter of curve HGOE of Fig. 2, the modulation factorproduced by a given frequency deviation is reduced by a factor equal
NOISE CHARACTERISTICS 6to the ratio between the distances AG and AJ or BE and BC. A convenientterm for this reduction factor of the filter is "conversion efficiency"of the filter. Taking into account this conversion efficiency,the modulation factor for a frequency deviation F d becomesM f=—2KF d(2)where K = AG/AJ — BE/BC = conversion efficiency of the filter.A low conversion efficiency may be used as long as the degree oflimiting is high enough to reduce the amplitude modulation well belowthe level of the converted frequency modulation. This is true sincelowering the conversion efficiency reduces the output of the noise inthe same proportion as the signal as long as no amplitude modulationis present. Hence the signal-noise ratio is unimpaired and the only effectis a reduction of the audio gain by the factor K. If insufficientlimiting isapplied so that the output of the limiter contains appreciableamplitude modulation, a filter with a high conversion efficiency isdesirable so that the amplitude modulation noise will not become comparableto the frequency modulation noise and thereby increase theresultant noise.A push-pull, or "back-to-back" receiver may be arranged by providingtwo filters of opposite slope and separately detectin'g and combiningthe detected outputs in push-pull so as to combine the audiooutputs in phase. Another slope filter having a characteristic as shownby the dot-dash line DOP in Fig. 2 would then be required.A further type of receiver in which amplitude modulation is alsobalanced out may be arranged by making one of the slope filter circuitsof the above-mentioned back-to-back type of receiver a flat-top circuitfor the detection of amplitude modulation only. <strong>The</strong> sloping filterchannel then detects both frequency and amplitude modulation; theflat-top channel detects only amplitude modulation. When these twodetected outputs are combined in push-pull, the amplitude modulationis balanced out and the frequency modulation is received. This typeof detection, as well as that in which opposite slope filters are used, hasthe limitation that the balance is partially destroyed as modulation isapplied. However, if a limiter is used, the amplitude modulation issufficiently reduced before the energy reaches the- slope filters;consequently,for purposes of removing amplitude modulation, the balancingfeature is not a necessity.Noise Spectrum Analysis<strong>The</strong> first step in the procedure to be followed here in determiningthe noise characteristics of the frequency modulation receiver will be
6 FREQUENCY MODULATION, Volume 1to determine mathematically the fidelity with which the noise is transmittedfrom the radio-frequency branch, in which it originates, to themeasuring instrument as a function of frequency. To do this, the wavespresent at the receiver input will be assumed to be the frequencymodulated carrier and the spectrum of noise voltages. This wave andspectrum will be combined into a single resultant whose amplitude andphase are functions of the constants of the component waves. <strong>The</strong>resultant will then be "mathematically" passed through the limiter toremove the amplitude modulation. From a determination of the instantaneousfrequency of the resultant, the peak frequency deviationeffected by the noise will be found. A single noise component of arbitraryfrequency will then be substituted for the resultant of the noisespectrum, and the modulation factor at the output of the convertingfilter will be obtained. This noise component will then be varied infrequency to determine the over-alltransmission of the receiver interms of the modulation factor at the sloping filter output. <strong>The</strong> areaunder the curve representing the square of this over-all transmissionwill then be determined. By comparing this area with the correspondingarea for an amplitude modulation receiver under equivalent conditions,and taking into consideration the pass band of the intermediate- andaudio-frequency channels, a comparison will be obtained between theaverage noise powers, or the average root-mean-square noise voltagesfrom the two receivers. 4<strong>The</strong> peak voltage characteristics of the two receivers will be comparedfor fluctuation noise by a correlation of known crest factors withthe root-mean-square characteristics. (Crest factor = ratio betweenthe peak and root-mean-square voltages.) <strong>The</strong> peak voltage characteristicsof impulse noise will be determined by a separate considerationof the effect of the frequency modulation over-all transmissionsupon the peak voltage of this type of noise.After a comparison between the noise output voltages from thefrequency and amplitude modulation receivers has been obtained, therespective signal output voltages willbe taken into consideration sothat the improvement in signal-noise ratio may be determined.In the process of determining the over-all transmission of the noise,the frequency modulated wave may be expressed bye, = C sin {ut + {F d /Fm ) cos pt] (3)4Stuart Ballantine, "Fluctuation noise in radio receivers," Pboc. I.R.E.,vol. 18, pp. 1377-1387; August, (1930). In this paper, Ballantine shows that theaverage value of the square of the noise voltage "... is proportional to the areaunder the curve representing the square of the over-all transimpedance (or of thetransmission) from the radio-frequency branch in which the disturbance originatesto the measuring instrument "as a function of frequency . . . .
NOISE CHARACTERISTICS 7where C = carrier peak voltage, u = 2tF c , F c= carrier frequency,F d = applied frequency deviation, p = 2wF m , and Fm = modulationfrequency. <strong>The</strong> noise spectrum may be expressed by its resultant, 6e n = N sin (w n t + (t)) (4)where N = instantaneous peak voltage of the noise (a function of time).(t) takes into account the fact that the noise resultant is phase modulated,as would be the case with the resultant of a spectrum of manynoise voltages. co„ = 2xF„, F n = frequency of the noise resultant.<strong>The</strong> signal voltage given by (3) and the noise voltage given by (4)may be combined by vector addition to givee = A/C*+N 2 + 2CN cos i(u - Un)t- ,/>(()+— cos pt\sin < (co — u„)t — {t)-\ cosptFd \ Fsin wt-\— cos -pt+t&vr1-F m C ( F dl-cos < (w— u„)t — (t)-\ cosptN (.Fm.(5)When the resultant wave given by (5) is passed through the limiterin the frequency modulation receiver, the amplitude modulation isremoved. Hence the amplitude term is reduced to a constant and theonly part of consequence is the phase angle of the wave. <strong>The</strong> rate ofchange of this phase angle, or its first derivative, is the instantaneousfrequency of the wave. Taking the first derivative and dividing by 2xto change from radians per second to cycles per second gives( F d \sin {t)-\ cosptF dut-\ cos 2^+tan -1 v r m JF m C ( .F,hcos
8 FREQUENCY MODULATION, Volume Iin which o> na = (co — co„) = 2t(F c— F n ) = 2wF na.Equation (6) gives the instantaneous frequency of the resultantwave consisting of the signal wave and the noise resultant voltage.From this equation the signal and noise frequency deviations may beobtained. In order to determine the over-all transmission with respectto the various components in the noise spectrum, a single componentof noise, with constant amplitude and variable frequency, will besubstituted for the resultant noise voltage given by (4). This makesN equal to n, which is not a function of time, and {t) equal to zero.Making these changes in (6) givesS- r.-r.**»-(F na — F d sin pt)c;!— (7)Fi ,+ cos \w
•NOISE CHARACTERISTICS 9nF naF in = —-(10)When this value of frequency deviation is substituted in (1) to findthe modulation factor 6 of the energy at the output of the sloping filter,the following results:n 2FM„--X—na('»Equation (11) shows that the modulation factor of the noise is inverselyproportional to the carrier-noise ratio and directly proportionalto the ratio between the noise audio frequency and one half the intermediate-frequencychannel width. When this equation is plotted withthe noise audio frequency, F na , as a variable and the modulation factoras the ordinate, the audio spectrum obtained for the detector output islike that of the triangular spectrum OBA in Fig. 3. Such a spectrumwould be produced by varying F n through the range between the upperand lower cutoff frequencies of the intermediate-frequency channel.<strong>The</strong> noise amplitude would be greatest at a noise audio frequency equalto one half the intermediate-frequency channel width. At this noiseaudio frequency, the ratio 2 F na /Fj is equal to unity and the modulationfactor becomes equal to ?i/C. If the detector output is passedthrough an audio system having a cutoff frequency F a ,the maximumfrequency of the audio channel governs the maximum amplitude ofthe spectrum. <strong>The</strong> maximum amplitude of the detector output is thereforereduced by the ratio Fi/2:F a.This can be seen by a comparisonof the spectrum OBA for the detector output and the spectrum ODHfor the audio channel output.When the amplitude modulation reception process is analyzed witha carrier and noise spectrum present at the receiver input, the modulationfactor of the energy fed to the detector is found to be equal to thereciprocal of the carrier-noise ratio for all of the noise frequencies inthe spectrum. That is to say, the receiver transmission for amplitudemodulation will be constant for all of the frequencies in the spectrum.Normally the upper cutoff frequency of the audio amplifier is equal toone half the intermediate-frequency channel width (F a= Fi/2). Consequentlythe audio spectrum of the amplitude modulated noise fed to* <strong>The</strong> ideal filter is used in this case since the use of a filter with a low conversionefficiency would merely require the addition of audio gain to put thefrequency modulation receiver on an equivalent basis with the amplitude modulationreceiver. <strong>The</strong> audio gain necessary would be equal to the reciprocal of theconversion efficiency of the sloping filter.
10 FREQUENCY MODULATION, Volume Ithe detector will be the same as that at the receiver output and willbe as portrayed by the rectangle OCEH.<strong>The</strong> spectra of Fig. 3 show the manner in which the frequency modulationreceiver produces a greater signal-noise ratio than the amplitudemodulation receiver. <strong>The</strong> noise at the output of the detector ofthe frequency modulation receiver consists of frequencies which extendout to an audio frequency equal to one half the intermediate-frequencychannel width, and the amplitudes of these components are proportionalto their audio frequency. Hence in passing through the audiochannel the noise is reduced not only in range of frequencies, but alsoin amplitude. On the other hand, the components of the signal waveare properly disposed to produce detected signal frequencies whichfit into the audio channel. In the case of the amplitude modulationreceiver, the amplitude of the components at the output of the audioFig. 3—Amplitude and frequency modulation receiver noise spectra. OBA =frequency modulation detector output. ODH = frequency modulation receiveroutput. OCEH= amplitude modulation receiver output.channel is the same as that at the output of-the detector since the spectrumis rectangular. Thus the frequency modulation signal-noise ratiois greater than the amplitude modulation signal-noise ratio by a factorwhich depends upon the relative magnitudes of the spectra OCLEHand ODH. <strong>The</strong> magnitudes which are of concern are the root-meansquareand peak values of the voltage due to the spectra.Root-Mean-Square Noise Considerations<strong>The</strong> average noise power or average root-mean-square voltage ratiobetween the rectangular amplitude modulation spectrum OCEH andthe trangular frequency modulation spectrum ODH, of Fig. 3, may befound by a comparison of the squared-ordinate areas of the two spectra.Thus,W a _ area OCEH (ordinates) 2W, area ODH (ordinates) 2
NOISE CHARACTERISTICS 112G-)F1 aJ. {^ x T-) dF -\2Fj(12)where W a /W/ is the ratio between the amplitude modulation averagenoise power and the frequency modulation average noise power at thereceiver outputs. <strong>The</strong> root-mean-square noise voltage ratio will beN a /WZ - Fi— - (r-m-s fluctuation) = A/ — - = \/3 —-•N, V W f 2F a(13)Equation (13)gives the root-mean-square noise voltage ratio forequal carriers applied to the two receivers. <strong>The</strong> modulation factor ofthe frequency modulated signal due to the applied frequency deviation,F d , is, from (3), equal to 2F d /F { . <strong>The</strong> modulation factor of theamplitude modulated signal may be designated by M and has a maximumvalue of 1.0. Thus the ratio between the two signals will be givenbyS a FiM Fi— (peak or r-m-s values) = —— = (for M = 1.0). (14)Sf 2Fd 2FdDividing (13) by (14), to find the ratio between the signal-noise ratiosat the outputs of the two receivers, givesSt/Nf ,,_ F d——— (r-m-s values) = V3 —•Oa/NaF a(15)It is apparent that the ratio between the frequency deviation andthe audio channel, F d /F n , is an important factor in determining thesignal-noise ratio gain effected by frequency modulation. A convenientterm for this ratio is the "deviation ratio" and it will be designated assuch hereinafter.Equation (15) gives the factor by which the amplitude modulationroot-mean-square signal-noise ratio ismultiplied in order to find theequivalent frequency modulation signal-noise ratio. Since this factor isused so frequently hereinafter, it will be designated by the word "improvement."<strong>The</strong> improvement given by (15) has been developedunder the assumption of zero applied frequency deviation (no modulation)and a carrier which is strong compared to the noise. However, aswillbe shown later, as long as the carrier is strong compared to the
12 FREQUENCY MODULATION, Volume Inoise, this equation also holds true for the case where modulation ispresent.Peak Noise ConsiderationsIn the ultimate application of signal-noise ratios, peak voltages areof prime importance since it is the peak of the noise voltage whichseems to produce the annoyance. This is especially true in the caseof impulse noise such as ignition where the crest factor of the noisemay be very high. Thus the energy content of a short duration impulsemight be very small in comparison with the energy content of thesignal, but the peak voltage of the impulse might exceed the signal peakvoltage and become very annoying. <strong>The</strong> degree of this annoyancewould of course depend upon the type of service and will not be goneinto here. In view of this importance of peak noise considerations, thefinal judgment in the comparison between the systems of frequencyand amplitude modulation treated here will be based upon peak signalnoiseratios.When the peak voltage or current ratio of the frequency and amplitudemodulation spectra is to be determined, the characteristics of thedifferent types of noise must be taken into consideration. <strong>The</strong>re seemto be two general types of noise which require consideration. <strong>The</strong> firstof these is fluctuation noise, such as thermal agitation and shot effect,which is characterized by a random relation between the various frequenciesin the spectrum. <strong>The</strong> second is impulse noise, such as ignitionor any other type of noise having a spectrum produced by a suddenrise of voltage, which is characterized by an orderly phase and amplituderelation between the individual frequencies in the spectrum.Experimental data taken by the author have shown that the fluctuationnoise crest factor is constant, independent of band width, when thecarrier is strong compared to the noise. Thus the peak voltage of fluctuationnoise varies with band width in the same manner that rootmean-squarevoltage does, namely, as the square-root of the bandwidth ratio. Consequently, for the strong-carrier condition, the peakvoltage characteristics of fluctuation noise may be determined by applyingthe experimentally determined crest factor to the root-meansquarecharacteristics. Hence, in the case of fluctuation noise, (15) appliesfor peak noise improvement as well as for average root-meansquarenoise improvement.Impulse Noise CharacteristicsA simple way of visualizing the manner in which impulse noiseproduces its peak radio-frequency voltage is to consider the case of a
ecurrent impulse. It isNOISE CHARACTERISTICS 13well known that a recurrent impulse, such assquare-wave-form dots, may be expressed by a Fourier series whichconsists of a fundamental and an infinite array of harmonics. <strong>The</strong>amplitudes of these harmonics are inversely proportional to their frequencies.<strong>The</strong> components of the single impulse will be similar to thoseof the recurrent impulse since the single impulse may be considered asa recurrent impulse with a very low rate of recurrence. <strong>The</strong> part of thisimpulse spectrum that is received on a radio receiver is a small bandof the very high order harmonics. Since the frequency difference betweenthe highest and lowest frequencies of this band is small comparedto the mid-frequency of the band, all of the frequencies received are ofpractically equal amplitude. <strong>The</strong>se harmonics are so related to eachother by virtue of their relation to a common fundamental that theyare all in phase at the instant the impulse starts or stops. Hence, forthe interval at the start or stop of the impulse, all of the voltages inthe band add up arithmetically and the peak voltage of the combinationis directly proportional to the number of individual voltages.Since the individual voltages of the spectrum are equally spacedthroughout the band, the number of voltages included in a given bandisproportional to the band width. Consequently, the peak voltage ofthe resultant of the components in the spectrum isdirectly proportionalto the band width. Thus impulse noise varies, not as the squareroot of the band width, as fluctuation noise does, but directly as theband width. 7 Since the voltages in the spectrum add arithmetically,their peak amplitude is proportional to their average ordinate as wellas proportional to the band width. This makes the peak voltage ofimpulse noise, not proportional to the square root of the ratio betweenthe squared-ordinotes areas, as is the case with root-mean-square noise,but proportional to the ratio between the areas of the two spectra.Hence, (referring to Fig. 3)N a ., ,area OCEHN f(peak values, impulse) r=~~area ODH(n/C) X F a_F\1 2K n ~¥ a'(16)' <strong>The</strong> fact that the peak voltage of impulse noise varies directly with theband width was first pointed out to the author by V. D. Landon of the RCAManufacturing Company. <strong>The</strong> results of his work were later presented by him asa paper entitled "A study of noise characteristics," before the Eleventh AnnualConvention, Cleveland, Ohio, May 13, 1936; published in the Proc. I.R.E., vol.24, pp. 1514-1521; November, (1936).
14 FREQUENCY MODULATION, Volume IDividing (16) by (14) to obtain the ratio between the frequency andamplitude modulation output signal-noise ratios givesSf/N f rF d(peak values, impulse) =2 —(17)Equation (17) shows that the frequency modulation peak voltageimprovement with respect to impulse noise is equal to twice the deviationratio or about 1.16 times more improvement than is produced onfluctuation noise. <strong>The</strong> peak power gain would be equal to the squareof the peak voltage gain or four times the square of the deviation ratio.Low Carrier-Noise RatiosWhen the expression for the instantaneous frequency of the wavemodulated by the noise component and signal, given by (7), is resolvedinto its components by the use of the binomial theorem, the followingis the result:/F c — F d sin pt —(18)
NOISE CHARACTERISTICS 15constant shift is to make the wave form of a single noise componentvery peaked and of the nature of an impulse. Because of the selectivityof the audio channel, none of the harmonics are present for the noisefrequencies in the upper half of the audio spectrum. As the frequencyof the noise voltage is lowered, more and more harmonics are passedby the audio channel and as a consequence, the peak frequency deviationdue to the noise 'is increased. This can be more easily understoodfrom the following calculation of the wave form produced by the instantaneousfrequency deviation of the single noise component.
16 FREQUENCY MODULATION, Volume Ienough to have its harmonics eliminated by the audio selectivity, butbecomes more peaked as the frequency is made lower so that moreharmonics are included. This effect tends to increase the peak voltageof the low-frequency noise voltages which have a large number ofharmonics present. Thus, as the carrier-noise ratio approaches unity,the triangular audio spectrum is distorted by an increase in the amplitudeof the lower noise frequencies.<strong>The</strong> above gives a qualitative and partially quantitative descriptionof the noise spectrum which results at the lower carrier-noise ratios.Further development would undoubtedly make possible the exact calculationof the peak and root-mean-square signal-noise ratioreceiver output when the carrier-noise ratioat theat the receiver input isclose to unity, but, because of the laborious nature of the calculationsinvolved in evaluating the terms of (18), and pressure of other work,the author is relying upon experimental determinations for these data.Noise Crest Factor Characteristics<strong>The</strong> crest factor characteristics of the noise can be studied to anapproximate extent by a study of (6). This equation portrays theresultant peak frequency deviation of the wave at the output of thelimiter. From it,the crest factor characteristics of the output of thedetector may be determined since in the frequency modulation receiverfrequency deviations are linearly converted into detector output voltages.However, the crest factor characteristics of the receiver outputare different from those at the detector output due to the effect of theselectivity of the audio channel. This isespecially true in the case ofthe frequency modulation receiver with a deviation ratio greater thanunity, that is, where the audio channel is less than one half the intermediate-frequencychannel. Consequently, in order to obtain the finalresults, the effect of the application of the audio selectivity must beapplied to the results determined from a study of (6).From the curves of Fig. 4, it can be seen that the peak frequencydeviation of the wave given by (7) occurs at a phase angle equal to 180degrees. From the similarity of (6) and (7), it can be seen that thepeak frequency deviation of (6) would also occur at a phase angle of180 degrees. At this phase angle the noise peak frequency deviationfrom (6) is/i„ (peak) =/ 1 d(t)\(F na- F d sin pt)\ 2x dt )(C N) - 1(N/C) - 1
NOISE CHARACTERISTICS 17/ 1 d(t)- ( Fna Fd sin -pt\ 2tt dt /(C/N) - 1(22)Equation (22) shows that the peak frequency deviation of thenoise, for any value of carrier-noise ratio, C/N, is proportionalto the noise instantaneous audio frequency given by the quantity/ 1 d(t) \[F na F d sin pt andJ ,\ 2a- dt Jto the quantity 1/ {(C/N) - 1) } .C/N is the resultant instantaneous peak carrier-noise ratio which is presentin the output of the frequency modulation intermediate-frequencychannel. It is apparent that when this carrier-noise ratio is high, thepeak frequency deviation of the noise is proportional to N/C. Whenthe carrier-noise ratio is equal to unity, the peak frequency deviationbecomes infinite and it is evident that the frequency modulation improvement,which is based on a high carrier-noise ratio, would be lostat this point. <strong>The</strong> term "improvement threshold" will be employedhereinafter to designate this point below which the frequency modulationimprovement is lost and above which the improvement is realized.<strong>The</strong>oretically this term would refer to the condition where the instantaneouspeak voltage of the noise is equal to the peak voltage of thecarrier. However, in the practical case, where only maximum peakvalues of the noise are measured, the improvement threshold will referto the condition of equality of the maximum instantaneous peak voltageof the noise and the peak voltage of the carrier.As the experimental characteristics will show, this increase in peakfrequency deviation of the noise is manifested in an increase in crestfactor of the noise. <strong>The</strong> crest factor cannot rise to infinity, however,due to the limitations imposed by the upper and lower cutoff frequenciesof the intermediate-frequency channel. This selectivity limitsthe peak frequency deviation of the resultant of the noise and appliedmodulation to a value not greater than one half the intermediate-frequencychannel width. Hence, in the absence of applied frequencymodulation, the peak voltage of the noise at the detector output mayrise to a value equal to the peak voltage due to the applied frequencymodulation with maximum frequency deviation. In the presence of theapplied frequency modulation, the total peak frequency deviation islimited so that the noise peaks depress the signal, that is, they punchholes in the signal, but do not rise above it. Thus a phenomenon whichmight be termed "frequency limiting" takes place. This frequency
18 FREQUENCY MODULATION, Volume 1limiting limits frequency deviations in the same manner that amplitudelimiting limits amplitude deviations. <strong>The</strong> resulting effect is the sameas though an amplitude limiter were placed at the detector output tolimit the output so that the peak voltage of the noise or signal, or theirresultant, cannot rise above a voltage corresponding to that producedby the signal alone at full modulation.Since the frequency limiting limits the noise so that its maximumamplitude cannot rise above the maximum amplitude of the appliedmodulation, a noise suppression effect ispresent which is similar tothat effected by the recent noise suppression circuits 8 ' 9used for reducingimpulse noise which is stronger than the amplitude modulatedcarrier being received. <strong>The</strong> result of such limiting is a considerable reductionof the annoyance produced by an intermittent noise, such asignition, where the duration of the impulses is short and the rate ofrecurrence is low. With such noise, the depression of the signal for theduration of the impulse reduces the presence of the signal for only asmall percentage of the time; the resultant effect is a considerable improvementover the condition where the peaks of the noise are strongerthan the signal. On the other hand, for steady noise such as fluctuationnoise, as the carrier-noise ratio is made less than unity, the signalis depressed more and more of the time so that it is gradually smotheredin the noise.When the effect of the audio selectivity is considered in conjunctionwith the frequency limiting, it is found that the noise suppressioneffect is somewhat improved for the case of a deviation ratio greaterthan unity. <strong>The</strong> reason for this is as follows: <strong>The</strong> frequency limitingholds the peak voltage of the noise at the output of the detector so thatit cannot rise above the maximum value of the signal. However, inpassing through the audio channel, the noise is still further reducedby elimination of higher frequency components whereas the signalpasses through without reduction. Consequently the over-all limitingeffect is such that the noise is limited to a value which is less than themaximum value of the signal. <strong>The</strong> amount that it is less depends uponthe difference between the noise spectra existing at the output of thedetector and the output of the audio selectivity.Experimental determinations, which will be shown later, pointout that as unity carrier-noise ratio is approached, the frequency8Leland E, Thompson, "A detector circuit for reducing noise interferencein C.W. reception," QST, vol. 19, p. 38; April, (1935). A similar circuit for telephonyreception is described by the same author in QST, vol. 20, pp. 44-45;February, (1936).8James J. Lamb, "A noise-silencing I.F. circuit for superhet receivers,"QST, vol. 20, pp. 11-14; February, (1936).
NOISE CHARACTERISTICS 19modulation audio noise spectrum changes from its triangular shape toa somewhat rectangular shape. Hence the noise spectrum at the outputof the detector when frequency limiting is taking place would beapproximately as given by OCBA of Fig. 3. When the audio selectivityisapplied, the spectrum would be reduced to OCEH and the bandwidth of the noise would be reduced by a ratio equal to the deviationratio. This would reduce the peak voltage of fluctuation noise by aratio equal to the square root of the deviation ratio and that of impulsenoise by a ratio equal to the deviation ratio. Thus, the resultanteffect of the frequency limiting is that the fluctuation noise output islimited to a value equal to the maximum peak voltage of the signaldivided by the square root of the deviation ratio.<strong>The</strong> correspondingvalue of impulse noise ispeak voltage of the signal divided by the deviation ratio. Consequently,limited to a value equal to the maximumwith fluctuation noise, when the noise and signal are measured in theabsence of each other, the signal-noise ratio cannot go below a valueequal to the square root of the deviation ratio; the correspondingsignal-noise ratio impulse noise cannot go below a value equal to thedeviation ratio. However, these minimum signal-noise ratios are onlythose which exist when the noise is measured in the absence of theapplied frequency modulation. When the applied modulation and thenoise are simultaneously present, the noise causes the signal to bedepressed. When this depressed signal, with its depression caused bynoise composed of a wide band of frequencies, isaudio selectivity, the degree of depression ispassed through thereduced. <strong>The</strong> amount ofthe reduction will be different for the two kinds of noise. <strong>The</strong> determinationof the actual magnitude of thisreduction of the signaldepression, as effected by the audio selectivity, will be left for experimentalevaluation.In comparing frequency modulation systems with different deviationratios at the low carrier-noise ratios, the wider intermediate-frequencychannel necessary for the high deviation ratio receiver givesthat receiver a disadvantage with respect to the low deviation ratioreceiver. Since this wider channel accepts more noise than the narrowerintermediate-frequency channel of the low deviation ratio receiver,when equal carriers are fed to both such receivers equality ofcarrier and noise occurs at a higher carrier level in the high deviationratio receiver. As a result, a higher carrier voltage is required to reachthe improvement threshold in the case of the high deviation ratiosystem. Thus at certain low carrier levels, the carrier-noise ratio couldbe above the improvement threshold in the low deviation ratio system,but below in the high deviation ratio system; at this carrier level the
20 FREQUENCY MODULATION, Volume Ilow deviation ratio system would be capable of producing a betteroutput signal-noise ratio than the high deviation ratio system.<strong>The</strong> difference between the improvement thresholds of receiverswith different deviation ratios may be investigated by a determinationof the carrier-noise ratio which exists in the reference amplitude modulationreceiver when the improvement threshold exists in the frequencymodulation receiver. This carrier-noise ratio may be found by a considerationof the relative band widths of the intermediate-frequencychannels of the receivers. Thus, when the deviation ratio is unity, andthe intermediate-frequency channel of the frequency modulation receiverisof the same width as that of the amplitude modulation receiver,10the two receivers would have the same carrier-noise ratio inthe intermediate-frequency channels. When the deviation ratio isgreater than unity, and the intermediate frequency channel of the frequencymodulation receiver is broader than that of the amplitudemodulation receiver, the carrier-noise ratio in the frequency modulationreceiver is less than that in the amplitude modulation receiver.For the case of fluctuation noise, where the peak values vary as thesquare root of the ratio between the two band widths concerned, thecarrier-noise ratio in the frequency modulation intermediate-frequencychannel would be lessthan that in the. amplitude modulation intermediate-frequencychannel by a ratio equal to the square root of thedeviation ratio. Thus, when equal carrier voltage is fed to both receivers,Ca/Na — {C/N)\/YJJ~F a (fluctuation noise, peak or r-m-s values) (23)in which C a/N a = carrier-noise ratio in the amplitude modulation intermediate-frequencychannel and C/N = corresponding ratio in thefrequency modulation intermediate-frequency channel.In the case of impulse noise, where the peak values of the noise10 In order to assume that the frequency modulation receiver with a deviationratio of unity has the same intermediate-frequency channel width as thecorresponding amplitude modulation receiver, the assumption would also haveto be made that the peak frequency deviation due to the applied frequencymodulation is equal to one half the intermediate-frequency channel width. Inthe ideal receiver with a square-topped selectivity characteristic, this amount offrequency deviation would produce considerable out-of-channel interference andwould introduce distortion in the form of a reduction of the amplitudes of thehigher modulation of frequencies during the intervals of high peak frequencydeviation. However, under actual conditions, where the corners of the selectivitycharacteristic are rounded, it has been found that the frequency deviation maybe made practically equal to one half the normal selectivity used in amplitudemodulation practice without serious distortion. Receivers with high deviationratios are less susceptible to this distortion due to the natural distribution of theside bands for the high values of Fd/Fm which are encountered with such receivers.
.NOISE CHARACTERISTICS 21vary directly with the band-width ratio, the carrier-noise ratios in thetwo receivers are related byC F dC a/Na = —N F a(impulse noise, peak values)(24)From (23), it can be seen that, with fluctuation noise, a carriernoiseratio equal to the square' root of the deviation ratio would existin the amplitude modulation intermediate-frequency channel when thecarrier-noise ratio is at the improvement threshold (C/iV = l) in thefrequency modulation intermediate-frequency channel. Likewise, from(24), with impulse noise, the frequency modulation improvementthreshold occurs at a peak carrier-noise ratio in the amplitude modulationintermediate-frequency channel which isratio.Effect of Application of the Modulationequal to the deviationFor the condition of a carrier which is strong compared to the noise,the equation for the instantaneous frequency of the wave modulatedby the noise and signal, given by (7), may be reduced to the following:n 2f**Fi-Fi sin pt - — (Fna - F d sin pt)n("FA \— — (F na — Fa sin pi) cos < «„nat-pt)}-Jt(~){(FM+2Fm) cos (
22 FREQUENCY MODULATION, Volume 1to the carrier divides the over-all transmission of the receiver intocomponents due to the carrier and each side frequency. <strong>The</strong> amplitudesof these components are proportional to the frequency difference betweenthe noise voltage and the side frequency producing the component.<strong>The</strong> frequency of the audio noise voltage in each one of thesecomponent spectra is equal to the difference between the side frequencyand the noise radio frequency. Thus the application of the modulationchanges the noise from a single triangular spectrum due to the carrier,into a summation of triangular spectra due to the carrier and sidefrequencies. In the absence of selectivity, the total root-mean-squarenoise would be unchanged by the application of the modulation sincethe root-mean-square summation of the frequency modulation carrierand side frequencies is constant; hence the root-mean-square summationof noise spectra whose amplitudes are proportional to the strengthof the carrier and side frequencies would be constant. However, sinceselectivity is present, the noise is reduced somewhat. This can be seenby considering the noise spectrum associated with one of the higherside frequencies. <strong>The</strong> noise spectrum associated with this side frequency,which acts as a "carrier" for its noise spectrum, is curtailedatthe high-frequency end by the upper cutoff of the intermediatefrequencychannel. <strong>The</strong> region of noise below the side frequency iscorrespondingly increased in range, but yields high-frequency noisevoltages which are eliminated by the audio-frequency selectivity.Consequently when modulation is applied, the noise is slightly reduced.<strong>The</strong> amount of this reduction may be calculated by a root-mean-squaresummation of the individual noise spectra due to the carrier and sidefrequencies. For the case of a deviation ratio of unity, an actual summationof the various spectra for full applied modulation has shownthe root-mean-square reduction to be between two and three decibelsdepending upon the audio frequency of the noise. <strong>The</strong> same sort ofsummations also shows that the reduction becomes less as the deviationratio is increased.<strong>The</strong> weak-carrier root-mean-square noise characteristics in thepresence of applied frequency modulation do not lend themselves tosuch straightforward calculation as the corresponding strong-carriercharacteristics and will not be gone into here. <strong>The</strong> same can be saidfor the peak-noise characteristics in the presence of applied frequencymodulation.Transmitter Frequency Modulation Power Gain<strong>The</strong> above considerations, which are based upon the equivalentconditions of equal carrier amplitude at the input of the amplitude
NOISE CHARACTERISTICS 23and frequency modulation receivers, do not take into account thepower gain effected by the use of frequency modulation at the transmitter.Since the power in a frequency modulated wave is constant, theradio-frequency amplifier tubes in the transmitter may be operatedin the class C condition instead of the class B condition as is requiredfor a low level modulated amplitude modulation system. In changingfrom the class B to the class C condition, the output voltage of theamplifier may be doubled. Consequently a four-to-one power gainmay be realized by the use of frequency modulation when the amplitudemodulation transmitter uses low-level modulation. On the otherhand, when the amplitude modulation transmitter uses high levelmodulation—that is, when the final amplifier stage is modulated, thepower gain is not so great. However, for the purpose of showing theeffect of a transmitter power gain, the amplitude modulation transmitterwill be assumed to be modulated at low levels.As this paper is in the final stages of preparation, systems of amplifyingamplitude modulation have been announced wherein plate efficienciesof linear amplifiers have been increased practically to equal theclass C efficiencies. 1112 Since these systems are not in general use asyet, it will suffice to say that such improvements in amplitude modulationtransmission will tend to remove the frequency modulation transmittergain in accordance with these improvements. Hence the overallfrequency modulation gain will more nearly approach that due tothe receiver 13 alone.With a four-to-one power gain at the transmitter, a frequencymodulation system would deliver twice the carrier voltage to its receiverthat an amplitude modulation system would with the sametransmitter output stage. Hence (15) and (17), and (23) and (24)become, respectively,S f/Nf (peak values, fluctuation noise) = 2\Z3Fd/F a (27)S a/N a(peak values, impulse noise) = iF d/F a (28)S a/Na11 W. H. Doherty, "A new high efficiency power amplifier for modulatedwaves," presented before Eleventh Annual Convention, Cleveland, Ohio, May13, (1936); published in Proc. I.R.E., vol. 24, pp. 1163-1182; September, (1936).12 J. N. A. Hawkins, "A new, high-efficiency linear amplifier," <strong>Radio</strong>, no.209, pp. 8-14, 74-76; May, (1936).18 <strong>The</strong> receiver and transmitter gain are mentioned rather loosely when theyare separated in this way. However, it will be understood that the receiver gaincould not be realized without providing a transmitter to match the requirementsof the receiver.
24 FREQUENCY MODULATION, Volume 1C a /N = (C/2N)\ / F d /F a (fluctuation noise, r-m-s or peak values) (29)CJN = (C/2N)F d/F a (impulse noise, peak values). (30)<strong>The</strong>se equations show that this increase in carrier fed to the frequencymodulation receiver not only increases the frequency modulation improvement,but also lowers the carrier-noise ratio received on theamplitude modulation receiver when the improvement threshold existsin the frequency modulation receiver.
1NOISE CHARACTERISTICS 25curves for the frequency modulation receivers show output signal-noiseratios which are greater or lessthan those obtained from the amplitudemodulation receiver depending upon the carrier-noise ratio.For Fig. 5, (15) and (17) were used to obtain the strong-carrierfrequency modulation improvement factors. Hence the frequencymodulation output signal-noise ratios were obtained by multiplyingthe amplitude modulation signal-noise ratios by the frequency modulationimprovement factors. <strong>The</strong> carrier-noise ratios which exist in theamplitude modulation receiver when the improvement threshold exists
26 FREQUENCY MODULATION, Volume Iwith the signal at the output of the detector and is then reduced inpeak voltage by the audio selectivity. <strong>The</strong> amount of this reductionfor impulse noise would be a ratio equal to the deviation ratio or, inthis case, twelve decibels. In the case of fluctuation noise, the reductionof the noise, which is present in the absence of modulation, would beequal to the square root of the deviation ratio, or six decibels, and thecorresponding curve is shown by the line v-w. However, these lines donot portray the actual signal-noise ratio characteristics since the noisedepresses the signal when the carrier-noise ratios go below the improvementthreshold. In the case of fluctuation noise this signal depressioncauses the signal to become smothered in the noise as the carrier-noiseratio is lowered below the improvement threshold. On the other hand,with impulse noise such as ignition, where the pulses are short andrelatively infrequent, carrier-noise ratios below the improvementthreshold will present an output signal which is depressed by the noiseimpulses, but which is quite usable due to the small percentage of timethat the impulse exists.<strong>The</strong> curves of Fig. 6, which take into account the frequency modulationtransmitter gain, utilize (27) and (28) to obtain the frequencymodulation improvements at the high carrier-noise ratios. <strong>The</strong>securves assume a carrier at the frequency modulation receiver inputswhich is twice the strengtb-of that present at the amplitude modulationreceiver input. <strong>The</strong> frequency modulation improvements are thereforeincreased by sixdecibels and the improvement thresholds occur atsignal-noise ratios in the amplitude receiver which are six decibels belowthe corresponding ratios for the case where the transmitter gainis not taken into account.Further conclusions of the theory are as follows: For the high carrier-noiseratios, the application of modulation does not increase theroot-mean-square value of the noise above its unmodulated value. Also,in the case of the low deviation ratio receivers, the root-mean-squarevalue of the noise will be slightly reduced as the modulation is applied.ExperimentIn the experimental work it was desired to obtain a set of datafrom which curves could be plotted showing the frequency modulationcharacteristics in the same manner as the theoretical curves of Fig/ 5.To do this it was necessary to have an amplitude modulation referencesystem and frequency modulation receivers with deviation ratios ofunity and greater than unity. Equal carrier voltages and noise spectracould then be fed to these receivers and the output signal-noiseratios measured while the carrier-noise ratio was varied. Since it was
NOISE CHARACTERISTICS 27not convenient to measure the carrier-noise ratio at intermediate frequency,the output signal-noise ratios of the amplitude modulationreceiver were measured instead and were plotted as abscissas in placeof the carrier-noise ratios. This gives an abscissa scale which is practicallythe same as that which would be obtained by plotting carriernoiseratios. <strong>The</strong> validity of this last statement was checked by measuringthe linearity with which the output signal-noise ratio of theamplitude modulation receiver varied from high to low values as thecarrier-noise ratio was varied by attenuating the carrier in knownamounts in the presence of a constant noise. At the very low rootmean-squareratios the inclusion of the beats between the individualnoise frequencies in the spectrum increases the apparent value of theFREQ.MOD.OSC.RflBEATFREQ.OSC.4 R-FAMP.IMPULSESOURCEMODULATED AMR&SIG. ATTENUATORFIRSTDETECTORB-PAMP.l-F5 SLOPEFILTER iDETECTORSOSCILLOSCOPEc L-PFILTERATTENUA-TDN BOXH A-FAMP.^S>Fig.7— Block diagram of experimental setup.root-mean-square resultant of the noise voltages about two or threedecibels. Thus, except for this small error at the low root-mean-squarecarrier-noise ratios, the amplitude modulation signal-noise ratio canbe assumed equal to the carrier-noise ratio.<strong>The</strong> block diagram of Fig. 7 shows the arrangement of apparatusused in obtaining the experimental data. <strong>The</strong> frequency modulatedoscillator employed a circuit which was similar to that used in the previouslymentioned propagation tests. <strong>The</strong> modulated 1amplifier consistedof a signal generator which was capable of being amplitudemodulated, but whose master oscillator energy was supplied from thefrequency modulated oscillator. Thus a signal generator was availablewhich was capable of being either frequency or amplitude modulated.A two-stage radio-frequency amplifier, tuned to the carrier frequency,but with no signal at its input, was used as the source of fluctuationnoise. For the impulse noise measurements, the radio-frequency output
28 FREQUENCY MODULATION, Volume Iof a square-wave multivibrator was fed to the input of this radiofrequencyamplifier.In order to make available frequency modulation receivers withdifferent deviation ratios, a method was devised which made possiblethe use of a single intermediate-frequency channel and detection systemfor all receivers. <strong>The</strong> method consisted in the insertion of a lowpassfilter in the audio output of the receiver so as to reduce the widthof the audio channel and thereby increase the deviation ratio of thereceiver. This procedure is not that which might be normally followedsince to increase the deviation ratio, the audio channel would normallybe left constant and the intermediate-frequency channel increased.
NOISE CHARACTERISTICS 29lation receiver which would receive a 6500-cycle modulation band.Number three, a frequency modulation receiver with a deviation ratioof about four (6500-7-1600) which would receive a 1600-cycle modulationband. Number four, an amplitude modulation receiver which wouldreceive a 1600-cycle modulation band.With these four receivers, a comparison between number two andnumber one would produce a comparison between amplitude modulationreception and frequency modulation reception with a deviationratio of unity. A comparison between receivers number four and numberthree would produce a comparison between amplitude modulationreception and frequency modulation reception with a deviation ratio offour. Thus both frequency modulation receivers had as a standard ofcomparison an amplitude modulation receiver with an audio channelequal to that of the frequency modulation receiver.<strong>The</strong> limiter of the frequency modulation receiver consisted of fourstages of intermediate-frequency amplification arranged alternately toamplify and limit. <strong>The</strong> sloping filter detectors utilized the same circuitas used in the propagation tests 1except that only one sloping filter wasused in conjunction with a flat-top circuit as described in the theoreticalsection of this paper. Thus a balanced detector type of receiver wasavailable which would also receive amplitude modulation by switchingoff the frequency modulation detector and receiving the detected outputof the flat-top circuit. <strong>The</strong> characteristic of the sloping filter isshown in Fig. 8.<strong>The</strong> output of the detectors was fed to a switching system whichconnected either to a low-pass filter and attenuator or directly to theattenuator. <strong>The</strong> output of the attenuator passed to an audio-frequencyamplifier having an upper cut-off frequency of 6500 cycles. <strong>The</strong> indicatinginstruments were connected to the amplifier output terminals.For the root-mean-square fluctuation noise measurements, a copperoxide-rectifiertype meter was used. 14 A cathode-ray oscilloscope wasused for all peak voltage measurements.In the procedure used to obtain the data, the carrier-noise ratio wasvaried over a wide range of values and the receiver output signal-noiseratios were measured at each value of carrier-noise ratio. To do this,the output of the noise source was held constant while the carrier was14In the preliminary measurements, a thermocouple meter was connected inparallel with the copper-oxide-rectifier meter in order to be sure that no particularcondition of the fluctuation noise wave form would cause the rectifier meter todeviate from its property of reading root-mean-square values on this type ofnoise. It was found that the rectifier type of instrument could be relied upon toindicate correctly so that the remainder of the measurements of root-meansquarefluctuation noise were made using the more convenient rectifier type ofinstrument.
30 FREQUENCY MODULATION, Volume Ivaried by means of the signal generator attenuator. <strong>The</strong> output peaksignal-noise ratios were obtained by first measuring the peak voltageof the tone output with the noise source shut off and then measuringthe peak voltage of the noise with the tone shut off.<strong>The</strong> maximumpeak voltage of the noise was read for its peak voltage. <strong>The</strong> root-meansquaresignal-noise ratios were measured by reading the root-meansquarevoltage of the tone in the presence of the noise and then readingthe voltage of the noise alone. <strong>The</strong> signal was then separated from thenoise by equating the measured signal-plus-noise voltage to \/S +N 2 2 ,substituting the measured noise voltage for N, and solving for the signal,S. In these measurements, a 1000-cycle tone was used to modulate"
NOISE CHARACTERISTICS 31theoretical strong-carrier improvement should be 4X1.73 = 6.9 or 16.8decibels; the measured improvement from Fig. 9 is about 14 decibels.With the deviation ratio of unity (low-pass filter out), the measuredimprovement was about 3.5 decibels as compared to the 4.76-decibeltheoretical figure. <strong>The</strong> full frequency modulation improvement is seento be obtained down to carrier-noise ratios about two or three decibelsabove the improvement threshold (equality of peak carrier and noise).<strong>The</strong> fact that the frequency modulation improvement threshold occursat a higher carrier-noise ratio in the case of the receiver with a deviationratio of four than in the case of the receiver with a deviation ratioof unity, also checks the theoretical predictions. In this case of fluctuationnoise, the improvement threshold for the receiver with the deviationratio of four should occur at a carrier-noise ratio in the amplitudemodulation intermediate-frequency channel which was twice the correspondingratio for the receiver with a deviation ratio of unity. <strong>The</strong>curves show these two points to be about seven decibels apart or withinone decibel of the theoretical figure of six decibels.<strong>The</strong> data for the curves of Fig. 9 were obtained by measuring thepeak value of the noise alone and signal alone and taking the ratio ofthese two values as the signal-noise ratio. Hence the signal depressingeffect, occurring for carrier-noise ratios below the improvement threshold,does not show up on the curves. In order to obtain an approximateidea as to the order of magnitude of this effect, observations weremade in which the carrier-noise ratio was lowered below the improvementthreshold while the tone modulation output (100 per cent modulationin the case of the amplitude modulation observation and fullfrequency deviation in the case of the frequency modulation observation)was being monitored by ear and oscilloscope observation. It wasfound that the fluctuating nature of the instantaneous peak voltageof the fluctuation noise had considerable bearing upon the effects observed.Due to the fact that the instantaneous value of the peak voltageis sometimes far below the maximum instantaneous value, frequencymodulation improvement is obtained to reduce still further thepeak voltage of these intervals of noise having instantaneous peak voltageslower than the maximum value. This effect seems to produce asignal at the output of the frequency modulation receiver which sounds"cleaner," but which has the same maximum peak voltage characteristicsas the corresponding amplitude modulation receiver. Thus, as faras maximum peak voltage of the noise is concerned, the frequencymodulation receiver produces about the same output as the amplitudemodulation receiver for carrier-noise ratios below the improvementthreshold. <strong>The</strong> reduction of the peak voltage of the noise during the
32 FREQUENCY MODULATION, Volume 1intervals of lower instantaneous peak value reduces the energy contentof the noise in the output; hence some idea of the magnitude of thiseffect can be obtained from the root-mean-square characteristics of thenoise.<strong>The</strong> curves of Fig. 10 are similar to those of Fig. 9 except that theroot-mean-square signal-noise ratios are plotted as ordinates. Since thecrest factor of the signal is three decibels and that of fluctuation noiseisabout thirteen decibels (as later curves will show), the root-meansquaresignal-noise ratios are ten decibels higher than the correspondingpeak ratios. It can be seen that the root-mean-square characteris-
NOISE CHARACTERISTICS 33sponding ordinates of Fig. 9, the crest factor of the noise is obtained.<strong>The</strong> results of such a procedure are shown in Fig. 11.In the case of the frequency modulation receiver with a deviationratio of four, Fig. 11 shows that the crest factor increases by about 14.5decibels at the improvement threshold. Hence the frequency modulationimprovement, which is about fourteen decibels by measurementand sixteen by calculation, is counteracted by an increase in crest factor.This same situation exists in the case of the receiver with a deviationratio of unity. Here the increase in crest factor is about four decibels;the measured frequency modulation improvement is about 3.5decibels and the calculated value 4.76 decibels.
34 FREQUENCY MODULATION, Volume I<strong>The</strong> point where the crest factor of the noise increases, which occursat the frequency modulation improvement threshold, has a rather distinctivesound to the ear. When fluctuation noise is being observed,as this point is approached the quality of the hiss takes on a moreintermittent character, somewhat like that of ignition. This point hasbeen termed by the author the "sputter point," and since it coincideswith the improvement threshold it is a good indicator for locating theimprovement threshold. It is caused by'the fact that the fluctuationnoise voltage has a highly variable instantaneous peak voltage so thatthere are certain intervals during which the instantaneous peak voltageof the noise is higher than it is during other intervals. Consequently,asthe maximum peak value of the noise approaches the peak valueof the signal, the higher instantaneous peaks will have their crest factorincreased to a greater degree than the lower instantaneous peaks.Fig. 12 shows oscillograms taken on the fluctuation noise output of theFig.FA12— Wave form of the fluctuation noise output at unity carrier-noise ratioin the frequency modulation receiver. F = frequency modulation receiver.A = amplitude modulation receiver.frequency and amplitude modulation receivers with the 1600-cycle lowpassfilter in the audio circuit and with the signal-noise ratio adjustedto the sputter point. <strong>The</strong>se oscillograms also tend to show how thefrequency modulation signal would sound "cleaner" than the amplitudemodulation signal when the carrier-noise ratio is below the improvementthreshold.Data were also taken to show the fluctuation noise characteristicsas frequency modulation is applied. <strong>The</strong>se data were taken by insertinglow-pass or high-pass filters in the audio system and then applying amodulation frequency to the frequency modulated oscillator whichwould fall outside the pass band of the filters. <strong>The</strong> low-pass filter cutoff at 1600 cycles so that modulating frequencies higher than 1600cycles were applied. <strong>The</strong> output of the filtercontained only noise inthe range from zero to 1600 cycles and the change of noise versus frequencydeviation of the applied modulation could be measured. <strong>The</strong>high-pass filter also cut off at 1600 cycles so that measurements of thelioise in the range from 1600 to 6500 cycles were made while applying
NOISE CHARACTERISTICS 35modulation frequencies below 1600 cycles. In the case of the high-passfilter, the harmonics of the modulating frequencies appeared at thefilter output in addition to the noise. Consequently, a separate measurementof the harmonics in the absence of the noise was made so thatthe noise could be separated from the harmonics by the quadraturerelations. <strong>The</strong> results with the low-pass filter are shown in Fig. 13. <strong>The</strong>results with the high-pass filter are shown in Fig. 14.<strong>The</strong> curves of Fig. 13 are representative of a system with a deviationratio of four. <strong>The</strong>y point out the fact that when the peak carriernoiseratio in the frequency modulation intermediate-frequency channel
36 FREQUENCY MODULATION, Volume Ihighest carrier-noise ratio, the noise is decreased as the modulation isapplied. This is in accordance with the deductions of the theory in thesection Effect of Application of Modulation. As the carrier-noise ratiois lowered this tendency is eliminated.Data similar to that for Fig. 13, with the low-pass filter in the audiocircuit, were taken measuring the output peak voltage of the noise.<strong>The</strong> characteristics obtained were identical to those obtained withroot-mean-square measurements.Since the harmonics of the tone present in the output of the highpassfilter could not readily be separated from the noise for the peak
NOISE CHARACTERISTICS 37signal was depressed to five decibels below full amplitude or down to anamplitude of 56 per cent. Hence the reduction of the depth of the signaldepression was from a 100 per cent depression to a depression of(100 — 56) = 44 per cent or a reduction of about seven decibels. <strong>The</strong>theoretical reduction of the fluctuation noise in the absence of themodulation would be equal to the square root of the ratio of bandwidths or six decibels. Thus the reduction of the signal depression is,for all practical purposes, the same as the reduction in the peak voltageof the noise alone.Impulse Noise Measurements<strong>The</strong> first measurements on impulse noise were made using an automobileignition system driven by an electric motor. However theoutput from this generator proved to be unsteady and did not allow areasonable measurement accuracy. Consequently a square-wave multivibratorwas set up. This type of impulse noise generator proved tobe even more stable than the fluctuation noise source and allowed accuratedata to be obtained. On the other hand, the output of the receiverbeing fed by this noise generator was not as steady as would beexpected. In the absence of the carrier the output was steady, but asthe carrier was introduced the output peak voltage started to fluctuate.Apparently the phase relation between the components of the noisespectrum and the carrier varies in such a manner as to form a resultantwave which varies between amplitude modulation and phase or frequencymodulation. Hence the output of a receiver which is adjustedto receive either type of modulation alone will fluctuate dependingupon the probability considerations of the phase of combination of thecarrier and noise voltages.<strong>The</strong> preliminary impulse noise measurements were made on anamplitude modulation receiver by comparing the peak voltage ratiobetween the two available band widths of 6500 and 1600 cycles. <strong>The</strong>6500-cycle channel was fed to one set of oscilloscope plates and the1600-cycle channel to the other. Thus, when the peak voltages at theoutputs of the two channels were equal the oscilloscope diagram tooka symmetrical shape somewhat like a plus sign. <strong>The</strong> two channel levelswere equalized by means of a tone. Hence, when the noise voltage wassubstituted for the tone,the amount of attenuation that had to beinserted in the wider band to produce a symmetrical diagram on theoscilloscope was taken as the ratio of the peak voltagea of the two bandwidths. In this manner a series of readings was taken which definitelyproved that the peak voltage ratio of the two band widths was proportionalto the band width ratio. <strong>The</strong>se readings were taken on both the
38 FREQUENCY MODULATION, Volume Iignition system noise generator and the multivibrator generator. As acheck, readings on fluctuation noise were also taken which showed thatthe peak voltage of fluctuation noise varies as the square root of theband width.<strong>The</strong> final measurements on impulse noise were made using the sameprocedure followed for the fluctuation noise measurements of Fig. 9.Only peak voltage measurements were made on this type of noise. <strong>The</strong>curves are shown in Fig. 15. It can be seen that the peak voltage characteristicsof impulse noise are similar to those of fluctuation noiseexcept for the location of the improvement threshold. For the receiver
NC1SE CHARACTERISTICS .39Since the signal-noise ratios for the curves of Fig. 15 were obtainedby measuring the noise and signal in the absence of each other, thesignal-depressing effect of the noise does not show up. However, in thecase of impulse noise, these curves are more representative of the actualsituation existing, because the noise depresses the signal for only asmall percentage of the time. In the listening and oscilloscope observationsconducted with carrier-noise ratios below the improvementthreshold, it was observed that at unity carrier-noise ratio the noisepeaks depressed the amplitude of the signal to zero at the output ofthe detector. When the low-pass filter was inserted in the audio circuit,the impulse noise peaks depressed the signal about 2.5 decibels or reducedthe amplitude from 100 per cent to 75 per cent. <strong>The</strong> effective signal-noiseratio is then increased from unity to 100/(100 — 75) =4 or 12wwT VI WW WWv4~ f 4^ JMI *Hw)C/n=20 C/n=2 C/n= 1.26 C/n=lFig; 16—Over-all transmission oscillograms of the frequency and amplitudemodulation receivers. 1600-cycle low-pass filter in audio output. Top row =amplitude modulation, bottom row = frequency modulation. C/n = ratio betweenthe carrier and the variable-frequency heterodyning voltages.decibels. This is equal to the theoretical reduction in peak voltage ofimpulse noise which would be effected by this four-to-one band widthratio. It is then evident that the reduction of the depth of the signaldepression caused by the impulse noise is of the same magnitude as thereduction of the peak voltage of the noise alone.Over-all Transmissions<strong>The</strong> oscillograms of Fig.16 show the over-all transmissions of theamplitude and frequency modulation receivers at various carrier-noiseratios. <strong>The</strong>se oscillograms were taken by tuning the receiver to a carrier,and then, to simulate the noise, manually tuning a heterodyningsignal across the intermediate-frequency channel. <strong>The</strong> audio beat outputof the receiver was applied through the low-pass filter to the verti-
40 FREQUENCY MODULATION, Volume Ical plates of the oscilloscope. A bias proportional to the frequencychange of the heterodyning voltage was applied to the other set ofoscilloscope plates. Consequently the spectra obtained are those whichwould be produced by the combination of a single noise component ofvariable frequency and the carrier. At the higher carrier-noise ratios,the spectrum is rectangular for amplitude modulation and triangularfor frequency modulation. <strong>The</strong> dip in the middle of the amplitudemodulation spectrum is where the audio output is near zero beat. Asthe carrier-noise ratio is decreased, the frequency modulation spectrumdeviates from its triangular shape and the wave form of the receiveroutput has increased harmonic content at the lower audio frequencieswhere the audio selectivity does not eliminate the harmonics.<strong>The</strong> amplitude modulation spectra of Fig. 16 also show the presenceof added harmonic distortion on the lower modulation frequenciesand lower carrier-noise ratios. However, the effect is so small that it isof little consequence.<strong>The</strong> spectra of Fig. 16 allow a better understanding of the situationwhich is theoretically portrayed by (7) of the theory.Experimental ConclusionsIt can be concluded that the experimental data in general confirmthe theory and point out the following additional information:<strong>The</strong> improvement threshold starts at a carrier-noise ratioaboutthree or four decibels above equality of peak carrier and noise in thefrequency modulation intermediate-frequency channel. Hence the fullfrequency modulation improvement may be obtained down to a peakcarrier-noise ratio in the frequency modulation receiver of three or fourdecibels.<strong>The</strong> root-mean-square fluctuation noise characteristics differ fromthe peak fluctuation noise characteristics for carrier-noise ratios belowthe improvement threshold. <strong>The</strong> improvement threshold starts atabout the same peak carrier-noise ratio, but the improvement does notfall off as sharply as it does for peak signal-noise ratios. Thus, for carrier-noiseratios below the improvement threshold the energy contentof the frequency modulation noise is reduced, but the peak characteristicsare approximately the same as those of the amplitude modulationreceiver. <strong>The</strong> characteristics are not exactly the same due to the frequencylimiting which allows the noise peaks to depress the signal, butdoes not allow them to rise above the signal.<strong>The</strong> crest factor of the fluctuation noise at the outputs of the frequencyand amplitude modulation receivers is about thirteen decibelsor 4.5 to one for the strong-carrier condition. <strong>The</strong> crest factor of ampli-
NOISE CHARACTERISTICS 41tude modulation fluctuation noise remains fairly constant regardlessof the carrier-noise ratio. At equality of peak carrier and peak noise inthe frequency modulation intermediate-frequency channel, the crestfactor of the noise in the output of the frequency modulation receiverrises to a value which counteracts the peak signal-noise ratio improvementover amplitude modulation; the improvement threshold manifestsitself in this manner.At the improvement threshold, the application of the audio selectivityreduces the signal depression due to a noise peak by the samereduces the noise in the absence of the signal. Thus theratio that itdepth of a noise depression in the signal is reduced by a ratio equal tothe square root of the deviation ratio in the case of fluctuation noise,and equal to the deviation ratio in the case of impulse noise.General Conclusions<strong>The</strong> theory and experimental data point out the following conclusions:A frequency modulation system offers a signal-noise ratio improvementover an equivalent amplitude modulation system when thecarrier-noise ratio is high enough. For fluctuation noise this improvementis equal to the square root of three times the deviation ratio forboth peak and root-mean-square values. For impulse noise the correspondingpeak signal-noise ratio improvement isequal to twice thedeviation ratio. When the carrier-noise ratio is about three or fourdecibels above equality of peak carrier and peak noise in the frequencymodulation intermediate-frequency channel, the peak improvementfor either type of noise starts to decrease and becomes zero at a carriernoiseratio about equal to unity. Below this "improvement threshold,"the peak characteristics of the frequency modulation receiver are approximatelythe same as those of the equivalent amplitude modulationreceiver. <strong>The</strong> root-mean-square characteristics of the frequency modulationnoise show a reduction of the energy content of the noise forcarrier-noise ratios below the improvement threshold; this is evidencedby the fact that the improvement threshold is not as sharp for rootmean-squarevalues as for peak values.At the lower carrier-noise ratios, frequency modulation systemswith lower deviation ratios have an advantage over systems withhigher deviation ratios.Since the high deviation ratio system has awider intermediate-frequency channel, more noise is accepted by thatchannel so that the improvement threshold occurs at a higher carrierlevel in the high deviation ratio system than in the low. Hence the
42 FREQUENCY MODULATION, Volume 1low deviation ratio systems retain their frequency modulation improvementdown to lower carrier levels.<strong>The</strong> peak voltage of fluctuation noise varies with band width in thesame manner as the root-mean-square voltage, namely, as the squareroot of the band width. <strong>The</strong> peak voltage of impulse noise varies directlyas the band width.In frequency modulation systems with adeviation ratio greater than unity, this difference in the variation withband width makes the improvement threshold occur at a higher carrierlevel with impulse noise than with fluctuation noise. Hence frequencymodulation systems with higher deviation ratios are more susceptibleto impulse noise interference.Because of a phenomenon called "frequency limiting" the peak frequencydeviations of the noise or the noise-plus-signal are Jimited sothat the peak value cannot rise above the maximum peak value of thesignal at the output of the detector. <strong>The</strong> application of audio selectivityreduces this maximum value of the noise so that fluctuation noise cannotrise to a value higher than the maximum value of the signal dividedby the square root of the deviation ratio; the corresponding value ofimpulse noise cannot rise to a value higher than the maximum peakvoltage of the signal divided by the deviation ratio. Inherent with thislimiting effect is a signal-depressing effect which causes the fluctuationnoise gradually to smother the signal as the carrier-noise ratio is loweredbelow the improvement threshold. However in the case of impulsenoise, the signal depression is not as troublesome, and a noise-suppressioneffect is created which is similar to that effected in the recent circuitsfor suppressing impulse noise which isstronger than the carrierin an amplitude modulation system. When the deviation ratio isgreater than unity, this frequency limiting is more effective thanthe corresponding amplitude modulation noise-suppressionthis iscircuits;caused by the audio selectivity reducing the maximum peakvalue of the noise so that it is less than the peak value of the signal.For carrier-noise ratios greater than unity, the application of frequencymodulation to the carrier does not increase the noise above itsvalue in the absence of applied frequency modulation.At the transmitter, a four-to-one power gain is obtained by the useof class C radio-frequency amplification for frequency modulation insteadof the customary class B amplification as isused for low levelamplitude modulation. <strong>The</strong>refore, for the same transmitter power input,a frequency modulation system will produce at its receiver a carrierwhich is twice as strong as that produced at the receiver of anamplitude modulation system. This results in two effects: first, the
NOISE CHARACTERISTICS 43frequency modulation improvement is doubled for carrier-noise ratiosabove the improvement threshold; second, when the improvementthreshold occurs in the frequency modulation receiver, the carriernoiseratio existing in the amplitude modulation receiver is one halfof what it would have been without the transmitter power gain.Acknowledgment<strong>The</strong> author thanks Mr. H. H. Beverage and Mr. H. O. Petersonfor the careful guidance and helpful suggestions received from themduring the course of this work. <strong>The</strong> assistance of Mr. R. E. Schock inthe experimental work is also appreciated.
FREQUENCY MODULATION*!ByS. W. SeeleyRCA License Laboratory, <strong>New</strong> YorkSummary— This paper, which contains generalized theory of the principalcharacteristics of frequency-modulation systems, is purposely madebroad in its attack in order to achieve simplicity of presentation of fundamentals.Detailed treatment of specific problems associated with this typeof modulation isgiven in the articles listed in the appended bibliography.COMBINATIONphase modulation into one treatment may seem improper, atfirst glance, when the subject to be treated is frequency modulationalone.I. Frequency and Phase Modulationof discussions of frequency modulation andIt has been done in this section of the paper because thetwo are so related that an understanding of both is necessary for atrue picture of either.<strong>The</strong> simplest conception of a frequency-modulated wave isof onewith unvarying amplitude whose frequency is altered cyclically aboveand below its mean unmodulated value. However, if we consider phasemodulation in its simplest form, it can be seen that frequency modulationalso results therefrom. Consider the case of Figure 1, in which acarrier wave of unvarying amplitude A has its phase advanced andretarded sinusoidally between values of +
phase modulation maintained constantFREQUENCY MODULATION 45(deviation between +
46 FREQUENCY MODULATION, Volume III.Deviation and Band Width<strong>The</strong> simple conception of a frequency-modulated wave, in whichthe frequency of a carrier wave of unvarying amplitude is alteredcyclically about its mean value, is sufficiently adequate if the maximumfrequency excursions of the carrier-wave frequency are large comparedto the modulating frequency, for example, in the case of a wave beingvaried between limits separated by, say, 150 kc with the variationoccurring sinusoidally at a 100-cyele per second rate.If, however, the maximum frequency excursion is of the sameorder of magnitude, or equal to,or less than the frequency of change,the case is not so simple. It has often been proposed in all good faiththat a communication channel could be narrowed by the use of frequencymodulation in which the deviation in cycles per second isthan the modulating frequency.However, it is axiomatic that any sidebandenergyless(and consequently the necessary intelligence component)in any type of modulation, whether frequency, phase, or amplitude, willnot approach the carrier closer than a frequency interval equal to themodulating frequency. <strong>The</strong>refore, if a narrow-band receiver is usedto intercept a small deviation frequency-modulated wave whose modulatingfrequency is greater than one-half of the band width of thereceiver, none of the modulation will be received. If we assume thecase of a frequency-modulated wave with a modulating frequency of10,000 cycles per second, which causes a deviation of + and — 10,000cycles in the frequency of the carrier, a receiver with theoreticallyperfect band pass in its r-f and i-f circuits 19.9 kc wide with perfectlyperpendicular sides,tuned with the carrier at the center of the bandto receive that frequency-modulated wave, would not give any evidenceof what modulating frequency was being used. A pure unvaryingcarrier with neither frequency, phase, nor amplitude modulation wouldbe applied to its demodulating detector. It is true that in the examplecited the received carrier would be somewhat decreased in value(actuallyto about 76 per cent) from its unmodulated amplitude, but thisneed not concern us for the moment. <strong>The</strong> example is cited simply toemphasize the fact that in frequency and phase modulation, as wellas in amplitude modulation, the intelligence components are carriedin side-band energy, and that that side-band energy must be receivedin order to interpret or reproduce the originalmodulation.In the example cited above, side bands will exist not only at frequenciesof + and — 10 kc with respect to the carrier, but also at+ and — 20 kc, as well as at 30 kc, etc. 1 If the theoretically perfect1See publications listed in the bibliography for more complete explanationof this characteristic.
FREQUENCY MODULATION 47band pass of our receiver were just sufficiently wide to pass onlythose side components at 4- and — 10 kc, we would have the conditionshown in Figure 3A. In this figure the first three side bands areshown with their relative amplitudes when the peak frequency excursiondivided by the modulating frequency is equal to unity. <strong>The</strong> theoreticallyperfect pass band is shown just including the carrier and thefirst two side bands. <strong>The</strong> resultant wave is as represented vectoriallyin Figure 3B, with the upper and lower side bands revolving about thepoint P, first causing a phase displacement to point P' and then to P".ACC£PTAVCE_Fig. 3Under these conditions it can be seen that the resultant instantaneousscalar magnitude of the carrier will vary between .78 and 1.16. Inother words, amplitude modulation at twice the modulating frequencyhas resulted from deletion of all but the first side bands. This amplitudemodulation contains no components at the 10,000-cycle frequency,ischiefly second harmonic, and contains small amounts of other evenharmonics.If now this wave shown emerging from our perfect 20-kc bandpass filter is passed through a limiter stage which denudes the carrierof any amplitude modulation, the vector A will oscillate between thepoint A' and A", which means that additional side bands have beenrecreated to cancel the amplitude modulation. It so happens that allof the even harmonic side bands are reinserted by a limiter stage, butthat the odd harmonic side bands are not so reinserted, and thus a
—48 FREQUENCY MODULATION, Volume Ismall amount of distortion (principally third harmonic) in a demodulatedwave which had been subjected to the process above describedwould result.III.Noise Reducing Properties op Frequency ModulationIf a single, sharp, interfering impulse is applied to a band passreceiver, the resultant wave train which ensues is a function of theupper and lower frequencies of the pass band, and, for purposes ofthis discussion, can be assumed to be at one frequency only, namelythat at the center of the pass band. An idealized mathematical expressionfor the wave train takes the form ofA cos (wj — w 2 )t (w 1 + w 2 )tcos ——t 2where A is a coefficient and w xand w 2 correspond to the upper andcos xlower limits of the pass band. <strong>The</strong> expression of the formx(similar to the first part of the above expression) indicates a fallingamplitude of wave envelope for positive and negative values of "t" asshown in Figure 4. Most of the energy of this wave train is, ofcourse, under the large middle portion of the envelope, but the significantpoint is that for purposes of analysis the frequency can beassumed to be constant and equal to the mean frequency of the passband, as shown by the second portion of the expression. Thus if thispeak of interference, emerging from the pass band filters, is appliedto a perfectly balanced back-to-back frequency-modulation detectoror discriminator, its effect on both halves of that circuit is identical,and the net result is zero output.If, however, a carrier wave at the mean frequency of the pass bandis also present, the instantaneous phase of the interference energy andof the steady state carrier may take on any random value. Thus ifthe phase of the wave train due to the interfering impulse is, say 90°ahead of the carrier-wave phase and the interfering impulse ismuchstronger than the carrier wave, the instantaneous phase of the resultantof the two is altered considerably during the transmission of the interferingpulse. <strong>The</strong>refore, even though the two waves together arepassed through a limiter stage, the output of which is unvarying inamplitude, a certain amount of phase modulation (and consequentlyfrequency modulation as well) has been developed, and the frequencymodulation detector interprets itin the form of an output voltage orcurrent. <strong>The</strong> same phenomenon may occur if recurrent interferingpulses overlap.
FREQUENCY MODULATION 49IV.Interference Between CarriersIf two transmitted carriers are received at one time and the beatbetween the two isat audible frequency, the sum of the two producesboth amplitude and phase (or frequency) modulation. If one is twicethe amplitude of the other, the resultant phase modulation amountsto ± 26.5 degrees regardless of the frequency of separation.TO INFINITYCMVILO0F OF AtfxatxtM PTAfSFO0 1/MI7//M C4S£ Of iOFMMM0 MSS CI&CVIT.Fig:. 4This is shown in Figure 5. However, as pointed out in the firstpart of this discussion, the amount of frequency modulation resultingfrom a given amount of phase modulation is a function of the modulatingfrequency, which in this case can be assumed to be the frequencyof separation ,of the two waves. Thus if the two frequencies areseparated by 15,000 cycles, the equivalent frequency deviation of thefrequency modulation amounts to approximately 7000 cycles per second.However, if the frequency of separation is only 100 cycles, the same
50 FREQUENCY MODULATION, Volume Iamount of phase modulation produces a frequency excursion or deviationof only 45 cycles per second. 2 Since the output of the frequencymodulationdetector of a frequency-modulated wave receiver is dependentonly upon the deviation, or excursion, from the mean frequency, itcan be seen that the output will be 150 times greater when the carriersare separated by 15,000 cycles than when the separation is only 100cycles. It is for this reason that the beat note between two frequencymodulatedcarrier wave stations becomes inaudible as the frequenciesare brought closer and closer together.V. Frequency-Modulation MethodsA frequency-modulated wave transmitter should emit a wave ofCAPBienOUTPUT OFi/M/rs/r STAGEFig. 5unvarying amplitude with a frequency deviation about its mean(carrier) frequency in perfect conformity with the speech or programmodulation. This neglects the matter of high-frequency pre-emphasiswhich will be discussed shortly.<strong>The</strong>re are two basic methods of producing this desired result. Ineither case, however, and unlike amplitude-modulated wave transmitters,the modulation takes place at the source of the transmitterfrequency-determining circuits. <strong>The</strong>reafter, the original oscillatorfrequencyenergy may be amplified, multiplied in frequency, orheterodyned to any other frequency without altering the modulatingcomponents except to the extent that any multiplication of the source2Actually when a single side component "phase modulates" an existingcarrier, as in this ca"se, the frequency modulation is not symmetrical. However,with a two to one ratio of original amplitude the "peak to peak"frequency shift is nearly equal to the values which the above figures wouldindicate.
FREQUENCY MODULATION 61frequency increases the deviation by an equal factor. Thus a tloublerstage not only doubles the carrier frequency but also doubles thedeviation width.VI.Modulation of Phase to Produce Frequency ModulationOne means of producing frequency modulation is first to "integrate"the program material and then phase modulate some low-frequencysource of energy; subsequent frequency multiplication can increasethe resulting frequency deviation to any desired amount. After thedesired band width has been obtained, the carrier with its modulatingcomponents can be heterodyned either directly to the transmitterfrequency or to some sub-multiple thereof.deviation and band width are obtained by thesubsequent multiplicationto the transmitter frequency.In the latter case, additional<strong>The</strong> integrating process usually consists of obtaining the potentialsacross a pure capacitive reactance in the plate circuit of a highimpedance vacuum tube whose grid issupplied with the normal audiocomponents. This causes a phase delay of 90° at all modulating frequenciesand gives the program material an amplitude characteristicwhich is inversely proportional to frequency. If high-frequency preemphasisis to be used, the plate circuit may have a resistance in serieswith the capacitance with the output potentials taken across both.This allows more of the high-frequency components to enter themodulating circuit than would otherwise be the case. Present-daypractice in pre-emphasis of both amplitude and frequency-modulatedwave transmitters is to use a pre-emphasizing circuit equivalent to aseries L/R network having a time constant of about 100 microseconds.<strong>The</strong>refore, if the program integrating circuits for a phase-modulatingfrequency-modulated wave transmitter are to perform the pre-emphasisfunction also, the CR series combination must have a time constant ofthat value. Of course, the integration and pre-emphasis functions maybe performed in separate stages, but it seems desirable to combine thetwo and thus prevent the extremely wide discrepancies between thelevels of the low-frequency and high-frequency components of theprogram material at any point in the preparatory networks.If the original frequency which is to be phase modulated by theprepared (integrated) program is produced by a crystal oscillator orother stable source of oscillations, the usual method of procedure is toamplitude modulate some of the energy at that frequency in a balancedmodulator and then to re-insert carrier energy with an exactly 90°phaserotation. <strong>The</strong> result is the same vectorially as is shown inFigure 6. <strong>The</strong> output contains both phase and amplitude modulation.
52 FREQUENCY MODULATION, Volume I<strong>The</strong> amplitude modulation has little or no significance since it isalways "limited" off in subsequent stages, but it is interesting to notethat at least with sine-wave modulation, all amplitude modulation isat even harmonics of the modulation frequency without any of thefundamental being present. This is shown by the fact that the vectorrepresenting the carrier maximizes at each end of its phase excursionor twice each modulating cycle.<strong>The</strong> developed phase modulation can be seen to be a function of theamplitudes of the horizontal vectors in Figure 6, which have beenderived from the balanced modulator. As long as the angle, whosetangent is equal to the sum of the modulating vectors divided by thecarrier vector, does not exceed 30° (the range through which theFROM BALANCEDMODULATORJXMS£RTEOCAPP/eGFig. 6tangent is approximately equal to the angle)the phase modulation canbe said to vary linearly with the modulating components. 3<strong>The</strong> peak-frequency deviation of a frequency-modulated wave isrelated to the peak-phase deviation by the expression4,-.3602ttFrequency DeviationX'Modulating Frequencyin which is the peak-phase deviation in degrees.If it is desired to produce a frequency deviation of ± 75,000 cycleswith a 50-cycle modulating frequency, the phase displacement wouldamount to ± 86,000 degrees. If the assumption of 30 degrees for the3 Actually 30° phase modulation by this process results in nearly 10 percent harmonic distortion, but since the resulting frequency modulation isa function of the product of the phase deviation and the modulating frequencythe maximum phase displacement is required only for full modulationat the lowest modulating frequency.
FREQUENCY MODULATION 53maximum permissible-source modulation is divided into 86,000, therequired carrier-frequency multiplication isseen to approach a valueof 3000 times. If the original phase-modulated frequency is, say, 200kc, eight "doubler" stages, providing a multiplication of 256 times,would give an output frequency of 51,2 megacycles. This frequencymight then be heterodyned down to one-twelfth of the desired finaltransmitterfrequency. Two additional doubler stages and a triplerstage would then provide the correct carrier-output frequency and anoverall multiplication of 3072.Obviously the heterodyning process hasno effect on the absolute frequency deviation.A sytem for phase modulation capable of producing phase deviationsof several hundred degrees was described by Mr. R. E. Shelbyof the National Broadcasting Company in a paper presented at theannual meeting of the Institute of <strong>Radio</strong> Enginers in <strong>New</strong> York inJuly, 1939. This system utilizes a cathode-ray tube of special designhaving a spiral target, which is scanned by a circularly deflected beamrotating at the carrier frequency or some sub-multiple thereof. <strong>The</strong>diameter of the circular pattern is varied in accordance with thedesired modulation, and thereby alters the phase of the cycle at whichthe beam strikes the spiral anode. Output circuits connected, to thespiral electrode can then extract the phase-modulated energy. Thisenergy requires less frequency multiplication to produce a desiredfrequency deviation.VII. Direct Frequency ModulationA more direct system for producing frequency modulation utilizesa "reactance tube", similar to those used for automatic-frequencycontrol, directly across the tank circuit of an oscillating vacuum tube.With this arrangement the transmitter-output frequency may be modulateddirectly without the need for frequency multiplication. However,it is usually convenient and desirable to use some doubler or triplerstages similar to those employed in a high-frequency amplitudemodulatedwave transmitter. Of course, the source frequency cannotbe crystal controlled directly, but carrier-frequency control can bemaintained by heterodyning the carrier wave with a crystal-controlledoscillator to some low value, which is caused to operated a sensitivediscriminator circuit. <strong>The</strong> output of the discriminator in turn affectsthe d-c bias of the original reactance control tube in the proper mannerto correct for mistuning or frequency drift of the source oscillator.Carrier-wave stability within the limits of a few hundred cycles, evenfor a 40-Mc transmitter, can be maintained in this manner.
54 FREQUENCY MODULATION, Volume IVIII.Generalized Frequency-Modulated-WaveReceiver Considerations<strong>The</strong> radio frequency, first detector and intermediate frequencycircuits of a frequency-modulated-wave receiver are identical basicallywith those in an amplitude-modulated-wave receiver. <strong>The</strong> only importantdifference is in the width of the pass band, which is generallyseveral times greater in the frequency-modulated-wave receiver.A detector of amplitude modulation, of and by itself, is immune tovariations in the frequency of the applied wave. <strong>The</strong>re can be noexact counterpart in the form of a frequency-modulation detectorimmune to amplitude variations. Zero amplitude is bound to producezero output from any detector, so the output of all detectors mustbe some function of amplitude.For this reason the second detector of a frequency-modulated-wavereceiver is usually preceded by a limiter stage whose output is constantfor wide variations in the amplitude of the applied signal.However,this is necessary only because of the inherent limitations of the detectorand thus it might properly be considered as an integral part of thedetection circuit.Another characteristic of the usual frequency-modulation detectorstill further reduces its output response to amplitude variations. Thisis occasioned by the common practice of using so-called back-to-backor "push-pull" detectors. <strong>The</strong>se are so arranged that a frequencydeviation in a given direction causes an increase in the current orvoltage output of one, while simultaneously causing a decrease inoutput of the other. Both detectors, however, respond similarly tochanges in amplitude of the applied wave. Thus with the outputcircuits of the two connected in series opposition, amplitude variationscan act only to increase or decrease the "sensitivity"theof the combinationto frequency modulation, and cannot produce output in theabsence of frequency deviations.Frequency-Modulation BibliographyNotes on the <strong>The</strong>ory of Modulation—J. R. Carson. Proc. I.R.E., February1922, p. 57.<strong>The</strong> Reduction of Atmospheric Disturbances—J. R. Carson. Proc.I.R.E., July 1928, p. 967.Uber Frequenzmodulation—H. Roder. Telefunken-Zeitung, No. 53,1929, p. 48.Frequency Modulation—J. Harmon. Wireless World, January 22, 1930,p. 89Ȧ Study of the Frequency-Modulation Problem—A. Heilman. E.N.T.(in German), June 1930, p. 217.Frequency Modulation—B. Van der Pol. Proc. I.R.E.,. July 1930, p. 1104.
FREQUENCY MODULATION 55Frequency Modulation and Distortion—T. L. Eckersley. ExperimentalWireless & Wireless Engineer, Sept. 1930, p. 482.Note on Relationships Existing Between <strong>Radio</strong> Waves Modulated inFrequency and in Amplitude—C. H. Smith. Experimental Wireless & WirelessEngineer, Nov. 1930, p. 609.Amplitude, Phase and Frequency Modulation—Hans Roder. Proc.I.R.E., Dec. 1931, p. 2145.<strong>The</strong> Reception of Frequeney-Modulated <strong>Radio</strong> Signals—V. J. Andrew.Proc. I. R.E., May 1932, p. 835.Phase Shift in <strong>Radio</strong> Transmitters—W. A. Fitch, Proc. I.R.E., May1932, p. 863.A <strong>New</strong> Electrical Method of Frequency Analysis and Its Applicationto Frequency Modulation—W. S. Barrow. Proc. I.R.E., October 1932,p. 1626.Frequency Modulation and the Effects of a Periodic Capacitance Variationin a Non-dissipative Oscillatory Circuit—W. L. Barrow. Proc. I.R.E.,Aug. 1933, p. 1182.High-Frequency Measurements—August Hund. (A book) McGraw-Hill Co., 1933.Transmission Lines as Frequency Modulators—A. V. Eastman andE. D. Scott. Proc. I.R.E., July 1934, p. 878.<strong>The</strong>oretical and Experimental Investigation of Frequency and Phase-Modulated Oscillators—F. Lautenschlager. E.N.T., October 1934, p. 357.<strong>The</strong> Detection of Frequency-Modulated Waves—J. G. Chaffee. Proc.I.R.E., May 1935, p. 517.Phase-Frequency Modulation—D. G. Fink. Electronics, November 1935,p. 431.Frequency Modulation on Ultra-Short Waves—D. Pollack. <strong>Radio</strong> <strong>New</strong>s,February 1936, p. 458.A Method of Reducing Disturbances in <strong>Radio</strong> Signalling by a Systemof Frequency Modulation—E. H. Armstrong. Proc. I.R.E., May 1936, p. 689.Frequency-Modulation Propagation Characteristics—M. G. Crosby.Proc. I.R.E., June 1936, p. 898.A Study of the Characteristics of Noise—V. D. Landon. Proc. I.R.E.,Nov. 1936, p. 1514.Frequency-Modulated Generators—A. W. Barber. <strong>Radio</strong> EngineeringNov. 1936, p. 14.Frequency-Modulation Noise Characteristics—M. G. Crosby. Proc.I.R.E., April 1937, p. 472.Communication Engineering—W. L. Everitt. (A book) McGraw-HillCo., 1937, p. 408 (2nd edition).<strong>Radio</strong> Engineering—F. E. Terman. (A book) McGraw-Hill Co., 1937,p. 380.Noise in Frequency Modulation—H. Roder. Electronics, May 1937,p. 22.Application of the Autosynchronized Oscillator to Frequency Demodulation—J.R. Woodyard. Proc. I.R.E., May 1937, p. 612.Variable-Frequency Electric Circuit <strong>The</strong>ory with Application to the<strong>The</strong>ory of Frequency Modulation—Carson and Fry. Bell System TechnicalJournal, October 1937, p. 513.Effects of Tuned Circuits on a Frequency-Modulated Signal—HansRoder. Proc. I.R.E., December 1937, p. 1617.Armstrong's Frequency Modulator—D. L. Jaffe. Proc. I.R.E., April1938, p. 475.Carrier and Side-Frequency Relations with Multi-Tone Frequency forPhase Modulation—M. G. Crosby. RCA Review, July 1938, p. 103.
56 FREQUENCY MODULATION, Volume IReduction of Interference by Frequency Modulation—E. H. Plump.Hochfrequenztechnik und Electroakustic, Sept. 1938, p. 73.Communication by Phase Modulation—M. G. Crosby. Proc. I.R.E.,Vol. 27, No. 2, Feb. 1939, p. 126.<strong>The</strong> Application of Negative Feedback to Frequency-ModulationSystems—J. G. Chaffee. Bell System Technical Journal, Oct. 1937, p. 404.Proc. I.R.E., May 1939, p. 317.A Receiver for Frequency Modulation—J. R. Day. Electronics, June1939, p. 32.A Noise-Free <strong>Radio</strong> Receiver for the Reception of Frequency-ModulatedUltra-Short Waves—G. W. Fyler and J. A. Worcester. Gen. Electric Review,July 1939, p. 307.Frequency Modulation—C. H. Ybcum. Communications, Nov. 1939, p. 5.Frequency-Modulated Transmitters. Electronics, Nov. 1939, p. 20.
BAND WIDTH AND READABILITY INFREQUENCY MODULATION*!ByMurray G. CrosbyKCA Communications, Inc., Kiverhead, L. I., <strong>New</strong> YorkSummary— <strong>The</strong> signaUto-noise ratio characteristics of frequency modulationare considered with reference to the effect of band width on readabilityin voice communication. Results of listening tests are describedwhich indicate the optimum deviation ratio to be unity for maximum readabilityand distance of transmission. Other tests shoiv the superiority offrequency modulation over amplitude modulation with respect to readability.NE of the first questions which arises when frequency modulationis chosen for a communication system is that of the bandkwidth or amount of frequency deviation to be used. Amongthe many factors which affect the choice of band width isthe subjectof quality or readability of signal required. It is the purpose of thisarticle to consider that subject and to attempt to show the relationshipbetween band width and readability.When the term readability is mentioned, consideration is limitedto types of service in which the primary object of the system is thebare transfer of intelligence. This confines the consideration to serviceswhere the desire isto transmit voice the maximum distance withfull readability for, while a high signal-to-noise ratio is desirablein the reception of voice, increasing the ratio above a certain valuedoes not improve the readability. Consequently if the high signal-tonoiseratio isobtained at the expense of the ability to receive weakersignals, which is the case when the band width is made too wide in afrequency modulation system, the system is not working at its bestefficiency. As will be shown here, when the primary object is the transmissionof intelligence, the maximum distance will be covered when theband width is made the minimum possible.* Decimal Classification: R148.2.t Reprinted from RCA REVIEW, January, 1941.57
58 FREQUENCY MODULATION, Volume I-39-Fig. 1—Peak signal-to-noise ratio characteristics for frequency-modulationsystems using maximum frequency deviations, Fa, of 20 and 6 kilocycles,respectively. <strong>The</strong> audio band width was 5 kilocycles. <strong>The</strong> noise was internalreceiver noise and the signal-to-noise ratios were measured on an oscilloscope.Fig. 2—Root-mean-square signal-to-noise ratio characteristics for the samesystems used for Fig. 1. <strong>The</strong> signal-to-noise ratios were measured on arectifier-type meter.
BAND WIDTH AND READABILITY 59<strong>The</strong> reason for this superiority of a system using a low frequencydeviation over one using a high frequency deviation, when maximumdistance is the consideration, can best be shown by a study of thecurves of Figures 1 and 2. <strong>The</strong>se curves compare the peak and rootmean-squaresignal-to-noise ratio characteristics of two frequencymodulation systems having maximum frequency deviations* of 620 kilocycles, respectively. <strong>The</strong> curves were taken by varying thecarrier strength of the frequency-modulated signal generator andmeasuring the signal-to-noise ratio at the output of each receiver forthe full frequency deviation that each receiver was capable of. <strong>The</strong>radio-frequency input circuit of the two receivers was common sothat both receivers were on an equal basis as far as carrier strengthand input noise were concerned. <strong>The</strong> noise consisted of the thermalagitation and tube hiss within the receiver. For the curves of Figure1, the signal and noise in the receiver output were measured by meansof an oscilloscope which indicates peak voltages. For those of Figure2, an ordinary rectifier-type meter was used so that root-meansquaresignal-to-noise ratios were obtained.From these curves, it can be seen that, for carriers below a certainvalue, the low-deviation system produces a greater signal-to-noise ratioand is therefore more capable of "reaching down" into the noise toreceive a signal. It will be noted that both systems give a signal-tonoiseratio which is approximately proportional to the carrier strengthdown to a certain carrier strength. Below that strength there is arather sudden drop-off in signal-to-noise ratio. This drop-off is due toa phenomena which is peculiar to a frequency modulation system 1 andwhich is called the "improvement threshold" effect. Any frequencymodulation system has an improvement threshold above which the frequencymodulation gain or improvement is realized and below whichthe signal becomes submerged in the noise. <strong>The</strong> threshold occurs whenthe peak voltage of the carrier is equal to the peak voltage of the noisein the intermediate-frequency channel of the receiver. <strong>The</strong> full frequencymodulation improvement is not realized until the carrier isabout twice as .strong as the noise.andIt will be noted that the improvement threshold for the widersystems of Figures 1and 2 occurs at a stronger carrier strength thanthat for the narrower system. Hence, other things being equal, thewider system requires more transmitter power to produce a signalwhich will be above the threshold. <strong>The</strong> reason for this will be apparentwhen it is realized that the wider receiver must have a wider* "Deviation" in this paper refers to the amount of frequency shiftto one side of the carrier.1 Murray G. Crosby, "Frequency Modulation Noise Characteristics",Proc. of I.R.E., Vol. 25, No. 4, April 1937.
60 FREQUENCY MODULATION, Volume I-intermediate-frequency channel which inherently accepts a widerspectrum of the noise. <strong>The</strong> wider spectrum of noise has a larger peakvoltage so that the improvement threshold distance for the wide systemoccurs at a higher carrier strength. Thus the threshold for the widersystem of Figure 1 occurs at a carrier strength which is about twicethe corresponding strength for the narrower system.<strong>The</strong> differenee between the shapes of the curves of Figures 1 and2 is due to differences in crest factor (the ratio between the peak androot-mean-square voltage) of the noise. For carrier strengths abovethe improvement threshold, the crest factor is constant at a ratio ofabout 4.5. When the carrier is on the improvement threshold, the crestfactor is higher by an amount which depends upon the deviation ratio(the ratio between the maximum frequency deviation and the maximumaudio frequency of the system) of the frequency modulationreceiver. This increase in crest factor is caused by the fact that thehigher peaks of the noise approach equality with the carrier so thatthese peaks are at the threshold while the lower peaks produce acarrier-to-noise ratio which is above the threshold. When the peakvoltages of the carrier and noise approach equality, the effective frequencyvariation of the resultant wave rises to very high values andthe stronger of the two voltages assumes control of the receiver. Thus,if the noise is stronger than the signal the noise assumes control anddepresses the signal. Hence as the carrier is lowered towards thethreshold, the effective frequency deviation of the noise rises untilthe higher peaks begin punching holes in the signal. As the carrier isweakened still further, the weaker noise peaks also punch holes in thesignal so that it is submerged in the noise. <strong>The</strong> point at which thehighest peaks of the noise just begin to reach equality with the carrierpeak voltage, produces a "sputtering" type of noise which changes thecharacter of tube hiss or thermal agitation so that the improvementthreshold is easily recognized. Figures 3A and B show the wave formof the noise at the threshold (which has been called the "sputterpoint") and above the threshold respectively.When the noise is ignition or similar man-made noise the situationis similar to that shown by the peak signal-noise ratio curves ofFigure 1. In addition, the frequency modulation receiver has inherentto it a noise-silencing action which is at least as effective if not betterthan the best amplitude-modulation noise silencer. This noise-silencingaction is self-adjusting and is automatically adjusted for best operationas soon as the signal is tuned in. More detailed description of thisaction is considered elsewhere. 1 -8Murray G. Crosby, "<strong>The</strong> Service Range of Frequency Modulation'RCA Review, Vol. 4, No. 3, January 1940.
BAND WIDTH AND READABILITY 61Listening TestsWith the signal-to-noise ratio characteristics as described above,it can be seen that the answer to the question regarding the relativereadability obtainable with systems using different maximum frequencydeviations depends upon the magnitude of signal-to-noise ratio requiredfor a given readability. For instance, taking the curves of Figure 1,Fig. 3—Oscillograms of internal receiver noise appearing at the frequencymodulation receiver output. A is with carrier-to-noise ratio at the thresholdor "sputter point". B is with carrier-to-noise ratio above the threshold.if readability is obtainable on the narrower system for the signalstrengths which are below the threshold of the wider system, thenarrower system will have a range of superiority in readability ofweaker signals. As will be seen from the following curves, practicallyfull readability is obtained right down to the improvement thresholdof the narrower system. With the wider system, full readability is
&62 FREQUENCY MODULATION, Volume Inot obtainable until the signal is strong enough to reach the thresholdof the wider system.In order to determine the actual difference in signal readabilityfor systems using different frequency deviations, a listening test wasconducted on the two frequency-modulation systems which were usedfor Figures 1 and 2. A 5-kilocycle low-pass filter was inserted in theaudio output of both receivers so that one had a deviation ratio of 1.2and the other 4.<strong>The</strong> noise consisted of the thermal agitation and tubehiss originating in the radio-frequency circuits.<strong>The</strong> curves of Figure 4 show the results of the listening tests.—Readability numbers of the amateur RST system are plotted>-against
BAND WIDTH AND READABILITY 63<strong>The</strong> curves of Figure 5 were taken in the same manner as those ofFigure 4, but the two systems compared were the narrower frequencymodulationsystem of Figures 1 and 2 and its equivalent amplitudemodulationsystem. <strong>The</strong> maximum frequency deviation of the frequency-modulationsystem was 6 kilocycles and the audio band was 5kilocycles. It can be seen that the narrower frequency-modulationsystem gives a readability which ison the amplitude-modulation system.always greater than that obtainedIt is apparent from these tests that the optimum frequency deviationfor a frequency-modulation system designed to obtain maximumdistance for full readability is that which corresponds to a deviationratio of one.Fig.5—Readability comparison of a frequency-modulation system and itsequivalent amplitude-modulation system. Maximum frequency deviation = 6kilocycles. Audio band = 5 kilocycles.modulation system. To use a deviation ratio less than one would ofcourse impair the efficiency without a compensating benefit inSuch a system produces very nearly the same intermediate-frequencyand audio channel widths as the corresponding amplitude-reductionof band width since it would be equivalent to an amplitudemodulationsystem which employed a modulation percentage less than100.<strong>The</strong> results of other listening tests 2conducted by the writer haveindicated that the use of pre-emphasis and de-emphasis, as isused inthe present broadcast frequency-modulation systems, is of doubtfulvalue when the object is the mere transmission of intelligibility insteadof the enjoyment of a high-fidelity program. <strong>The</strong> peculiar triangularnature of the noise spectrum in the output of a frequency-modulationreceiver is apparently more tolerable than the same noise spectrumafter it has been made practically flat by the de-emphasis circuit. <strong>The</strong>results of the averaged observations of three observers showed thatabout 8 decibels more noise could be tolerated with the triangularfrequency-modulation noise than with the rectangular amplitude-modu-
64 FREQUENCY MODULATION, Volume Ilation noise. That is to say that when the intelligibility of voice isbeing received through fluctuation noise like tube hiss or thermalagitation, the same intelligibility may be received with 8 decibels morenoise of the triangular characteristic obtained from the output of afrequency-modulation receiver than with the flator rectangular noisecharacteristic obtained from the output of an amplitude-modulationreceiver. This advantage is lost when pre-emphasis and de-emphasisare used because the triangular noise spectrum is converted to arectangular spectrum.
VARIATION OF BANDWIDTH WITH MODULATIONINDEX IN FREQUENCY MODULATION*!ByMURLAN S. CORRINGTONHome Instrument Department, RCA Victor Division,Camden, N. J.Summary— Equations are derived for the carrier and side-frequencyamplitudes which are obtained when a carrier wave is frequency-modulated<strong>The</strong> bandwidth occupied by such a frequency-by a complex audio signal.modulated ivave is defined as the distance between the tivo frequenciesbeyond which none of the side frequencies is greater than 1 per cent ofthe carrier amplitude obtained when the modulation is removed.Curves are given to show the amount this bandwidth exceeds theextremes of deviation for a range of modulation indexes from 0.1 to 10,000,for sinusoidal, square, rectangular, and triangular modulation. For moreprecise definitions of bandwidth, curves are also given for side-frequencyamplitude limits of 0.1 per cent and 0.01 per cent of the carrier-waveamplitude. For complex modulation the total bandwidth can be estimatedby computing the bandwidth that would be required by each audio-frequencycomponent, if it were on separately, and adding the residts.IFIntroductionA CARRIER wave is frequency-modulated with a sinusoidalaudio voltage, an infinite number of side frequencies is produced.<strong>The</strong> carrier amplitude is reduced when the modulating voltageis applied, and may even become zero. If the deviation is increased,additional side frequencies are produced in both sidebands, and thedistribution of the intensities of the previous ones is changed. Fora single audio tone, the distance between side frequencies is alwaysequal to the audio frequency. When two or more modulating tonesare used simultaneously, side frequencies are produced which areseparated from the carrier by all possible combination frequencieswhich can be obtained from sums and differences of harmonics ofthe modulating frequencies. 12 Thus, if there are two audio tones offrequencies /i tand /x ,2the side frequencies are separated from the* Decimal classification : R148.2.•j-Reprinted from Proc. I.R.E., October, 1947.1Murray G. Crosby, "Carrier and Side-Frequency Relations with MultitoneFrequency or Phase Modulation," RCA REVIEW, vol. 3, pp. 103-106;July, 1938.- M. Kulp, "Spektra und Klirrfaktoren Frequenz- und Amplituden-Modulierter Schwingungen," Part I. Elek. Nach.-Tech., vol. 19, pp. 72-84;May, 1942.65
66 FREQUENCY MODULATION, Volume Icarrier by ± r^ ±s/x 2where r and s are positive integers or zero.Although, theoretically, an infinite number of side frequencies isproduced, in practice the ones separated from the carrier by a frequencygreater than the deviation decrease rapidly toward zero, so thebandwidth always exceeds the total frequency excursion, but neverthelessis limited. For large modulation indexes and a sinusoidal modulatingvoltage, the bandwidth approaches, and is only slightly greaterthan, the total frequency excursion.To show how the bandwidth changes with modulation index, exactmathematical expressions for the spectrum will now be obtained.<strong>The</strong> Spectrum of a Carrier Wave which is Frequency-Modulatedwith a Sinusoidal SignalWhen a carrier wave is frequency-modulated with a single audiotone, the equation for the voltage isD/\e = E sin I at -\— sin 2ir[it I(1)whereE = amplitude of the wave« = angular frequency of the carrier, radians per secondB = deviation, cycles per secondji= audio frequency, cycles per secondt = time in secondsD/jx = modulation index.This expression can be expanded in a spectrum consisting of acarrier and side frequencies, in accord with the result 3e = E ^ J n (D/fJ.) sin (£ + 2irn[it) (2)?l= COwhere J n (D/fx) is a Bessel function of the first kind of order n andargument D/y,.Graphs of the Bessel FunctionsTo plot the spectrum of a frequency-modulated wave for a givensA. Bloch, "Modulation <strong>The</strong>ory," Jour. I.E.E.,91, pp. 31-42; March, 1944.(London), Part III, vol.
VARIATION OF BANDWIDTH 67
68 FREQUENCY MODULATION, Volume Iin the band just inside the frequencies which correspond to the ends ofthe swings. When the deviation increases and the modulating frequencyremains constant, the total energy of the spectrum is spreadover a greater bandwidth, and the average amplitude of the side frequenciesmust decrease uniformly to maintain constant total energy inthe modulated carrier wave.<strong>The</strong> absolute maximum value of the Bessel function, for positivevalues of m, is shown by Figure 3. For a given modulation index, thismaximum occurs for a value of the order n slightly less than the modulationindex m. For example, for a modulation index of 1000 themaximum occurs at n = 991.91 and equals 0.06756. If the modulationindex is 10, the maximum occurs at n = 8.23 and equals 0.3210. <strong>The</strong>F '"
VARIATION OF BANDWIDTH0.0606 4998 7910n = k- 0.8086 1651 7466^--^/k0.0316 7351 0263k(4)A family of curves for modulation indexes from one to twenty isshown by Figure 4. <strong>The</strong> vertical scale represents the amplitude of thegiven side frequency for each modulation index. <strong>The</strong> curve of Figure1 can be obtained by cutting a section through the surface for a modulationindex of 10. Contour line A is for the constant value of theBessel function J n {D/n) =0.01. Similarly, the contour B corresponds12 3 0 II 12 13 14 13 16 IT l« |» 20MODULATION ll.'OTCX - RFig. 4—Side-frequency amplitudes.to J„(D/n) = 0.001, and contour C is drawn for J n (D/fi) — 0.0001.Curve D is shown for the order of the Bessel function equal to theargument. If the bandwidth of a frequency-modulated carrier wavewere just equal to twice the deviation, the side frequencies would notextend beyond curve D.It is evident that for a given modulation indexthe bandwidth extends beyond curve D (say to curve A), but that theintensities of the side-frequencies beyond curve D are decreasingrapidly.Curve E is drawn along the top of the first crest and gives the absolutemaximum value of the envelope of the side frequencies for eachmodulation index. This curve is also given by Figure 3. <strong>The</strong> curves F,
70 FREQUENCY MODULATION, Volume IG, H, I, J, and K show where the surface goes through zero, i.e., thezeroes of the Bessel functions.Definition of Bandwidth<strong>The</strong>oretically, there is an infinite number of side frequencies in thespectrum of a frequency-modulated carrier wave, but the amplitudesdecrease very rapidly beyond the last maximum. Point A on Figure 1corresponds to the value of
iVARIATION OF BANDWIDTH 71Example: Let the deviation be ± 50 kilocycles and the audio frequencybe 5 kilocycles. Find the bandwidth.<strong>The</strong> modulation index is 50/5 = 10. From curve A of Figure 5,the increase in bandwidth is approximately 0.42 or 42 per cent, so thebandwidth is approximately 2 (50) (1 + 0.42) = 142 kilocycles.Bandwidth Required for Complex ModulationIf several modulating tones are present simultaneously, the carrierwave can be expressed as[s D 8Ie = E sin < at + ^ — sin (2tt^ + e s ) r (5)I .=i J^swhere E is the amplitude of the wave,
oi.72 FREQUENCY MODULATION, Volume Imaximum deviation occurs when D 1and D 2 are in phase, the maximumbandwidth is given approximately by the sum of the two bandwidthsthat would be obtained with the two modulating tones used one at atime.<strong>The</strong> graph of Figure 6 shows the spectrum obtained when two tonesare present simultaneously, in accord with (7). <strong>The</strong> side frequenciesare no longer symmetrical about the carrier and, when they areseparated from the carrier by a frequency greater than D 1 + D 2 ,decrease rapidly toward zero. <strong>The</strong> upper sideband contains 57.9 percent of the power, the lower sideband 42.0 per cent, and the carrier0.1 per cent.General Method for Computing Side-Frequency AmplitudesIf the modulating signal isgiven, the variations of the phase angleINTI ,. IInn.*.I5t- (VP,—Fig. 6—Spectrum for complex modulation.—will be proportional to the integral of the signal. This integration canbe done directly, or by numerical integration, and the constant of integrationshould be chosen so the average value of the phase angle, overa complete cycle, is zero. If the phase angle is S(t) the frequencymodulatedcarrier wave can be expressed ase = E sin {o>t + S(t)}= E sin at cos S(t) + E cos wt sin S (t)(8)Expand in the Fourier seriescos S(t) — 2)i ={a n sin n6 + b„ cos nQ}(9)sin S(t)= 2 {c n)|—sin nO + d„ cos 7id}(10)
ItVARIATION OF BANDWIDTH 73where 6 = 2-rrjxt and /x is the repetition rate of the signal in cycles persecond. This expansion can be done by direct integration of the integralsfor the Fourier coefficients or by one of the numerical methodsfor harmonic analysis. 1 -'rs<strong>The</strong>ne=Esin + 2ttM/..) f } (11)which gives the side-frequency amplitudes directly.g >oil
:2.74 FREQUENCY MODULATION, Volume Iwhere m = D/jx. <strong>The</strong> equation for the frequency-modulated wavebecomese = E sin {at + S (t) } = E sin at cos S(t) + E cos at sin S (t)(12)Since cos S(t) is symmetrical about the origin, it can be expandedin a cosine series. Similarly, sin S(t) is skew symmetric about theorigin and can be expanded in a sine series. From Figure 8,cos S(t) = cos mdmx (ir — 8)-rrX ^ B1 — x^ 7r^ 8 ^ TTX— 2 &» cos 27rW,u.tm=0(13)where7Ty2 /^ ma;cos m0 cos ndd8 H— / cos (ir — 8) cos nOdd (14)^ .Ar 1 — »Similarly,sin jS(0 = sinrafl= sin-& = sin irmx.nmx(15)g 9 ^ ira;mx (it — 9)1-a;Tra; §§ 7rwherec n s in 2imuim=0(16)2 /" 2f mxc n= — / sin ra0 sin TC0d0 H / sin (ir — 8) sin w0d0. (17)" Jo * J-nx 1 — xWhen these results are substituted intoby(11), the spectrum is given
whereVARIATION OF BANDWIDTHmEn=— °° Tr(m — n) (mx — nx + n)E = amplitude of the wavem = modulation index = D//iD = maximum frequency deviation, cycles per secondji= repetition rate, cycles per second•f7Bsin (
VARIATION OF BANDWIDTH 77Pig. 9—Limits for side-frequency Fig. 10—Spectrum for rectangularamplitudes.modulation.kmost of the energy of the spectrum isconcentrated about the frequenciesthat correspond to the two limits of the deviation.Bandwidth Required for Rectangular ModulationEquation 18 shows that there is an infinite number of side frequenciesin the spectrum of a frequency-modulated wave with rectangularmodulation. As shown by Figures 9 and 10, the amplitudesof these side frequencies decrease uniformly beyond the limits ofthe deviations. If the edges of the band are denned as the points correspondingto a limiting amplitude of 0.0 IS, the bandwidth can becomputed directly from (18). For the case of square-wave modulation,x = 0.5, and the increase in bandwidth with decreasing modulationindex will be as shown by Figure 11. If a more strict definition ofbandwidth is required, curve B shows the width for the limitingamplitude 0.00LE 1 . Curve A is an accurate enough limit for mostpractical cases.90
78 FREQUENCY MODULATION, Volume I» 90 90 KX> 900 900 BOO 1000 203090X9000 10000M00ULATI0H INOEX m SFig.12—Variation of bandwidth with modulation index.If the maximum deviation is for one-fourth the time, x = 0.25,the curves of Figure 12 show the corresponding limits of the bandwidth.Other sets of curves, for other values of x, can be computedfrom (18).Itwill be noted that the band does not end as abruptly with rectangularmodulation as it did with sinusoidal modulation. <strong>The</strong> curvesof Figures 11 and 12 are much farther apart than the correspondingcurves of Figure 5.<strong>The</strong> Spectrum of a Carrier Wave which is Frequency-Modulatedwith a Triangular SignalWhen a uniformly spaced series of parallel bars, each one unitwide, is scanned at a uniform rate with a rectangular aperture ofunit width, as shown by Figure 13, the resulting signal is proportionalto the area of the bar covered by the aperture. <strong>The</strong> signal willhave a triangular wave form, as shown by Figure 14. During thetime the aperture is between the bars, the output will be constant. Asthe aperture starts to cover a bar, the output increases linearly until.PictureElement-fcH±1Fig. 13—Scanning of picture element.Fig. 14—Modulating signal.
—:VARIATION OF BANDWIDTH 79the aperture covers the entire bar. As the aperture moves on, thesignal decreases linearly until it reaches the previous constant value,and remains constant until the next bar is reached. If this wave formisused to modulate the frequency of a carrier wave, the variation ofthe phase angle will be 2ir times the integral of this curve of Figure14, as shown by Figure 15. <strong>The</strong> equation for this frequency-modulatedwave becomese = E sin {mt + S(t)}=E sin at cos S (0 + E cos
x80 FREQUENCY MODULATION, Volume IJrl i'sgn y S-iF-— sgn /3 S
VARIATION OF BANDWIDTH 81S(l)Fig. 15—Variation of phase angle.x = 1,the frequency varies linearly from one extreme of the frequencyexcursion to the other, while for sinusoidal modulation the frequency isnear the extremes of frequency a greater portion of the time. Asmight be expected, more of the energy in the spectrum is near the endsof the swing for sine-wave modulation than for triangular modulation.Bandwidth Required for Triangular ModulationIf the bandwidth is defined as the extremes of frequency beyondwhich none of the side-frequency amplitudes are greater than 1 percent of the carrier amplitude that would be obtained if the modulationwere removed, the variation of bandwidth with modulation index canbe computed from the equations for the side-frequency amplitudes.Curve A of Figure 17 shows how the bandwidth increases as the repetitionrate is increased. For a more precise definition of bandwidth,either curve B or curve C can be used.If x is reduced to 0.1, the signal becomes a series of triangularpulses with blank spaces between. Most of the sideband energy willoccur near the frequency which the carrier wave has between pulses,but the pulses will cause energy to be distributed on both sides of thisfrequency. Figure 18 shows the spectrum for a modulation index of 10.<strong>The</strong> amplitudes decrease much more slowly than in the case of triangularor sinusoidal modulation.ConclusionsWhen a carrier wave is modulated in frequency, an infinite numberof side frequencies is produced. As the modulation index is changed,
82 FREQUENCY MODULATION, Volume I
VARIATION OF BANDWIDTH 83times the actual frequency excursion.Curves are given to show thebandwidth for modulation indexes from 0.1 to 10,000 for sinusoidal,square, rectangular, and triangular modulation. For a more precisedefinition of bandwidth, curves are also given for amplitude limits of0.001B and 0.0001S.When several modulating tones are on simultaneously, the side frequenciesare produced at frequencies separated from the carrier by allcombination frequencies that can be obtained by taking sums anddifferences of all the harmonics of the tone frequencies. <strong>The</strong> samecurves can be used to determine the bandwidth when several audiotones are used simultaneously, since the bandwidth will be equal approximatelyto the sum of the bandwidths for each tone separately.
84 FREQUENCY MODULATION, Volume IGENERALIZED THEORY OF MULTITONEAMPLITUDE AND FREQUENCY MODULATION*!ByL. J. GlACOLETTOResearch Department, RCA Laboratories Division,Princeton, N. J.Summary<strong>The</strong> frequency spectrum produced by single-tone, two-tone, and multitonemodulating signals in the case of amplitude -modulation, frequencymodulation, and combined amplitude and frequency modulation are studiedin turn. Amplitude, symmetry, and energy of sidebands for the differentcases are considered. Extensive computations are made of frequencyspectrums, and these are compared with actual frequency spectrumsobserved by means of a spectrum analyzer. <strong>The</strong> agreement between computedand measured frequency spectrums is very close.(H pages; 21 figures)* Decimal Classification: R148.1 X R148.2.f Proc. I.R.E., July, 1947.
FREQUENCY MODULATION PROPAGATIONCHARACTERISTICS^ByMurray G. CrosbyRCA Communications, Inc., Riverhead, N. Y.Summary— Early work on frequency modulation is described whereinthe propagation characteristics of frequency modulation were determinedfor frequencies between 9000 and 18,000 kilocycles. Oscilloscopic wave formand aural program observations, taken on a circuit between California and<strong>New</strong> York, showed that frequency modulation is much more distorted by theeffects of multipath transmission than is amplitude modulation. <strong>The</strong> distortionis greatest at the lower modulation frequencies and higher depthsof modulation where the side frequencies are most numerous.Oscilloscopic observations of the Lissajou figures formed by placing theoutputs of receivers connected to spaced antennas on opposite oscilloscopeplates showed that the diversity characteristics of frequency modulation aresimilar to those of amplitude modulation. . That is, the detected outputs ofthe receivers tend to remain in phase for the lower modulation frequenciesand become more phase random as the modulation frequency is increased.However, this tendency is almost obliterated on the lower modulation frequenciesof frequency modulation by the presence of unequal harmonic distortionin the two receiver outputs.<strong>The</strong>ory is given analyzing the distortion encountered in a two-pathtransmission medium under various path amplitude and phase relation conditions.<strong>The</strong> theory explains phenomena observed in the tests and pointsout the extreme distortion that can be encountered.INIntroductionTHE annals of radio, most of the work done on frequency modulationhas been of a theoretical nature 1 - 2 - 3and very little has beenoffered as a result of any experimental development.Considerable theory has also been presented in the consideration ofthis type of modulation as a defect of amplitude modulation. 3 - 4 - 5 - 6 - 7* Decimal classification: R630.ll.f Reprinted from Proc. I.R.E., June, (1936).John R. Carson, "Notes on the theory of modulation," Proc. I.R.E.,1vol. 10, pp. 57-64; February, (1922).2Balth van der Pol, "Frequency modulation," Proc. I.R.E., vol. 18, pp.1194-1205; July, (1930).3 Hans Roder, "Amplitude, phase, and frequency modulation," Proc.I.R.E., vol. 19, pp. 2145-2176; December, (1931).R. Bown, D. K. Martin, and R. K. Potter, "Some studies in radiobroadcast transmission," Proc. I.R.E., vol. 14, pp. 57-131; February, (1926).5 R. K. Potter, "Transmission characteristics of a short-wave telephonecircuit," Proc. I.R.E., vol. 18, pp. 633-648; April, (1930).J. C. Schelleng, "Some problems in short-wave telephone transmission,"Proc. I.R.E., vol. 18, pp. 933-937; June, (1930).7T. L. Eckersley, "Frequency modulation and distortion," ExperimentalWireless and <strong>The</strong> Wireless Engineer, vol. 7, pp. 482-484; September, (1930).A
86 FREQUENCY MODULATION, Volume Imore recent contribution 8 includes an experimental investigationchecking theory on the detection products produced in a frequencymodulation receiver. It is the purpose of this paper to report on develpmentwork undertaken by the engineering department of R.C.A.Communications, Inc.,wherein the propagation characteristics of frequencymodulation were determined for a circuitand <strong>New</strong> York.Early work done on frequency modulation within the<strong>Radio</strong> Corporationwas that of H. 0. Peterson 9between Californiain which a laboratory frequencymodulation circuit was set up. Later, in an attempt to reduce fadingby frequency diversity, one of the telegraph transmitters on the Argentinaand Brazil circuits was frequency modulated. Finally a definitedevelopment program was undertaken consisting of the developmentof a frequency modulation transmitter at the Rocky Point transmittingresearch and design laboratories and the development of a suitablereceiver at the Riverhead receiving research and design laboratories.After the transmitter and receiver were developed to a sufficientstage to permit a long-distance test to determine the propagation characteristicsof frequency modulation, the transmitter was shipped toBolinas, California, where it was operated by J. W. Conklin who hadassisted in its development. <strong>The</strong> transmissions were observed at theRiverhead station on the receivers developed by the author. <strong>The</strong> testswere carried out in1931 during the months from March to June, inclusive.Propagation TestsIn the tests carried on between Bolinas and Riverhead, two majorproblems presented themselves for solution.modulation withstand the ravages of fading.First, how would frequencySecond, could the detectedoutputs of two frequency-modulation receivers, fed by spaced antennas,be added directly 10 in a diversity 11 receiving system; that is, would thedetected audio outputs remain in phase so that they could be combineddirectly, or would some kind of diversity antenna choosing device,is in present use, be necessary.It is interesting to note that in this article Eckersley makes the followingprediction from his theory which agrees with the results obtained in thework described in this paper : "It will easily be seen that this results in mostappalling distortion, and renders futile any attempt to use even pure frequencymodulation in any transmission where appreciable echo delays (ofthe order of two or three milli-seconds) are present."8 J. G. Chaffee, "<strong>The</strong> detection of frequency modulated waves," Proc.I.R.E., vol. 23, pp. 517-540; May, (1935).9H. O. Peterson, U. S. Patent No. 1,789,371.10 C. W. Hansell, U. S. Patent No. 1,803,504.11H. O. Peterson, H. H. Beverage, and J. B. Moore, "Diversity telephonereceiving system of R.C.A. Communications, Inc.," Proc. I.R.E., vol.19, pp. 562-584; April, (1931).as
PROPAGATION CHARACTERISTICS 87In order to solve the problem of the effect of fading on frequencymodulation, oscilloscopic wave form and aural program observationswere made on the tone and program modulation after it had traversedthe radio circuit from California to <strong>New</strong> York. In this manner theinstantaneous harmonic distortion could be observed.<strong>The</strong> diversity problem was answered by applying the outputs oftwo receivers, fed by spaced antennas, to opposite oscilloscope plates.Hence, by proper interpretation of the Lissajous figures obtained, therelative phases and amplitudes of the two outputs could be determined.<strong>The</strong> TransmitterTo obtain the frequency modulation, a circuit of the type shown inFig,' 1 was employed. This type of modulator was used as the master'-
88 FREQUENCY MODULATION, Volume Icoupling between L\ and L 2 ,a linear frequency modulation may beobtained.During the frequency modulation transmission the transmitteramplifiers and frequency doublers were operated class C throughoutso as to limit off any amplitude modulation introduced in the modulatoror otherwise.Fig. 2— Circuit diagram of frequency modulation receiver showing the conversionfilters and detectors.An amplitude modulating stage was included inthe transmitterso that the transmitter could be adjusted for amplitude modulationand direct comparison could be made between frequency modulationand amplitude modulation.<strong>The</strong> ReceiverA schematic diagram of the frequency modulation receiver is shownin Fig. 2. Energy at the superheterodyne intermediate frequency is fedto the two coupling tubes, A and B, having the conversion filters forconverting the frequency modulation into amplitude modulation inFREOUENCY-Fig. 3— Characteristics of the conversion filters used to convert frequencymodulation into amplitude modulation for detection.their plate circuits. <strong>The</strong> characteristics of these two filters are given bythe curves A and B in Fig. 3. <strong>The</strong> carrier frequency F c ,is tuned to themiddle of the linear portion of the sloping characteristic formed by thetwo tuned circuits connected as shown. By adjusting the tuned circuitsso that the points of maximum and minimum output fall outside of theintermediate-frequency channel, only the linear portion of the characteristicsare utilized. <strong>The</strong> outputs of these filters are fed to the detectors
PROPAGATION CHARACTERISTICS 80C and D of Fig. 2 whose audio outputs are combined by the transformerT in push-pull or parallel combination, depending upon the switch S.With the switch in the push-pull position, frequency modulation maybe received and amplitude modulation balanced out. <strong>The</strong> balance obtainableon amplitude modulation, however, is complete only for thecondition of no frequency modulation present. As soon as the carrieris frequency deviated from its unmodulated position, the carriers fed tothe detectors are no longer balanced due to the fact that the slopingfilters have opposite slopes. Hence the balance is thrown off by anamount proportional to the frequency deviation from the unmodulatedcarrier position, and the resultant balance is an average between thebalanced and unbalanced conditions. With the switch in the push-pullposition, second harmonic square-law detector distortion is completelyFig. 4—Block diagram of receiver arrangement used in determining the phaserelation between the detected outputs from receivers connected to spacedantennas.balanced out. With the switch in the parallel position amplitude modulationmay be received and frequency modulation balanced out.<strong>The</strong> intermediate-frequency amplifier of the receiver was adaptedfrom broadcast components and had a twelve-kilocycle pass band.Consequently the maximum frequency deviation was limited to onehalf of this intermediate frequency channel or six kilocycles. An experimentalharmonic analysis of the receiver showed that it was capableof this amount of deviation without serious distortion.An amplitude limiter was arranged so that it could be switched inand out of the intermediate-frequency circuits. This limiter consistedof a separate multistage intermediate-frequency amplifier feeding atube with lowered element voltages so that the tube would be heavilyoverloaded and its output would be constant regardless of the changesof the input. Thus amplitude modulation could be removed. Thismethod of removing amplitude modulation has an advantage overthe balance obtained with the opposite sloping conversion nitersthat the amplitude modulation is completely removed in the presenceof frequency modulation as well as in the unmodulated condition.in
90 FREQUENCY MODULATION, Volume IFor the diversity experiments, an arrangement as shown in Fig. 4was used. Two complete frequency modulation receivers were fed bytwo harmonic wire antennas spaced 450 feet apart. <strong>The</strong> detected outputsof the tone modulation were fed to the opposite oscilloscope plates.Hence, by noting whether the oscilloscope diagram was a line in thesecond and fourth quadrants, a circle,or a line in the first and thirdquadrants, the relative phase relation of the two detected outputs couldbe determined as being in phase, ninety degrees out of phase, or 180degrees out of phase, respectively. (See Fig. 5a, b, c, d, and e.)For the wave form observations, the output of a single receiver wasapplied to one set of oscilloscope plates and a timing voltage to theother. Quality distortion was also checked by the aural observation ofmusic which was transmitted by the frequency and amplitude modulationtransmitters./ o o ^Fig.5—Lissajou figures obtained with various phase relations and frequencyratios between voltages applied to opposite oscilloscope plates.Wave Form DataDay and night observations were made using music and tone modulationon frequencies of 18,020, 13,690, and 9010 kilocycles. <strong>The</strong> generalconclusions derived were that frequency modulation is far more susceptibleto the effects of selective fading than amplitude modulation.On music, the bass and lower notes were distorted and jumbled togetherwhile the violin and the other higher solo instruments came throughfairly well. <strong>The</strong> intelligibility of speech was very low; in some cases asignal which gave fair intelligibility on amplitude modulation was practicallyunintelligible on frequency modulation. <strong>The</strong> distortion seemedto be proportional to the depth of modulation, since a sort of blastingeffect was observed on the modulation peaks, and transmissions withlowered deviation came through better than those with higher deviation.<strong>The</strong> distortion also seemed to be greatest during fading minimum^at which time "bursts" of distortion would appear; this condition wasalso present to a lesser extent on amplitude modulation.
PROPAGATION CHARACTERISTICS 91<strong>The</strong> effect due to limiting seemed to be the indication that the distortionwas caused by a change in the instantaneous frequency deviationof the wave and not due to an added amplitude modulation. Thiswas evidenced by the fact that the limiter effectively removed all amplitudemodulation introduced by fading, but the extreme distortionremained with little or no perceptible difference attributable to thelimiter.<strong>The</strong> general result of the use of different radiation frequencies overthe circuit was to indicate that the quality of modulation was most impairedon the frequencies where the selective fading was most marked.Of the three frequencies observed, 18,020 kilocycles showed the leastamount of selective fading, 9010 the greatest, and 13,690 a mean betweenthe other two. Consequently, the quality of frequency modulationon 18,020 kilocycles was only occasionally inferior to that on amplitudemodulation. On 9010 kilocycles there was scarcely an intervalof good quality on the frequency modulation, and the amplitude modulationwas also considerably distorted. 13,690 kilocycles was considereda representative frequency for the observations, since it presentedperiods of extremely poor quality along with periods of fairly goodquality. Consequently, the oscillograms were taken on the 13,680-kilocycle radiations.Fig. 6 gives the oscillograms showing the effects of distortion fadingon wave form. From a comparison of the 300- and 1000-cycle oscillogramstaken on frequency modulation, it is apparent that the amountof distortion on 300 cycles is much greater than that on 1000 cycles.At the lower modulation frequencies on frequency modulation, theharmonics were comparable to and stronger than the fundamental fora large percentage of the time. As the modulation frequency was increased,the amount of distortion decreased until at modulation frequenciesabove about 3000 cycles, little or no harmonic distortion wasencountered. One of the reasons for this absence of harmonic distortionon the higher frequencies is probably the fact that the pass band of thereceiver intermediate-frequency amplifier was twelve kilocycles andthat of the audio amplifier six kilocycles. Hence, for modulation frequenciesabove 3000, the side bands above the first were eliminated bythe intermediate-frequency filter and the harmonics were eliminatedby the audio system. <strong>The</strong> reason for the excessive distortion at thelower modulation frequencies of frequency modulation is no doubt dueto the effects of multipath transmission in disturbing the phase relationsbetween the many side frequencies produced by these lower modulationfrequencies.Fig. 6J shows a wave form taken on amplitude modulation when
92 FREQUENCY MODULATION, Volume Iaural observations indicated that the carrier and not the side bandshad faded. <strong>The</strong> presence of second harmonic is very evident. It hasbeen conjectured that frequency modulation might be less susceptibleto the effects of carrier fading because of the fact that the modulatedenergy is distributed among the side bands to a greater extent; consequently,the detected output is not as dependent for its value upona single frequency in the transmission medium as is amplitude modulation.<strong>The</strong> observations did indicate that with frequency modulation,frWmiFig.6— Frequency and amplitude modulation wave form oscillograms showingthe distortion due to fading.A, B, and C. Amplitude modulation, 300 cycles.D, E, F, G, and H. Frequency modulation, 300 cycles.I, J, and K. Amplitude modulation, 1000 cycles.L, M, N, O, and P. Frequency modulation, 1000 cycles.the output was more constant; the quality of this output, however,prevented itsconstancy from being of any value for the purpose forwhich it was intended. This observation tends to indicate the advantageof systems wherein telegraph transmitters are frequency modulatedto effect a frequency diversity to reduce fading.Diversity DataIn general the diversity experiments indicated that on both frequencyand amplitude modulation the lower modulation frequenciesproduced outputs from the two receivers which remained in phase. Asthe modulation frequency was increased, the tendency toward phase
PROPAGATION CHARACTERISTICS
94 FREQUENCY MODULATION, Volume Itained on frequency modulation with a 300-cycle modulation frequency,given in Fig. 7C, E, F, G, and H, obtain their grotesque distortionsfrom the presence of different harmonic distortions in the two receiveroutputs. Thus one receiver might be receiving a signal producing a purefundamental tone only, whereas the other receiver might be receivinga signal rich in harmonics; consequently, the diagram is distorted accordingto the difference in the amounts of harmonic content presentat the instant of exposure. <strong>The</strong> effect produced by this unequal harmoniccontent on the two sets of oscilloscope plates can be seen from astudy of the Lissajou figures given in Fig. 5 f, g, h, i, and j. Thus thediagram of Fig. 5 f might be formed by the condition of fundamentaltone from one receiver and second harmonic from the other, or thediagram of Fig. 5i by second harmonic from one receiver and thirdharmonic from the other. <strong>The</strong> rapid shift from one harmonic relationto another together with the presence of complex instead of simplewave forms on the two sets of plates makes possible erratic and grotesquepatterns. 12 This effect was apparent to such a degree on frequencymodulation that difficulty was experienced in determining thephase tendency of the fundamental tones. <strong>The</strong> effect was only occasionallynoticeable on amplitude modulation.<strong>The</strong> diagrams given in Fig. 7 I and J for a modulation frequency of1000 cycles, show how the higher modulation frequencies on amplitudemodulation are marked by phase differences which are not present onthe lower tones. <strong>The</strong> higher tones on frequency modulation given inFig. 7 K, L, M, and N for a modulation frequency of 1000 cycles,and in Fig. 7 O and P for a modulation frequency of 5000 cycles, alsoindicate marked phase differences and only a slight indication of differentharmonic distortions. Amplitude and frequency modulationshowed about the same amount of phase distortion on the higher modulationfrequencies.<strong>The</strong>oryIt is well known that the cause of fading distortion, taking place inthe range of frequencies used in these tests, is due to multipath transmissionin which the signal is coin-eyed to the receiving antenna bymeans of more than one path. <strong>The</strong>se paths consist of refractions orreflections from the conducting layers of the ionosphere. Since theseconducting layers vary in height and since the signal may follow acourse consisting of various numbers of ricochets between the ionosphereand the earth, the signal traveling over the longer path is given12 A more complete set of these Lissajou figures may be found in the book,"High-Frequency Measurements," by A. Hund, pp. 71-75; McGraw-Hill,(1933).
zPROPAGATION CHARACTERISTICS 95a time lag with respect to that, traveling over the shorter path. Hencethe frequency modulated signal traveling over an earlier path may beexpressed by/ Pd \e = Ea sin I wt -) cos pt 1(1)\ F m /where co = 2wXF c ,F c= carrier frequency, Fd = peak frequency deviationdue to modulation, F m = modulation frequency, and p = 2irXFm .<strong>The</strong> signal traveling over a later path may be expressed bye = E 1 sin < cot + /3 -\ cos (pt + a)\ (2)\ F m )where /3 and a take into account the time delay imparted to the carrierwave and the modulation, respectively.Considering only a two-path case first, the two waves given by (1)and (2) may be combined into a single resultant wave by means of thecosine law resulting in/ JTd E,e= X E + E{ + 2E E - 2 Icos \cos (pt + a)+p cos pt'I F mF msinsin < — cos (;j/+«)+(3 cos ptFj [F m F mcot-\ cos /;/+tan -1F m E LFd Fa(-cos < — cos (pl-\-a)-\-j3 cosptE, -'-'1 \F W m F* m(3)Applying the sum and difference formula for the cosine, calling Eo/Ei= li, and 2F,i/Fm sin a/2 = Z, givessine= A/E 2 + E l-+ 2E E 1 cos jzsin (pt + — J-/3Jsin
96 FREQUENCY MODULATION, Volume Iwl H cos pt — tan-1Fm= F C +F d cos p< — -m\ff + cos «L~sin( />/ +— )-(3>2ttrf
PROPAGATION CHARACTERISTICS 97When R is large compared to one, (5) becomes:/ = F c + Fd cos pia2 sin — Fj9A'cos (pi + ~j cos issinf p< + y)-'4•(S )By an application of the addition formulas for the sine and cosine, togetherwith the Besscl function expansions for cos (x sin )and sin (x sin$) and the recurrence formulas for J„(x), (8) may be transformed intothe following:f = F, + Fj cos pta2F„, cos —o rRcos/3-j £ (2« + l)./ : „ +1 (-) cos (2» + l)(/;/+-0j-sin 0-j Y. 2nJ in sin 2// Pt + ^~)\ (0)Thus when
98 FREQUENCY MODULATION, Volume Iwave form. <strong>The</strong> increase of the distortion with increase in F d/Fmagrees with the observations that the lower modulation frequencieswere the most distorted and that the distortion seemed to be proportionalto the depth of modulation. Thus for modulation frequenciesgreater than one half the maximum modulation frequency where F d/Fmcan not be greater than two, a wave form similar to Fig. 8(D) would befi =
PROPAGATION CHARACTERISTICS 99Fd/Fm since sin a/2 enters in the quantity Z in the same manner asdoes the quantity F d/F,„. However it can also be seen that the distortionis zero when a is equal to 0, 2w, -ir, etc. Thus the most severe distortionoccurs when a = ir radians or 180 degrees. Since a = 2irDFm ,where D = timc delay between the two paths, for a given time delaysin a/2 will go through maximums and minimums as the modulationfrequency is varied. Hence bands of maximum and minimum distortionwould be expected throughout the modulation frequency band.By an application of the same theoretical method, the distortiondue to three or more paths could be determined. <strong>The</strong> addition of a wavearriving over the third path to the resultant given by (4) would addanother arc-tangent term to the phase of the resultant in which Rwould be equal to the ratio between the resultant amplitude of thefirst two paths and the amplitude of the third. This would add distortionwhich would result in a wave form undoubtedly more distortedthan the two-path case. However, the degree of distortion would beproportional to the same parameters as the two-path case since the distortionterm added by each path issimilar to that produced by thefirst two paths.<strong>The</strong> distortion encountered by amplitude modulation in multipathtransmission has been theoretically considered in previous literature. 13<strong>The</strong> general results of this theory are that the distortion consists of achange of the amplitude of the fundamental modulation frequency togetherwith the introduction of second harmonic distortion. However,the higher order harmonic distortion so prone to appear in frequencymodulation, and depending upon the ratio F d /F m , is not present. Itis this extreme high order harmonic distortion which makes the receptionof frequency modulation over a multipath medium far moredistorted than the reception of amplitude modulation over the samemedium.Conclusions<strong>The</strong> general conclusion derived from the tests and theory is that oncircuits where multipath transmission is encountered, frequency modulationis impracticable. This, of course, precluded the use of frequencymodulation on frequencies which are transmitted by refraction fromthe Kennelly-Heaviside layer. For the frequencies in the immediatevicinity of eighteen megacycles, where transmission is largely by a13Charles B. Aiken, "<strong>The</strong>ory of the detection of two modulated waves by alinear rectifier," Proc. I.R.E., vol. 21, pp. 601-629; April, (1933). <strong>The</strong> "Case ofIdentical Modulating Frequencies" considered on page 616 covers exactly thesame situation as the two-path multipath transmission case.
:100 FREQUENCY MODULATION, Volume Isingle path, and where echo is small when it is present, 11 fair successwould be possible with a frequency modulation circuit where the modulationfrequencies were not higher than about 5000 cycles. However,the logical place for frequency modulation is on the ultra-high frequencieswhere the only multipath transmission that exists 15 is thatdue to the direct ray and the ray reflected from the ground and othernear-by objects. On the other hand, even this multipath transmissionon ultra-short waves will introduce appreciable distortion to modulationfrequencies of the order used in television. This distortion wouldbe particularly severe in the case where the transmitter and receiverare both at rather high elevations, but would have the possibility ofelimination by the use of directivity to discriminate against one ofthe rays.<strong>The</strong> specific conclusions of the tests may be summarized as follows<strong>The</strong> distortion is most severe on the lower modulation frequencies andon the lower radiation frequencies. <strong>The</strong> distortion was equally severewith or without limiting. <strong>The</strong> diversity tests showed a tendency forthe two receivers to stay in phase at the lower modulation frequencies,but this tendency was almost obliterated by unequal harmonic distortionon the two receivers. <strong>The</strong> higher modulation frequencies and thelower radiation frequencies showed the most random phase characteristics.<strong>The</strong> specific conclusions of the theory concerning the two-pathcase may be summarized as follows : When the two paths are exactlyequal in amplitude, provided conditions are such that the resultantamplitude does not go to zero, the effect is a change in the effectivefrequency deviation with no harmonic distortion. When the strengthof one path is great compared to the other, odd harmonics are introducedwhen the phase difference between the carriers is zero and evenharmonics are introduced when the phase difference is ninety degrees.<strong>The</strong> most destructive distortion occurs when the amplitudes of thepaths are not quite equal. Under this condition the distortion is greatestfor the higher values of F d /F m and for phase relations such that thephase differences between the modulation frequencies and betweenthe carrier frequencies are both 180 degrees.Acknowledgment<strong>The</strong> author is indebted to Messrs. H. H. Beverage and H. O. Petersonunder whose guidance the work of this paper was carried out.14T. L. Eckersley, "Multiple signals in short-wave transmission," Pboc.I.R.E., vol. 18, pp. 106-122; January, (1930).16Bertram Trevor and P. S. Carter, "Notes on propagation of waves belowten meters in length," Pboc. I.R.E., vol. 21, pp. 387-426; March, (1933).
A CATHODE-RAY FREQUENCY MODULATIONGENERATOR*!ByEOBERT E. SHELBYjVideo Operations Engineer,National Broadcasting Company, Inc.Summary— A device similar to a cathode ray tube is described whichmakes possible conversion from amplitude to phase shift modulation witha maximum phase shift of many times 360°. <strong>The</strong> modulating signal altersthe rotating electron stream in such a way as to produce phase changes inthe multi-piece anode current. A suitable network in the audio input effectsthe conversion from phase to frequency modulation.y wnjHE device herein described isa means of frequency- or phase-I modulating a carrier signal obtained from an oscillator of con-H- stant frequency and phase, such as a crystal-controlled oscillator.<strong>The</strong> majority of the known methods for generating frequency orphase modulation involve variation of the frequency or phase of themaster oscillator. <strong>The</strong>re is one well-known method of producing phasemcdulation of a carrier obtained from a constant source which involvesthe addition of two voltages of the same constant frequency havinga constant phase difference of 90°, one voltage having constant amplitudeand the other varying in amplitude with the modulation signal.This method is limited to maximum phase shifts of the order of30°, which means that in order to obtain a large shift at the final carrierfrequency, it is necessary to employ frequency multiplication oflarge ratio. <strong>The</strong> method proposed here does not have this limitation.<strong>The</strong>oretically it should give distortionless phase shift of many times360°.Structurally the device consists of an electron gun, two sets of electrostaticdeflection plates (or magnetic deflection coils), and a targetanode of special design, enclosed in an evacuated container of suitablesize and shape. A typical arrangement is shown schematically inFigure 1. It will be seen that the device illustrated is similar to aconventional cathode ray oscillograph tube. <strong>The</strong> only fundamental* Decimal Classification: R630.1.t Reprinted from Electronics, February, 1940.J Now Director of Television Engineering Operations, National BroadcastingCo., Inc., <strong>New</strong> York, N. Y.101
102 FREQUENCY MODULATION, Volume Idifference is the novel design of the target anode. Figure 2 illustratesone form which the target anode may have. It consists of two (ormore) metallic plates with curved edges, upon which the electronsfrom the electron gun impinge. In order to obtain phase modulationin which the angular shift is a linear function of the modulationamplitude the edges of the plates have a curvature given by the polarequationr =
FREQUENCY MODULATION GENERATOR 103anode, just as in the case of oscillograph tubes and picture tubes. <strong>The</strong>electron stream is sharply focused on the target anode and when thereis no voltage applied to the electrostatic deflecting plates it is adjustedto strike the exact geometrical center of the target anode. <strong>The</strong> inputs,which consist of two carrier waves of equal frequency and almost equalamplitude but differing in phase by 90° and having the same amplitudemodulation, are applied to the two sets of electrostatic deflecting plates.Figure 3 illustrates one means of supplying the inputs. <strong>The</strong> outputappears in the target anode circuit, across the impedance Z A. If Z A is apure resistance the output voltage appearing across it will be a flattoppedwave. By using a target anode composed of a larger number ofcurved sections the fundamental frequency of the flat-topped outputFig. 2—Typical target anode, consisting of two metal plates divided by apair of Archimedian spirals. <strong>The</strong> cathode ray beam scans the target in acircle of variable radius, producing square waves in the output.wave may be made any desired multiple of the input frequency. Thus itis seen that, if desired, frequency multiplication may be obtainedduring the process of converting amplitude modulation into frequencyor phase modulation.For a more detailed explanation of the way in which amplitudemodulation is translated into phase modulation, we refer now to Figure3. First, with no modulation, the phase shifting network and amplitudecontrols are adjusted so that the electron beam describes a circle on thetarget anode. If the master amplitude control is adjusted so that thiscircle is of the size designated by c x(Figure 2) then the voltageappearing across Z A will be as shown in Figure 4A. Note that the
104 FREQUENCY MODULATION, Volume Ielectron stream passes from one segment of the target to the other atpoints p xand p/. If now the two deflecting voltages are decreased50 per cent by changing the master amplitude control, all other controlsbeing left the same, the locus of the end of the electron stream will bec 2 and the voltage across Z A will be as shown in Figure 4B. <strong>The</strong> electronstream now passes from one segment of the target to the other atpoints p2and p.,'. Likewise if the master amplitude control is adjustedto give voltages 50 per cent greater than those which gave the locus c 1(then c 3 will be the new locus, the electron stream will pass from one'target segment to the other at points p s and p- A and the voltage appearingacross Z A will be as shown in Figure 4C. Now, if the masteramplitude control is reset so that the electron circle falls on c 1and a
FREQUENCY MODULATION GENERATOR 105It should be noted that this device isfundamentally a generator ofphase modulation — not frequency modulation. However, any phasemodulator may be made to produce the equivalent of frequency modulationby means of a network in the audio input having a characteristicthat is inversely proportional to frequency. It will be understood thatwhenever the cathode ray modulator is referred to as a generator offrequency modulation, the use of such a network is implied.Variation of the anode voltages will cause the sensitivity of the electronstream to vary so that for constant voltages on the deflectingplates the size of the circle described on the finalanode by the electronstream will vary as the anode voltages vary, thereby producing a form\*fWtf-Pig. 4—Square wave outputs of the generator, lettered to correspond withthe scanning circles shown in Fig. 2, opposite. <strong>The</strong> phase shift results infrequency modulated waves when the signal is passed through a frequencymultiplier.of phase modulation. This means that the d-c voltages supplied to theelectron gun must be well-filtered and free from fluctuations.Auxiliary electrodes may be added to the modulator tube for controlor monitoring purposes. For example a fluorescent screen may beprovided beyond the target anode, so that the electron stream will producea pattern upon it when it passes between segments of the anodeor beyond the outer edges of the anode plates. Additional electrodes,located in the same plane as the final anode, but electrically separatefrom it, may be used for adjusting the modulator and also for indicatingovermodulation. Such an electrode, of small area, located at thegeometrical center of the anode (where the anode plates are cut away)is useful in centering the electron stream. A narrow annular ring
106 FREQUENCY MODULATION, Volume Iaround the outside of the main target facilitates adjustment of thephase shifting network to obtain circular deflection of the electronstream. Many other auxiliaries are possible.<strong>The</strong> description so far has related to the production of modulationin which the phase shift is directly proportional to the modulating voltage,but the system is quite flexible in this respect. By use of a properlyshaped target, the phase shift may be made any reasonable function ofthe modulating voltage, this being determined by the curvature of theedges of the target plates and the nature of the path traced on thetarget by the electron stream.<strong>The</strong> amplitude of the flat-topped output voltage wave may be variedindependently of the frequency (or phase) modulation by varying thed-c potential applied to the control grid. If it is desired to amplitudemodulate the output wave in addition to or instead of phase modulatingFig. 5—Early form of the cathode-ray frequency modulation generator,mounted in a standard oscilloscope tube envelope. <strong>The</strong> target anode is composedof spirals which make one complete turn.it in the manner described, this may be done readily by applying theamplitude modulation signal to the control grid, provided the electrongun is so operated that the rate of electron emission from the gun is alinear function of control grid voltage over the operating range.<strong>The</strong> photograph of Figure 5 shows the general appearance of anearly model of this device constructed by the Eadiotron Division of theRCA Manufacturing Co. It consists of a standard type cathode rayoscilloscope tube with a spiral target of the type specified above sealedinto the large end in place of the usual fluorescent screen. <strong>The</strong> targetwas constructed by applying a coating of platinum to a sheet of mica ofthe kind used for Iconoscope mosaics and scribing the separating linein the platinum surface to give the proper shape to the two electrodes.<strong>The</strong> target is mounted by wire supports which are sealed into the large
FREQUENCY MODULATION GENERATOR 107end of the tube. Electrical connections to the two electrodes of thetarget are brought out through this same seal.<strong>The</strong> spiral of this target was designed to give a maximum over-allphase shift of 360°—that is to say, for this particular target the value1of a in the equation r = a 8 is — inches per radian (the diameter ofITthe target is approximately four inches). In order to facilitate adjustmentand to judge operating performance four concentric circles andsixteen radial lines were marked on the surface of the target withwillemite. <strong>The</strong> entire surface of the target was also covered with avery thin coating of willemite. This results in the electron beamtracing out a visible path on the target, which is helpful in testing thetube.Pig. 6—Later form of the generator. <strong>The</strong> spiral anode makes five completeturns, and hence the degree of phase shift, for a given change in scanningradius, is proportionately increased.In constructing this tube the ftadiotron engineers made provisionfor utilizing secondary emission from the target anode to provide additionaloutput. This was done by providing a separate collector forsecondary electrons in the form of a coating on the inner wall of thetube.Figure 6 shows a photograph of a later model. <strong>The</strong> general designis the same except that the target anode consists of a conducting coatingdeposited directly upon the inner surface of the large end of thetube and the spiral in this case contains five complete cycles. <strong>The</strong> configurationof this target is shown by Figure 8.Figure 7 shows a schematic of the transmitter set-up employed totest the frequency modulator tube. That portion of the circuit enclosedby the upper dotted rectangle represents a conventional r-f transmitter.It was of the crystal-controlled type with buffer amplifiers and fre-
108 FREQUENCY MODULATION, Volume Ip.o'3
FREQUENCY MODULATION GENERATOR 109quency multiplier stages driving a final amplifier delivering a carrieroutput of approximately two kilowatts.<strong>The</strong> crystal-controlled oscillator in the transmitter was used as theprimary source of stabilized r-f voltage, the amplifier chain in thetransmitter being broken between the buffer amplifier and the firstdoubler stages for insertion of the cathode ray phase modulator andassociated apparatus, as shown.To obtain the 90° phase relationship between the voltages on thetwo sets of deflecting plates of the cathode ray tube, a phase-splittingnetwork consisting of a capacitive reactance in series with a pureresistance was employed, one set of deflective plates being connectedacross the capacitive reactance and the other set across the resistance.Fig. 8—Spiral anode of five turns, similar to that shown in the tube inFigure 6. <strong>The</strong> spirals were formed by scribing through a platinum film on amica support, thus separating the surface into two insulated segments.In this set-up the internal capacity between one pair of the deflectingplates was utilized as the capacitive reactance. A parallel tuned circuitwas bridged across the other set of deflecting plates to permit tuningout the reactance of the variable resistor and also that due to thecapacity between these deflecting plates, thus obtaining a purelyresistive impedance. <strong>The</strong> variable resistor in this circuit was used toadjust the relative amplitudes of the voltages on the two sets of deflectingplates, and the amplitudes of the two deflecting voltages wereadjusted simultaneously by means of the variable resistor R tin serieswith the d-c plate supply to the modulated amplifier.<strong>The</strong> output circuit connected to the two halves of the target anodewas tuned to the fundamental crystal frequency and coupled inductively
110 FREQUENCY MODULATION, Volume Ito the grid of an amplifier which in turn fed a frequency doubler.<strong>The</strong>succeeding stage fed a shielded r-f transmission line, the other end ofwhich was coupled to the 860 stage in the transmitter which ordinarilyoperated as a doubler but which was used as a straight amplifier in thiscase. From that point on the various stages of the transmitter wereoperated in their usual manner.<strong>The</strong> transmitter was located in the Empire State Building andreception tests were made with a frequency modulation receiver locatedin the Development Laboratory in Kadio City. <strong>The</strong>se tests showed thatthe cathode ray frequency modulator performed as predicted. Whenproperly shielded against stray magnetic fields and provided with wellfilteredd-c potentials, it introduced no measurable distortion and wasperfectly stable in its operation.In conclusion, acknowledgment is made of the cooperation of theRCA <strong>Radio</strong>tron Laboratories in constructing and supplying the tubesused in these tests and of the helpful suggestions offered by <strong>Radio</strong>tronand NBC engineers. <strong>The</strong> author also wishes to acknowledge with deepappreciation the encouragement and cooperation extended by ProfessorE. H. Armstrong of Columbia University during the. early tests onthis device.
NBC FREQUENCY-MODULATION FIELD TEST*tEaymond F.ByGuy and Robert M. MorrisNational Broadcasting Company, Inc., <strong>New</strong> YorkSummary—<strong>The</strong> full theoretical advantages of frequency modulation maybe obtained in practice if the transmitting and receiving apparatus are properlydesigned.For primary service, amplitude modulation on the ultra high frequenciesoffers some advantages over standard broadcasting. Frequency modulationoffers advantages over amplitude modulation on the ultra high frequencies.<strong>The</strong> advantages to the listener of frequency modulation on the ultra highfrequencies consist of freedom from the 10-kc beat note and side-band interferencewhich result from the frequency allocation of standard broadcasting,and also the reduction of locally generated noise, atmospherics, and interferencefrom distant stations operating on the same channel. Standardbroadcasting has the advantage of providing clear channel night-time serviceto vast areas which would not be served by frequency modulation on theultra high frequencies.TF~['pNjWENTY years ago allfrequencies above 1500 kc were generallyconsidered to be of such little value that even the amateurs hadobjections to being confined to them. <strong>The</strong>re is no need to statehere what has since occurred on these "useless" frequencies nor to dwellon the fact that the surface has but been scratched. One service afteranother has wholly or partially transferred the bulk of its activitiesto them, and a multitude of new and invaluable services have been madepossible by their use. So-called "Standard Broadcasting" had a mosthumble beginning on 830 kc, which was then in the middle of themarine band of 500 kc to 1000 kc. Broadcasting quickly crowded theoriginal occupants out of most of this band.It is not one of the serviceswhich have since moved into the high-frequency spectrum.It remainson the former marine frequencies where it started. But there is apossibility that a shift may be approaching.<strong>The</strong> use of the ultra-high frequencies for sound broadcasting offerssome technical advantages. <strong>The</strong>se advantages consist of escaping thepresent 10-kc channel limitation, getting away from static and eliminatingall except spasmodic long-distance interference. We haveknown this for many years, have for a decade experimentally operatedlow power u-h-f stations and at times have had the experience ofreceiving good service from our low-powered u-h-f transmitters whenstaticruined reception from our high-powered standard broadcastingplants. Five years ago the FCC had applications for, or had licensed,* Decimal Classification: R630 X R270.fReprinted from RCA REVIEW, October 1940.Ill
112 FREQUENCY MODULATION, Volume Iover 100 u-h-f transmitting stations and it seemed that a trend wasdeveloping toward u-h-f broadcasting, but this trend was not sustained.Interest has been revived in recent months through wide-spread discussionof the advantages of frequency modulation on the ultra highfrequencies.Amplitude-modulated u-h-f stations can provide greater coveragethan standard broadcasting shared-channel stations limited by nighttimeinterference from distant stations operating on the same channel.This interference usually causes such a station's useful service areato shrink to a small fraction of its daytime area and many of thesestations are, in addition, required to reduce power at night to minimizesimilar interference to other stations. Few such stations are free fromnight-time interference within their 2000 microvolt contour and manyare limited to 8000 microvolts. <strong>The</strong> ultra high frequencies offer anescape from such limitations by virtue of practical freedom from staticand shared-channel interference. Frequency modulation can providea much greater degree of improvement than can amplitude modulationon these ultra high frequencies.Purpose of F-M Field Test<strong>The</strong> National Broadcasting Company has been one of the groupswhich viewed realistically the possibilities of the ultra high frequenciesand has pioneered in conducting experimental operations inthat fieldfor many years. It has been NBC's belief that at some time in thefuture thesa ultra high frequencies would come into much widor use.It is the policy of NBC to investigate every technical developmentaffecting its field and apply it where possible to provide better publicservice.Toward that end 18 months ago NBC formulated plans for anexacting field test of frequency modulation similar to the field testof television which preceded the dedication of that service on April 30,1939. <strong>The</strong> purposes of the field tests were to quantitatively evaluatethe advantages of frequency modulation over amplitude modulation onthe ultra high frequencies, not by confined laboratory measurementswhich had already been made by others, nor merely by operating afrequency-modulated station, but by painstakingly measuring and comparingthe hvo systems under allkinds of actual service conditions inthe field and determining how much of the theoretical advantage ofFM could be obtained in practice.<strong>The</strong> impression has been gained by some, that only by tne use ofFM may the public now enjoy high fidelity sound reproduction in thehome. With ultra high frequencies, the same fidelity can be providedwith either amplitude or frequency modulation. Improved fidelity is
—FREQUENCY-MODULATION FIELD TEST 113made possible by increasing the transmitting channel width beyond the10-kc channel allocations of the standard broadcasting band and notby using a particular type of modulation. Irrespective of the type ofmodulation, receivers for "high fidelity" reproduction require equallycostly high power, low distortion audio amplifiers and expensive loudspeakersand acoustical systems.Present-day transmitters of NBC and others in the standard broadcastingband transmit much higher fidelity than is reproduced inmoderate-priced receivers. To reproduce sound in the degree of fidelitywhich is now available, requires more costly receivers. Popular interesthas been much more pronounced in low-priced receivers than in highfidelity at more cost. <strong>The</strong> problems of high fidelity are problems ofcost and of widespread public appreciation of improved fidelity and notof a type or method of modulation. High fidelity eventually will receivethe recognition it merits. Provision has been made for it in the ultrahigh-frequencychannel allocations.In the NBC field test of frequency modulation attention was directedtoward the evaluation of the frequency modulation system in the suppressionof undesired noise and interference, using the amplitudemodulated system as the reference, or standard of comparison.Scope of the TestsTo carry out this project properly, and for the first time completely,it was decided that:1. <strong>The</strong> same transmitter, transmitting antenna, receiving antennas,receivers and measuring equipment should be utilized for eachsystem of modulation.2. <strong>The</strong> transmitter and receiver should be equipped for instantaneousswitching to either amplitude modulation or frequencymodulation and the transmitter should be of 1000 watts power.3. <strong>The</strong> transmitter power should be continuously variable over arange of 10,000 to 1on frequency modulation, and a means ofaccurately measuring it should be installed.4. <strong>The</strong> most important comparisons should be between amplitudemodulation, frequency modulation with a deviation of 15 kc(total swing of 30 kc) , and frequency modulation with a deviationof 75 kc (total swing of 150 kc). A minimum of 15 kcdeviation was chosen because it represents a deviation ratio(deviation divided by maximum audio frequency transmitted)of 1 and because a 30-kc i-f system would still be required fora smaller deviation, to accommodate the side-bands.5. Order wires should be used between the transmitting and main
:114 FREQUENCY MODULATION, Volume Ireceiving points to expedite the work and insure accurateresults.6. <strong>The</strong> observations and measurements should be conducted at anumber of scattered and representative receiving locationsthroughout the service area of the station.7. <strong>The</strong> observations would include shared channel and adjacentchannel operation of F-M stations.<strong>The</strong> transmitter was equipped with relays for instantly selectingat will the condition of modulation desired.Since the degree of frequencydeviation is directly proportional to the audio input voltage,pads, selected by a relay,served to produce various frequency deviations.Herein, for frequency modulation, the term "per cent modulation"refers to the passband of the system and is the ratio of the totalswing being used divided by the total pass-band.Tone modulation was used for most measurements. For measurementsof distortion Or signal-to-noise ratios, with modulation present,the tone output of the receivers was cleaned up by passing it throughniters and then impressed upon RCA noise and distortion meters.For brevity the following designations will be used hereinAMFM-15FM-30FM-75S/NAmplitude Modulation.Frequency Modulation with a deviation of 15 kc, ortotal swing of 30 kc........ Frequency Modulation with a deviation of 30 kc, ortotal swing of 60 kc.Frequency Modulation with a deviation of 75 kc, ortotal swing of 150 kc.Signal-to-noise ratio.Preliminary work on this field test was started in April, 1939, andthe project was completed on May 4, 1940. <strong>The</strong> results of this workwere submitted to the FCC during the F-M hearings of March, 1940and presumably were of assistance to that body in formulating rulesand standards of good engineering practice covering u-h-f broadcasting.<strong>The</strong> Transmitter<strong>The</strong> 1000-watt transmitter was an RCA unit, originally designedfor amplitude modulation, which was modified and equipped tomeetthe requirements for both FM and AM. <strong>The</strong> receivers, of which therewere four, were specially designed and built throughout so as also tomeet the requirements.Special temporary authorization was requested and obtained fromthe FCC to use either FM or AM on 42.6 Mc, ordinarily an exclusiveF-M frequency,
FREQUENCY-MODULATION FIELD TEST 115<strong>The</strong> station was licensed as W2XWG and was constructed on theEmpire State Building in <strong>New</strong> York City. It is shown in Figure 1.This transmitter utilized an FM modulator of the type developed byMurray G. Crosby of the RCA. Some manufacturers of F-M transmittershave adopted this system as standard equipment for commercialF-M transmitters. <strong>The</strong> transmitter was equipped with a reactancecontrol in the primary circuits of the main rectifier whichFig.lpermitted continuously variable control of the carrier power from 1000watts down to less than 1/10 of one watt during transmission withfrequency modulation. A General <strong>Radio</strong> multi-range vacuum tubevoltmeter was provided to measure the transmission line voltage andpower accurately at any point over this wide range. Both of theseinstruments are illustrated by Figure 2.<strong>The</strong> frequency modulator consisted of several tubes, including an
—110 FREQUENCY MODULATION, Volume Ioscillator, a reactance tube, a crystal beating oscillator, a discriminatorand a filter. <strong>The</strong> operation is as follows:<strong>The</strong> reactance tube produces a change of reactance in its outputcircuit when the grid voltage is actuated by d-c bias or a superimposedaudio frequency such as tone or program. This reactance controlsthe frequency of a connected oscillator which drives the transmitter.<strong>The</strong> other items in the unit are provided to maintain accurateaverage carrier frequency stability. This is accomplished by a seriesof simple operations. A fixed crystal oscillator beats against the fre-Pig. 2quency of the modulated oscillator to produce an average differencefrequency of 1500 kc. This 1500 kc is brought up in level through anamplifier and impressed upon a discriminator. When the carrier frequencyis such that exactly 1500 kc is produced no voltage appearsin the output of this discriminator. However, when the reactance tubeaverage frequency changes, 1500 kc is no longer produced and a voltageis developed in the output circuit of the discriminator. A discriminatoroutput filter removes all modulation frequencies to produce adirect current which controls the reactance tube d-c bias and thus theaverage frequency of the oscillator. <strong>The</strong> purpose of the filter is toprevent the reactance tube bias from changing with modulation.<strong>The</strong> transmitter modulation characteristics are shown on Figure 3.
FREQUENCY-MODULATION FIELD TEST 117On this curve there are plotted a-c volts as the abscissa and carrierfrequency as the ordinate. <strong>The</strong> audio input to the transmitter issuperimposed on the reactance tube d-c bias.Figure 4 shows the overall frequency response of W2XWG andthe Bellmore receiver before pre-emphasis and de-emphasis wereinserted.12010080604020s_ 8I-J-20&406080100120
118 FREQUENCY MODULATION, Volume Ifeet above the sidewalk. Figure 6 shows the folded dipole in operatingposition.<strong>The</strong> circuit arrangement of the special 1000-watt transmitter isillustrated in the form of a block diagram in Figure 7. <strong>The</strong> frequencymodulator comprises the five blocks at the upper right side, containingRCA 6V6, 6K8 and 6H6 tubes.<strong>The</strong> degree of frequency deviation was measured by a methodrecently described in the RCA Review 2 . <strong>The</strong> method consists of applyinga constant frequency tone to the transmitter input terminals andgradually increasing the voltage until the carrier amplitude drops tozero. When this occurs, the frequency deviation is 2.405 times the audioFig. 4modulating frequency. This method is simple and very satisfactory ifreasonable precautions are taken.<strong>The</strong> ReceiversIn order that an exacting comparison of amplitude and frequencymodulation can be made, it is very desirable that the receivers forthe two systems be as nearly ideal and alike as possible.This practiceminimizes otherwise possible errors due to differences in receiver performance.<strong>The</strong> ideal way to build such receiving systems would be the2A Method of Measuring Frequency Deviation, M. G. Crosby, EGAReview, pp. 473-477, April, 1940.
FREQUENCY-MODULATION FIELD TEST 119common use of as many parts as possible. This was done. <strong>The</strong>y werebuilt on the same chassis. <strong>The</strong> r-f amplifier, first oscillator and theconverter were used to drive two different i-f systems in parallel.Switching and chassis space was provided for a third i-f system butit was not used. <strong>The</strong> i-f systems were used separately and each wasdesigned particularly for the reception of the modulating system to betested. Each contained an F-M and an A-M detector and each detectorhad a separate audio output amplifier. <strong>The</strong> outputs of these audioFig. 5amplifier tubes were all in parallel, but the system desired was selectedby screen grid blocking of the other amplifiers.parts of the same i-fFor AM and FM-15,system were used but the detectors and limiterswere separate. For FM-75 a separate i-f system was used. This wasalso provided with a separate A-M detector, but it was little used becausethe 150-kc i-f passband was not representative of amplitude receivers.One meter was provided to show the diode currents and another wasprovided to show the discriminator currents. <strong>The</strong> latter is a zero-
120 FREQUENCY MODULATION, Volume Icenter meter which indicates zero discriminator current when thereceiver is exactly tuned for FM. Separate gain controls were providedfor the i-f systems and also for the individual audio amplifiers. <strong>The</strong>receiver output circuit was provided with a very sharp 8-kc low-passfilter with a disconnecting key and the high-frequency de-emphasiscircuit at this point was also provided with a disconnecting key. Asingle switch served to select the type of modulation which it wasdesired to receive.Fig. 6Four receivers were specially built by the RCA ManufacturingCompany for this test and would theoretically give full output with anr-f voltage of only 1/10 microvolt across the input terminals.<strong>The</strong> hisslevel of 1 microvolt peak in these receivers was representative of thebest modern receivers and was produced by thermal agitation in theantenna circuits and by tube hiss. <strong>The</strong>y were made as good as receiverscan be built in order that the final conclusions concerning frequencymodulation as a system would not be erroneous due to apparatusshortcomings. <strong>The</strong> sacrifice of receiver design to price will not permit
FREQUENCY-MODULATION FIELD TEST 121yca-tvi pea 6ks eca - & v& ecf>-/i/a eca - eoi ec/>- boo eca -aoo 2-ecnaoo'tFM- F/ELD TEST maNSM/TTEJ?W2XWGFig. 7the full gain of frequency modulation, as reported herein, to berealized.A block diagram of the duplicate receivers is shown in Figure 8.A photograph of one of the receivers is shown in Figure 9. AtBellmore and also in the NBC laboratory in <strong>Radio</strong> City there wereprovided and used a special F-M receiver, dipole antenna and trans-FM-15AMPLITUDEF. M. FIELD TESTEXPERIMENTAL FM-AM RECEIVERSENSITIVITY 1 MICROVOLTCONTROLS1 TUNING2- MANUAL VC 15TCC3. MANUAL A.VC. SW.4. MANUAL V C - 75 KC AMPLITUDE5 8 KC FILTER SW6. BLANK7. SELECTOR. SW TYPE MODLN SCREEN V CTL8. DELAY AVC -LEVEL SET AMPLITUDE9. DEEMPHAStS SWaFM-75AMPLITUDEFREQUENCYFig. 8
122 FREQUENCY MODULATION, Volume Imission line, commercial receivers of various makes, cathode-rayoscillographs, a special high-fidelity high-power audio amplifier, anRCA audio oscillator, an RCA noise and distortion meter, a harmonicanalyzer, disc-recording equipment, a high quality loudspeaker,unweighted volume indicators, volume indicators weighted for earresponse, a u-h-f signal generator, a u-h-f field intensity measuring(RCA type 301A) set, r-f transmission line calibrated attenuators,noise-producing devices including automobiles, diathermy machines,Pig. 9etc., audio voltage amplifiers, balanced variable pads, and a microphonefor recording.<strong>The</strong> i-f systems in these receivers were painstakingly designed andadjusted for FM-15, FM-75 and AM, and at intervals during the fieldtests they were checked with respect to filter characteristics, i-f characteristics,limiter action, discriminator performance, audio frequencyresponse, distortion,etc.A shielded mutual inductance type antenna attenuator was builtand calibrated for controlling the amount of signal or noise voltagereaching the Bellmore receiver input terminals from the antenna. Bycontrolling the power of W2XWG, the antenna attenuator and thenoise sources themselves, any desired carrier or noise voltages could
FREQUENCY-MODULATION FIELD TEST 123be produced. Separate means were provided for controlling the noiseamplitudes without changing the character of the noise.Figure 10 shows measurements made with the special KCA field testreceiver and two commercial receivers. Eeceiver input microvolts areplotted against audio output level. <strong>The</strong> drop in the commercial receiversis due to r-f gains insufficient to operate the limiters at low input
124 FREQUENCY MODULATION, Volume IOne of the <strong>Radio</strong> Facilities engineering cars used by NBC for suchmeasurements is shown in Figure 12. Each of these cars is a passengersedan in which the body and interior has been modified to house a75B RCA 500-kc to 20-Mc field intensity measuring set, a 301A RCA18-Mc to 155-Mc field intensity measuring set, a modified RCA 302A± .«4«a,W2XWG FIELD INTENSITYMICROVOLTS PER METER100J WATTS 42^6 MCANTENNA HEIGHTS 30' - 1300'Fig. 11noise meter, 2 Esterline Angus recorders, a driveshaft-to-recordergear and clutch system, a special vernier speedometer and distancerecorder, an automobile receiver, an aviation type broadcast loop, au-h-f universally mounted antenna, a swivel-mounted searchlight, acompass and a steel mounting frame with aviation shock absorbersfor instruments. Quick-demountable mechanisms permit easy removalof measuring gear.
—frequency-modulation field test125<strong>The</strong> Measuring LocationsAs a part of this project, field tests and electrical transcriptionswere made under a variety of conditions at the following locations:Collingswood, N. J. —85 miles (temporary station)Hollis, L. I. — 12 miles (temporary station)Pig. 12Floral Park, L. I.Port Jefferson, L. L-Commack, L. I.Riverhead, L. I.Hampton Bays, L. L-Bridgehampton, L. L-Eastport, L. I.Bellmore, L. I.NBC Laboratory-15 miles-50 miles-36 miles-70 miles-78 miles-89 miles-65 miles-23 miles- 1 mile(temporary(temporary(temporary(temporary(temporary(temporary(temporary(permanent(permanentstation)station)station)station)station)station)station)station)station)
126 FREQUENCY MODULATION, Volume IIn addition to making thousands of measurements at the permanentstations, field intensity measurements, listening tests and orthacousticrecordings were made at each of the temporary stations. <strong>The</strong> recordingscompared on one disc, in each series, AM, FM-15 and FM-75.Several discs were recorded at each location under various noise conditions,including the random neighborhood noise encountered. For theobservations at the temporary stations a two-car "F-M caravan" wasassembled, equipped and moved from station to station. Figure 13shows the two cars used to transport the equipment and also showsone of the typical locations selected. Figure 14 shows the BellmoreFig. 13receiving station, at which most of the measurements reported hereinwere made. This receiving station is in a typical suburban neighborhood23 miles from the transmitter atop the Empire State Buildingin <strong>New</strong> York City.At the Bellmore station a simple horizontal dipole antenna wasmounted 25 feet above the ground on a wooden pole. At the temporaryreceiving stations the receiving antenna consisted of a tripod-mounteddipole. <strong>The</strong> temporary station locations were selected over a range ofdistances which covered all grades of service ranging from zero toexcellent and a sufficient number of stations were used to insureauthoritative conclusions. <strong>The</strong> observations, orthacoustic recordingsand comparisons made at these temporary stationsprovided a broadoverall picture of u-h-f broadcasting without which this thorough fieldtest would have been incomplete. <strong>The</strong> recordings remain as permanentexhibits of the results.
:. However,FREQUENCY-MODULATION FIELD TEST 127F-M <strong>The</strong>ory<strong>The</strong> theory of FM has been presented in the literature 3 4 5- 'since the following pages compare the actual performance in thefield with the theoretical, there is presented for the convenience ofthe reader a very brief review of the reasons why FM is superior,and the nature of the superiority.<strong>The</strong> advantages of FM over AM in noise suppression are contributedby three factors1. <strong>The</strong> triangular noise spectrum of FM.2. Large deviation ratios.3. <strong>The</strong> greater effect of de-emphasis in FM compared to AM.Fig. 14<strong>The</strong> Triangular Noise SpectrumAn F-M system with a deviation ratio of one has an advantagein signal-to-noise ratio of 1.73 or 4.75 db for tube hiss or other typesof fluctuating noise.Tube hiss consists of a great many closely overlapping impulses.When combined with a steady carrier of fixed frequency, the noise3A Method of Reducing Disturbances in <strong>Radio</strong> Signaling by a Systemof Frequency Modulation, Edwin H. Armstrong, Proc. I.R.E., pp. 689-740Vol. 24, May, 1936.4Frequency Modulation Characters, Murray G. Crosbv, Proc. I.R Epp. 472-514, Vol. 25, April, 1937.5 <strong>The</strong> Service Range of Frequency Modulation, Murray G. Crosby, RCAReview, pp. 349-371, January, 1940.
128 FREQUENCY MODULATION, Volume Ipeaks beat with it. In the following it is convenient to consider anindividual noise frequency as a separate carrier,many present at any time.Since a combination of two station carriers differing inof which there arefrequencyis equivalent to a station carrier and a single noise voltage, both casesmay be considered at the same time. <strong>The</strong> effect is most easily shownand understood by means of a simple vector diagram.<strong>The</strong> desired carrier vector continuously rotates through 360 degreesand is indicated in Figure 15. A weaker carrier, or a noise voltage,rotates around the carrier vector at a frequency which isequal to thedifference between the two. Amplitude modulation is produced asshown. As the undesired vector rotates around the desired vector,AMPLITUDE MODULATIONFig. 15phase modulation also is produced between the limits A and B. <strong>The</strong>faster the undesired vector rotates, or the faster the rate of phasechange becomes, the greater becomes the momentary change in frequencyand, therefore, the greater the frequency modulation becomes,because frequency modulation is a function of the first differential ofphase modulation.<strong>The</strong>refore, the amplitude of the F-M noise or beatnote varies directly with beat frequency. This results in a triangularnoise spectrum.In amplitude modulation there is no such effect as this. All noisecomponents combine with the carrier equally, resulting in a rectangularnoise spectrum. <strong>The</strong> ratio of r-m-s fluctuation noise voltages in FMand AM is, therefore, the ratio between the square root of the squaredordinate areas of these spectrums. This ratio is 1.73 or 4.75 db.
FREQUENCY-MODULATION FIELD TEST129<strong>The</strong> Deviation Ratio<strong>The</strong> deviation ratio, or modulation index, is obtained by dividingthe maximum carrier deviation by the highest audio frequency transmitted.For an F-M system, the suppression of fluctuation noise isdirectly proportional to the deviation ratio. In Figure 16 the A-Mnoise spectrum corresponds to the total hatched area below 15 kcbecause the i-f and a-f system would cut off there. <strong>The</strong> FM-75 receiveri-f system actually accepts noise out to 75 Mc and it has the usual F-Mtriangular noise characteristic.ear respond only toHowever, the audio amplifier and thenoise frequencies within the range of audibility,around 15 kc, and reject everything else. <strong>The</strong>refore, the FM-75 noisewe actually hear corresponds only to the small cross-hatched triangle.6 9.6SB GAINFig. 16<strong>The</strong> maximum height of this F-M triangle, corresponding to voltage, isonly one-fifth of the height of an FM-15 triangle or the A-M rectangle.Such being the case, the FM-75 advantage over FM-15 is 5 to 1, or14 db, and over AM it is 1.73 x 5 or 18.75 db.De-emphasis<strong>The</strong> use of a 100-microsecond filter to accomplish this high-frequencypre-emphasis and de-emphasis has been adopted as standardpractice in television and u-h-f sound broadcasting by the <strong>Radio</strong> ManufacturersAssociation and recently by the FCC.It was shown that in FM the noise amplitude decreases as itsfrequency decreases whereas in AM it does not.<strong>The</strong>refore, de-emphasisis more effective in FM. This is shown in Figure 17.<strong>The</strong> full rectangle at the left is the A-M noise spectrum. <strong>The</strong> fulltriangle at the right is the F-M spectrum. <strong>The</strong> application of de-
130 FREQUENCY MODULATION, Volume Iemphasis reduces these areas to those combining the hatched and blacksections.to power.Squaring those ordinates gives the black areas, correspondingExtracting the square root of the ratios of these black areasgives the r-m-s S/N advantage of FM over AM. It is slightly over 4,corresponding to about 12.1 db. This includes the gains contributedby both the triangular noise spectrum and de-emphasis. <strong>The</strong> spectrumadvantage is 4.75 db. Hence the de-emphasis advantage is 12.1 dbminus 4.75 db or 7.35 db. To sum up, for hiss noise the F-M noisespectrum advantage is 4.75 db, the de-emphasis advantage is 7.35db and the deviation ratio of FM-75 is26 db.14 db, giving a total of aboutIt has been reported 5 that the use of 100 microsecond pre-emphasisproduces oversaving or overmodulation of from 2.5 to 4.5 db withFRF.Ot'EVCYKCFig. 17FREGI'ENCYKCprogram modulation, depending upon the character of the sound source.<strong>The</strong> NBC field test confirmed these conclusions. <strong>The</strong>refore, in presettingtransmitter gain controls, using low-frequency tone modulation,a 2.5 db correction should be made for program modulation.Results of the F-M Field-Test MeasurementsOne of the firstfacts sought and determined was the lowest fieldintensity which could provide good service if no external r-f noisewere present, and receiver hiss only were the ultimate limiting factor.Figure 18 shows the ultimate limit in service range due to the receivernoise alone, in the complete absence of any noise received on theantenna. <strong>The</strong> signal-to-noise ratio is shown for the three systems overa significant range of receiver input microvolts, field intensity inmicrovolts-per-meter and miles-service range. <strong>The</strong> signal-to-noiseratios were rated by subjective listening tests and the ratings are shown
FREQUENCY-MODULATION FIELD TEST 131on the right side of the figure. <strong>The</strong> noise threshold values are indicatedin such a manner that they show where the increase of noisewith modulation becomes severe but do not indicate the absolute valuewhere an insignificant increase of noise results. <strong>The</strong> curves are showndotted below the threshold value because the increase of noise with
132 FREQUENCY MODULATION, Volume Iterminals the signal-to-noise ratio on AM is 17 db. <strong>The</strong>refore, thenoise is 17 db below two microvolts RMS. This curve was made usinga signal generator as a transmitter, feeding directly to the inputterminals to block out all external noise. It may be seen that the fulltheoretical gain of FM-15 and FM-75 over AM was obtained.
IFREQUENCY-MODULATION FIELD TEST 133wise retain their characteristics, if the noise were predominantly steadyin character. Here again it may be observed that the full theoreticalgain of FM-15 and FM-75 over AM isobtained.In order that this figure may be more easily interpreted, the samedata has been plotted on a bar chart comprising Figure 20. This showsthe number of miles service range for the types of modulation shownand also includes calculated values for a frequency-modulation systemwith a deviation of 30 kc. This also shows the service range withpowers of 5 kw and 50 kw, assuming that the same neighborhood noiselevel existed at all receivers.AVERAGE SERVICE RANGESRANDOM BELLMOKE NOISE - BASED UI ON NBC -MEASUREMENTS1 Kw V////A ADDED FOR 5 KW ADDED FOR SO KW/ EXCELLENT\60 DB RMSJEXCELLENT50 DB RMSAMPLITUDEFM-15FM-30FM.7SCOODJ| 4u DB RMSMILES SERVICE RANGE USING NORTON AVERAGE CURVE FOR M >10O0 - 30 ANTENNA HEIC'ITSFig. 20It will be seen that with a signal-to-noise ratio of 40 db, FM-30produces a greater service range than any other modulating condition,assuming that in each case the receiver is designed specially for thesystem being received.This would indicate that if 40 db r-m-s signalto-noiseratio is considered satisfactory as a minimum, FM-30 wouldbe about the optimum deviation to use. <strong>The</strong> service range for a swingof 150 kc does not extend beyond the limit imposed by the noisethreshold and therefore FM-75 is limited to the distance at which aS/N ratio of 53 db is obtained in all cases.<strong>The</strong> threshold effect actually starts on FM-75 at about 60 db butdoes not become severe until the unmodulated S/N ratio is about 53 db.<strong>The</strong>refore, the threshold isindicated on the curves as 53 db.If neighborhood noise were to be greater than that measured atBellmore, these bars would all shorten, but would retain their relative
134 FREQUENCY MODULATION, Volume Ilengths. It will be noted that FM-75 is superior, even with thethreshold limitation, at signal-to-noise ratios of 50 or more decibels.Regardless of the carrier-to-noise or the signal-to-noise ratio comingout of the discriminator, the full benefits of FM cannot be obtainedunless the audio amplifier hum level is sufficiently low. <strong>The</strong> advantagesof FM do not extend into the audio amplifier.Figure 21 shows measurements of tube hiss. <strong>The</strong> figure shows theratio of r-m-s to peak values using an 8-kc audio band width and a15-kc audio band width with the triangular F-M noise spectrum andde-emphasis. <strong>The</strong> hiss levels shown are representative of what canLa expected from the best modern high-gain receiver.Fig. 21From the curve, it can be observed that the ratio of peak to r-m-svalues with 8 kc is slightly over 10 db. With 15 kc it is slightly over13 db. It can also be seen that the r-m-s noise is reduced 3 db when thepass-band is reduced from 15 kc to 8 kc. <strong>The</strong> peak noise is reduced 5 dbunder the same conditions.Operation of Two F-M Stations on the Same ChannelBy referring to the section covering noise interference it can beseen that the worst condition of shared channel operation occurs whenboth stations are unmodulated, and a fixed beat note, therefore, results.It will also be seen that the higher this beat note the greater will be itsamplitude up to about 5,000 cycles. Figure 22 was made on the basisof the worst conditions, which occur when the difference in carrierfrequency reaches approximately 5,000 cycles.Were it not for the effectof de-emphasis in the receiver the beat note amplitude would contin-
FREQUENCY-MODULATION FIELD TEST 135uously rise with frequency. However, de-emphasis of the high frequenciesprevents that from happening. <strong>The</strong> effect may be furtherunderstood by referring to the section on pre-emphasis and deemphasis.It will be noted that the noise on the desired station causedby the undesired station varies inversely with the deviation ratio.Here again the theoretical advantage of FM was obtained in our fieldtest.Qw«w wQ2 40E>awp 30wwow Xenw20uQ 10w«w wQs
136 FREQUENCY MODULATION, Volume 1note ratio. For FM-75 it need be only 10 db, or 3 times greater; forFM-30, 17.5 db, or 8 times greater; for FM-15 24 db, or 10.5 timesgreater. <strong>The</strong> result is that F-M stations may be located much closergeographically than A-M stations, and therefore many more stationassignments can be made per channel.Operation of Frequency-Modulation Stationson Adjacent ChannelsFigure 23 shows the results of listening tests on adjacent F-M channelsusing in each case FM-75. On the basis of this information it is
FREQUENCY-MODULATION FIELD TEST 137<strong>The</strong> Noise Threshold in Frequency ModulationCrosby points out that an interesting series of events takes place ina frequency-modulated system when thenoise peaks equal or exceedthe peaks of the carrier. 4 <strong>The</strong> result is a rapid increase of the noiseFREQUENCY MODULATION FLUCTUATIONNOISE THRESHOLDTransmitter modulated with 10,000 cycle tone.This and any distortionproducts removed at receiver output with 8,000 low pacs filter, leaving only noise.
138 FREQUENCY MODULATION, Volume Iis less than about 60 db, or 1,000 to 1, the noise level rises with modulation,and, as the noise peaks exceed the carrier peaks by a considerableamount, this noise level may increase almost 20 db, or 10 times.Whenoperating above the threshold limit the noise changes little as theFREQUENCY MODULATION FLUCTUATIONNOISE THRESHOLDTransmitter modulated with 17,000 cycle tone.This and any distortionproducts removed at receiver output with 14,000 low pass filter, leaving only noise.OP
FREQUENCY-MODULATION FIELD TEST 139measurements made at Bellmore. In order that the noise would not beconfused with any small amount of inherent distortion in a man-madesystem, the measurements were made in such a manner that the effectsof distortion were eliminated. This was done by modulating the trans-
140 FREQUENCY MODULATION, Volume IThis effect has no doubt been observed by many without beingunderstood. It is an inherent characteristic of a frequency-modulationsystem. <strong>The</strong> noise threshold in the case of an FM-40 system having aHP
frequency-modulation field test141Measurements op Peak Ignition NoiseBecause of the peculiar wave shape and large crest factor of ignitionnoise it is preferable to measure the peak signal and peak ignition noiserather than the r-m-s values in order to establish, for one thing, the
142 FREQUENCY MODULATION, Volume Ipeaks, if synchronized with an unmodulated carrier, do not show theexistence of the noise threshold. Modulation, in effect, de-tunes thereceiver and the threshold becomes evident. De-tuning the receiverin the absence of modulation is one expedient which produces a similarresult and was the method used in obtaining the data shown on Figure28.Of particular interest in this figure isthe rating of the signal-tonoiseratio as shown at the right.A 30 db signal-to-noise ratio, whenmeasured with peak values, is equivalent to a 40 db r-m-s signal-to-noiseratio. Even with as low a signal-to-ignition-noise ratio as 20 db theservice is quite fair,although the ignition would be noticeable withoutmodulation. <strong>The</strong> relative infrequency of ignition peaks produces anaudible result which is very deceiving. With signal-to-ignition-noiseratios of 10 or 12 db, service is still not completely ruined but could betolerated if there were a special interest inthe program material.In general, ignition noise is transient, lasting for only a matter ofseconds as a car passes by a residence. During that period the noise isnot distressing. Furthermore, over a period of years, it may be expectedthat automobile ignition systems will be provided with suppressorswhich will reduce the u-h-f interference by at least 20 db.Ignitionnoise is of particular concern and is the predominant noise in suburbanareas.In urban areas, the field intensity from a F-M station or an A-Mstation will ordinarily be high enough to over-ride the higher noiselevels experienced. Figure 28 represents some of the results obtainedwith 56 peak microvolts per meter noise. <strong>The</strong> method of making thesemeasurements was not ideal in all respects but the data is indicativeof the results obtained in the presence of ignition noise. <strong>The</strong> curve ofFigure 29 shows r-m-s ignition noise measurements made without modulationand illustrates that no threshold is found under such conditions.Since a system is of no value until modulated, this curve is shown onlyto illustrate the point that the noise threshold must be associated withmodulation.Figure 30 presents interesting data showing peak ignition noisemeasurements made with an 8-kc audio band width. Peak noise inputmicrovolts are plotted against peak S/N ratio, the field intensity of thestation remaining unchanged. <strong>The</strong> signal with which the noise wascompared was 100 per cent 400-cycle tone modulation. <strong>The</strong> noise sourcein this case was an automobile ignition system built up and mountedon a lathe at Bellmore. <strong>The</strong> battery power was not varied to producedifferent field intensities of noise because this method changed the characterof the noise. <strong>The</strong> field intensity was varied over a very widerange, without changing its normal characteristic, by orienting and
FREQUENCY-MODULATION FIELD TEST 143changing the length of the connected noise transmitting antenna, whichwas located about 50 feet from the receiving dipole. FM-15 representsa deviation ratio of 1.875 when the audio band width is 8 kc. As Crosbyhas shown 8 , the noise spectrum advantage of FM is 6 db for impulsenoise. <strong>The</strong> FM-15 threshold is shown. <strong>The</strong> FM-75 threshold is notshown because at the time the measurements were made a-c hum withing8I
144 FREQUENCY MODULATION, Volume Inoise peak amplitude. Once an ignition peak has risen to the valuerequired to control the receiver and blank out the signal a furtherrise in the noise level will not occur until the peak increases in breadth,or duration, or until there is a sufficient rise in certain low amplitudecomponents of ignition noise having fluctuation noise characteristics.<strong>The</strong> peculiar shapes of such curves below the threshold values are dueto the wave shapes and crest factors of ignition noise.Results of Observations at Temporary Receiving Stations<strong>The</strong> observations at the temporary receiving stations confirmedthe measurements made at Bellmore. In going to progressively greaterdistances the FM-75 noise threshold distance was passed and FM-15became superior. <strong>The</strong>n the FM-15 threshold distance was passed andAM became superior, although it was very noisy. At the limit of A-Mintelligibility both FM-75 and FM-15 were completely smothered bynoise. <strong>The</strong> service limits were all in excellent agreement with thoseshown by the bar chart, Figure 20, subject to spasmodic interferencefrom passing automobiles. This type of interference was at all stationsthe predominating one, but was only intermittent and not as troublesomeas might be expected.Observations of Diathermal Interference in AM and FMDiathermal machines vary considerably in their characteristics,some types using raw a.c. and others using partially filtered powersupplies.Observations were made of interference on the three typesof modulation using raw a-c machines. It was concluded from theseobservations that this type of interference is characterized by thetransmission of a band of frequencies about 15 kc wide. With amplitudemodulation the background interference is essentially equal to thecarrier-to-noise ratio. With fairly weak interference from diathermyexactly centered on the desired carrier, FM-75 reception is 20 to 25db superior to AM and FM-15 is 10 to 12 db superior. However, withthe diathermy 5 kc off the desired carrier, AM was approximatelyequal to FM-15 and was in some cases superior to FM-75. Withthe diathermy carrier at the edge of the AM and FM-15 passband, theinterference is highly attenuated. Under these conditions the FM-75interference was extremely severe. With the diathermy carrier welloutside of the passband of FM-15 or AM, the interference isnoticeableonly when the diathermy amplitude is extremely high. Under normalreceiving conditions it would not be heard. However, if the diathermyunder these conditions is within the FM-75 passband, the interference
FREQUENCY-MODULATION FIELD TEST 145is extremely severe. Thus, under such conditions, FM-75 was the worstof the three types of modulation. It was concluded that in locationshaving strong diathermy interference, narrow band receiving systems§ § § ** S S»,S§ § § SillPEAK NOISE INPUT MICROVOLTSFig. 30would be far superior to others. It was also concluded that in locationshaving weak diathermy interference the wide band system would bemuch superior.Noise LevelsIn the foregoing, considerable data has been shown to indicate thefieldintensities which will provide good service for F-M and A-M sys-
146 FREQUENCY MODULATION, Volume Items. Figure 31 is shown because it is of particular interest in connectionwith this field test. It represents an accumulation of noisemeasurements made over a period of years by various RCA groups.<strong>The</strong>se data were assembled by Dr. H. H. Beverage.Noise levels vary considerably from time to time and it is not possibleto give fixed values for any time or place.However, the informa-1000700|llllllllDwfMTYPICAL NOISE LEVELS40 - 50 MC.S 100§« 20
—GENERATION AND DETECTION OF FREQUENCY-MODULATED WAVES*tByStuart Wm. Seeley.J Charles N. Kimball, Allen A. BarcoRCA License Laboratory, <strong>New</strong> York, N. Y.Summary—This paper contains a description of a frequency detectorwhich is inherently linear in operation and, consequently, adaptable for precisionmonitoring measurements. In conjunction with a mixer and heterodyneoscillator, the detector is capable of operation at signal frequenciesencountered in the usual FM transmitter. <strong>The</strong> monitor detector is discussedin the first part of the article.<strong>The</strong> availability of a detector capable of demodulating frequency-modulatedwaves with the introduction of less than 0.1 per cent distortion makespossible the investigation of other low-distortion frequency-modulateddevices as, for example, a generator of phase or frequency-modulated waves.<strong>The</strong> second part of the paper contains a description of a method of producinglow-distortion frequency-modulated signals. <strong>The</strong> system was developed,and its loiv-distortion capabilities realized, with the aid of the aforementionedlinear detector circuit, in conjunction with an audio-frequency waveanalyzer.Part ILinear Frequency-Modulated Monitor DetectorPrinciple of OperationOPERATIONIntroductionof the detector unit may best be described with theaid of the basic circuit diagram of Figure 1. e in is, in practice,a frequency-modulated signal whose carrierfrequency lies .inthe range between 100 and 300 kc. <strong>The</strong> amplitude of e in is sufficientto overswing the limits of cut-off and zero bias of the 807 tube.Duringportions of the cycle when this tube is cut off, the plate potential risesto the -]-B level. During positive grid portions of any cycle the platecurrent rises to a certain maximum value, beyond which it does notincrease with further increase in positive grid swing.curves of beam pentode tube characteristics.)(See plate familyThus, the minimum valueas well as the maximum value of the instantaneous plate potential isconstant, and the output wave is squared off on top and bottom atdefinite fixed potentials, in spite of possible variations in amplitude ofgrid swing.With a square wave of plate voltage, having a repetition rate equalto that of the input signal e in , the action is as follows : when the platepotential of the 807 reaches its peak value (equal to E B ) the smallcondenser C (25 /xfif approx.) in Figure 1 has charged through dioded xto a potential equal to E B, with the diode end of C negative. At that* Decimal classification: R630.1.t Reprinted from RCA REVIEW, January, 1942.J Now Manager, Industry Service Laboratory, RCA Laboratories Division,<strong>New</strong> York, N. Y.147
148 FREQUENCY MODULATION, Volume Ipart of the cycle when the piate potential of the 807 swings toward itslowest value, C discharges through diode d^ in series with its load R c ;thus, one pulse of current flows through the load R of diode d 2 foreach cycleof operation.<strong>The</strong> total charge acquired by the condenser C once each cycle isCE B (neglecting the contact potential of diode d x ) . <strong>The</strong> portion of thistotal charge which passes through diode d 2and R once each cycle isequal to that total charge (CE B ) minus the residual charge Ce pmin(again, neglecting the contact potential of diode d 2 ) . <strong>The</strong>n, as long asE B and e pmin remain constant and the time constants of the charge anddischarge circuits are sufficiently small compared to the period of theinput wave, the total quantity of electricity which flows through R ineach cycle is constant. Thus, an increase in the repetition rate willincrease the number of current pulses per unit of time and, therefore,*/ FIITCHFig. 1increase the average value of current flowing through R .Conversely,a decrease in repetition rate decreases the average current through R,and the average potential across R is thus a perfectly linear functionof the repetition rate or frequency of the input signal.Obviously, then, dynamic operation of the detector will result inessentially distortionless detection over that part of the characteristicfor which the previously discussed charge and discharge time-constantrequirements hold.Practical Detector Circuit<strong>The</strong> circuit of the laboratory model of the monitor detector, shownin Figure 2, is essentially the same as the basic circuit of Figure 1,except that a 6AG7 amplifier stage has been added.Certain pertinent factors relating to the development and use ofthe monitor detector are listed below.(1) <strong>The</strong> sensitivity (audio volts developed per kc frequency deviationin the input wave) is approximately a linear function of the Bvoltage applied to the 807. Hence, variations in this B voltage will
GENERATION AND DETECTION 149introduce undesired components into the detector output. <strong>The</strong>refore,the B supply must be well regulated.(2) Approximately 20 peak-peak volts, at a center frequency of150 kc, are required as input to the 6AG7, when the circuit of Figure 2is used. Voltage at this frequency is obtained from that at any othersignal frequency by means of the heterodyne oscillator and converter,shown in Figure 3. This particular circuit is designed for operation atsignal frequencies in the 40-Mc range.<strong>The</strong> a-c peak-to-peak grid voltage applied to the 807 must be at least20 per cent greater than the value required to swing from zero biasto cut-off. <strong>The</strong> 3000-ohm series grid resistor in the 807 circuit aidsinmaintaining approximate equality of duration of the two halves ofthe plate-voltage wave, and also limits the peak grid current on positivegrid swings.IF. INPUTAP/>eM. ISfittCAT 20V. P~PFig. 2—90-volt and 150-volt supplies are regulated. One side of allheaters (supplied from 6.3-volt transformer) is grounded.(3) <strong>The</strong> 807 plate load is adjusted to produce plate-current saturationat a peak grid signal just short of grid current.(4) <strong>The</strong> value of capacitance C (in conjunction with other inherentcircuit capacitances) is determined by the maximum permissible timeconstants in the charge and discharge circuits. <strong>The</strong>se should both besufficiently small compared to a half-period at the highest operatingfrequency to permit (a) e pto rise to within 0.1 per cent of E B in onehalfcycle and (b) to permit e v to fall to within 0.1 per cent of itsnormal minimum value, again within a half-cycle.(5) <strong>The</strong> lower limit of operating frequency is determined by thecut-off of the low-pass filter in shunt to R (Figure 1). This filter isnecessary both to remove undesired signal-frequency components fromthe output of the device and to allow the instantaneous potentials acrossR„ to rise and fall with each discharge-current pulse. If R were bypasseddirectly, to remove the signal-frequency components, the residualcharge on the bypass condenser would act as a diode bias, and preventcomplete discharge of condenser C. <strong>The</strong>n the discharge currents would
150 FREQUENCY MODULATION, Volume Iapproach zero asymptotically as the frequency was increased, and theresultant curvature of the output voltage vs. input frequency wouldproduce undesirable distortion.<strong>The</strong> characteristic impedance of the filter is high compared to R .<strong>The</strong> filter is terminated at its output and where it may be connectedto the grid of an audio amplifying tube.(6) It has been found experimentally that a small bias voltage(approximately 1.5 volts) in series with the charge diode d xeffectivelyovercomes the contact potential of both diodes and contributes somewhatto improved linearity of the device.n- osrecroi?i: Appro*Fig. 3Experimental Determination of Detector LinearityOne may expect representative linear performance from a monitordetector built according to the data presented. <strong>The</strong>re may, however,be circumstances wherein an accurate knowledge of the capabilitiesof the device are required. For this reason a brief description of thecalibration method employed is included here.Figure 4 shows a circuit in which the monitor detector (withoutthe heterodyne oscillator of Figure 3) is represented diagrammaticallyby a box with input and output terminals. A signal generator isemployed (in conjunction with a calibrating crystal oscillator) toprovide a point-to-point determination of d-c detector output vs.frequency.inputAn L. & N. Kohlrausch slide wire, fed from a 2-volt storagecell, is used in conjunction with a sensitive galvanometer in a potentiometercircuit which permits the d-c output of the detector to be
.GENERATION AND DETECTION 151determined with a precision of about 0.02 per cent(approximate readingaccuracy of the graduated scale of the slide wire)<strong>The</strong> extreme sensitivity of the d-c measuring circuit requires theelimination of all sources of diode-current fluctuation. Hence, the Bsupplies feeding the 807 plate and 6AG7 screen are doubly regulated(for calibration purposes only), with the circuit shown in Figure 4,and the diode (d x )bias obtained by bleeder current (as shown in Figure2) is replaced by a 1.5-volt battery for determination of detectorlinearity.<strong>The</strong> crystal oscillator of Figure 4 isused to check the calibrationof the signal generator, by zero beat methods, with the detectingphones in the plate of the mixer tube.Calibration of the signal gen-MONITOR DETECTOR CAUSMTIOM CIRCUITP* STOPAGgceilJlOUBLl B£
152 FREQUENCY MODULATION, Volume Iapproximately 0.02 per cent distortion in the audio output obtainedfrom the detector.Tests were also made to determine the susceptibility of the detectorto amplitude modulation in the input signal. With 25 per cent amplitudemodulation (and a mean value of input signal of 20 volts peak topeak) the output contains an undesired signal corresponding to lessthan 0.05 per cent of the audio voltage produced by 100-kc deviation.<strong>The</strong> sensitivity of the detector is approximately one volt peak-topeak(audio) for 100-kc deviation in the input signal (and 20 voltspeak-to-peak applied signal). <strong>The</strong>refore, if a single frequency signalof 100 kc is applied to the detector the d-c output should be approximately0.5 volt. Knowledge of this sensitivity makes possible theadjustment of the heterodyne oscillator frequency (in Figure 3) to avalue which causes the beat frequency to liein the band for which thedetector linearity is optimum. It is necessary merely to measure thed-c output of the detector as the heterodyne oscillator frequency isvaried, and to adjust the latter to produce a d-c output voltage correspondingto 150-kc carrier input.Applications<strong>The</strong> monitor detector as thus constituted is an excellent instrumentfor studying the effects of the pass characteristics of a frequencymodulationreceiver's r-f and i-f circuits on distortion, for checkingthe performance of frequency-modulation signal generators, for use asa monitor and peak deviation indicator at a frequency-modulationtransmitter, and for many other applications.Part II—Low Distortion Frequency-Modulation GeneratorIntroductionFrequency-modulation signals can be derived from systems basedon either frequency or phase modulation principles, provided that theaudio potentials (or program material) be properly integrated beforeapplication to the phase modulator.In a frequency-modulation system of the type employing a reactancetube modulator, the frequency deviation produced by a certainaudio voltage is independent of the frequency of that audio voltage,and is determined only by the sensitivity of the reactance tube (kcdeviation per audio volt) , and by the subsequent frequency multiplication.Assuming that the circuits in the generator are sufficiently flatover the desired deviation band, the harmonic content of the output ofa frequency-modulation generator of the aforementioned type is deter-
GENERATION AND DETECTION 153mined principally by curvature in the reactance tube characteristic,and isnot a function of audio frequency.Conditions obtaining in phase-modulation systems are quite different,since, for a given frequency deviation, the required peak-phasedeviation varies inversely with audio frequency, i.e.cj> in degrees at carrier freq. =57.3 X freq. dev. c/s at carrier freq.audio-freq. c/sThus, the audio voltage at the phase-modulator grid must varyinversely with audio frequency, toproduce constant frequency deviation.If the distortion in the resultant frequency-modulated signal iscaused by a non-linear relationship between the instantaneous phaseof the generated signal and the instantaneous audio voltage,the distortionwill generally vary in some inverse manner with audio frequency.Another source of distortion lies in the inability of thefrequency multiplier circuits to pass all the required side componentsof the modulated signal. This deficiency will generally produce distortionincreasing with audio frequency.<strong>The</strong> distortion due to non-linearity in the phase characteristic canbe reduced by employing frequency multiplication from a relativelylow-frequency source of phase-modulated signals, to reduce the requiredphase deviation at the modulator. Side-band clipping distortion effectsare suppressed by employing multiplier circuits having adequate bandwidth.Principle of Operation of ExperimentalPhase-Modulation GeneratorIn most generators employing phase modulation as a nreans for.ultimately producing frequency-modulated signals,audio components or program material ismodulation by theaccomplished at a low valueof signal frequency (generally about 100 kc), which is subsequentlymultiplied and heterodyned toproduce the desired carrier frequency.One system of phase modulation employed experimentally requiresfirst the generation of amplitude-modulated signals at a low signalfrequency, after which the carrier is shifted in phase with respect tothe amplitude-modulated sidebands, to produce a phase-modulated signal.<strong>The</strong> inherently remanent amplitude modulation present in thisdeveloped signal isthen removed by limiter action.Another system of phase modulation is described in Patent No.2050067, issued August 4, 1936 to Dr. Walter Van B. Roberts. Thissystem makes use of an unique characteristic of a simple parallel tuned
154 FREQUENCY MODULATION, Volume Icircuit operated at 1/V2 times its resonant frequency. An investigationof the operation of this circuit together with following frequencymultipliers was made with the aid of the afore-described frequencymodulationmonitor. <strong>The</strong> basic principle of operation of the circuitis as follows : A parallel resonant circuit, tuned to V2 times the frequencyof an unmodulated low-frequency carrier (generally about 100kc) is used as the plate load in a pentode whose grid is fed with voltageat the source frequency (100 kc). See Figure 5. <strong>The</strong> phase of theplate voltage of the pentode is then varied by changes in the seriesresistance of the resonant circuit. Figure 6 shows the manner ofvariation of
GENERATION AND DETECTION 155at the desired carrier frequency. <strong>The</strong> phase deviation is, of course,multiplied by the same factor as is the center frequency.<strong>The</strong> phase deviation required at the modulator is determined by thedesired phase deviation and by the order of frequency multiplication.Thus, an expression for modulator phase deviation (at the 100 kc level)for any audio frequency is57.3 X freq. deviation at ultimate carrier freq.4>°=audiofrequency X order of frequency multiplicationIt is desirable to maintain the maximum required phase deviationin the modulator circuit at as low a value as possible, to minimize non-'\!r1
156 FREQUENCY MODULATION, Volume Iunlimited multiplication of the phase deviation without resorting tovery low source signal frequencies in the modulator circuit.<strong>The</strong> heterodyne system was employed in the laboratory generator,as shown in the block diagram, of Figure 7. <strong>The</strong> source of signals isa crystal oscillator operating at 100 kc. This is fed through a filterto a 6SJ7 with the tuned circuit of Figure 5 as its plate load.<strong>The</strong> grid of the 6L6 modulator tube (triode connected) is suppliedwith audio potentials, and its plate resistance constitutes the variableR of Figure 5. <strong>The</strong> resultant phase-modulated signal is multipliedsuccessively by factors of 3 and 5 to produce a 1500-kc voltage, whosephase deviation is 15 times that effected by the modulator. In aFig. 7parallel chain of multipliers, an unmodulated 100-kc signal(from thesame crystal oscillator) is multiplied by factors of 4 and 4, to producea 1600-kc voltage, with no phase deviation. <strong>The</strong> 1600-kc signal servesas a constant-frequency heterodyning source, converting the phasemodulated 1500-kc signal to the difference frequency of 100 kc, whichis taken from the mixer plate through a low-pass filter. <strong>The</strong> phasedeviation in this 100-kc signal isincreased over the modulator circuitdeviation by a factor of 15. Hence, the apparent sensitivity of themodulator (degrees phase shift/audio voltage) is increased by 15 to 1,allowing a reduction of non-linear distortion products (at low valuesof audio frequency) by a factor greater than 15 to 1.<strong>The</strong> 100-kc heterodyne signal is then fed through a subsequentchain of multipliers which raises the carrier frequency to 40.5 Mc,with a phase deviation of 405 X 15 = 6075 times that produced at themodulator. For distortion measurements this output signal is appliedto the converter of Figure 3, which feeds into the linear monitordetector.
.GENERATION AND DETECTION 157Figure 8 isa diagram of the phase-modulator circuit employed inthe laboratory generator. <strong>The</strong> component circuits indicated by theblocks in Figure 7 are, in general, self-explanatory, but a few remarksdetermined from development experience are in order.<strong>The</strong> coupling transformers for the 300 kc, 400 kc, 1500 kc, and1600 kc stages are double-tuned transformers employing inductivecoupling. <strong>The</strong> coupling and damping of each unit was adjusted toprovide adequate band-pass characteristics. In this respect it must benoted that those stages following the heterodyne mixer require greaterpercentage band width than those preceding the mixer by a factorequal to the heterodyne ratio (15 in this case).Pig. 8—Phase modulator circuit.<strong>The</strong> 4.5 Mc, 13.5 Mc, and 40.5 Mc stages utilize single resonantcircuits, each tuned with a 3-30 p.p.f trimmer and all loaded or dampedsufficiently to make the pass band essentially flat and thus to minimizethe generation of amplitude modulation and phase distortion in thesestages.Jacks are provided in each stage to facilitate the measurement ofd-c grid current, as a means for determining correct tuning conditionsin preceding stages. <strong>The</strong> grid bias resistors are adjusted to producemaximum harmonic output in each stage. Thus, for example, in atripler whose plate load is tuned to 300 kc, the tripling action ismaximized by adjusting the tripler's grid leak to produce maximumgrid current in the following tube. This bias adjustment is carriedout in all stages. <strong>The</strong> grid-circuit time constants of all stages aremade sufficiently low to permit the multiplier grids to follow any a-fvariations in the amplitude of the signals, thereby producing limitingaction.
158 FREQUENCY MODULATION, Volume IExperimental ProcedureAn essentially distortionless audio source is required for measurementsof phase distortion in the frequency-modulation generator. Thishappens because the amplitude of the nth harmonic in the developedfrequency deviation is proportional not only to the amplitude of thenth harmonic in the audio-source voltage, but also to the order of theharmonic, since the frequency deviation isproportional to the rate ofphase deviation. Thus, 1 per cent 3rd harmonic in the audio inputwould produce (in an otherwise distortionless system) 3 per cent harmonicin the resultant frequency deviation, which would then appearas 3 per cent 3rd harmonic in the audio output of the monitor detector.This problem may be circumvented in two ways, i.e., first integratethe audio voltage before application to the modulator, in which casethe device produces frequency-modulated signals, requiring constantaudio input for constant-frequency deviation as the audio frequency isvaried. <strong>The</strong> source harmonics are then reduced in magnitude by anamount proportional to their order. <strong>The</strong> alternative method was usedin the experimentalwork ;an audio source of good waveform was usedin conjunction with a series of band-pass filters, each capable of passingan octave of frequencies, starting at 30 cycles and ending at 8000cycles. No integration was employed: hence, the generator producedphase-modulated signals.A General <strong>Radio</strong> Type 636-A wave analyzer was used for all distortionmeasurements. <strong>The</strong> harmonic content of the audio source wasfound to be less than 0.05 per cent for all audio frequencies employed.<strong>The</strong> wave analyzer was then connected permanently across the monitordetectoroutput terminals. In parallel with this a 9-inch oscilloscopewas connected to facilitate preliminary adjustments. In general theaudio input to the modulator was adjusted to produce 100-kc deviation(for all audio frequencies) at the final carrier frequency of 40.5 Mc.<strong>The</strong> heterodyne oscillator in the detector unit was adjusted to produce150 kc as the intermediate frequency for application to the monitordetector.This had previously been ascertained as lying in the regionof optimum detector linearity.As pointed out in a preceding section, there are two sources ofdistortion, in a generator of this type; the first occurs at low audiofrequencies (less than 400 cycles) and is due to non-linear relation*ships in the modulator, which are accentuated by the large audioswings required.This type of distortion is generally a function of the modulatorbias, which controls the degree of matching between the curves of.£ vs. B (Figure 6) and R pvs. E g of the modulator tube.
GENERATION AND DETECTION 159At higher audio frequencies (greater than 1000 cycles) the distortionis generally independent of modulator bias(since only a smallaudio swing is applied) , but is determined, rather, by sideband clippingin the multiplier tuned circuits.In adjusting the unit for minimum distortion products the audioinput was set at 3200 cycles, and, with the monitor detector outputindicating 100-kc deviation, and the wave analyzer reading 2nd harmonicdistortion, adjustments were made by loading and tuning of themUltiplier-load circuits until the distortion due to sideband clippingwas minimized. This procedure was repeated at 7500 cycles. <strong>The</strong> overalldistortion was reduced to less than 0.5 per cent rms, for 100-kcdeviation, at these higher audio frequencies.fff/O0£ CCHM£CTIOV £g = 72 S V.reeoucNcY j>£\z/Ar/o// comst/wt str /oo refFO* 40.S MC CAf?ff/£ff)/" //-%^. -Fig. 9<strong>The</strong> audio frequency was then reduced to 400 cycles, for distortionmeasurements at relatively larger modulator audio swings- With thefrequency deviation adjusted for approximately 100 kc and the waveanalyzer set for 2nd harmonic determinations, it was found that theamplitude of this harmonic was a function of modulator bias, and thata minimum value of less than 0.1 per cent could be attained with criticalmodulator bias adjustments. This sharply defined minimum is due tothe dependence of the localized curvature of the R p-E gcurve of themodulator upon its bias, and to the fact that, for a certain bias, correctmatching between this curve and that of vs. R is obtained. Figure 9shows curves of rms distortion vs.bias at 400 cycles modulating voltage.At 50 cycles the applied audio voltage required for 100-kc deviationis 8 times that required at 400 cycles, and as a result, the degree ofmatching of the E g vs. R pand 4> vs. R curve is less complete over an
IMODULATO*160 FREQUENCY MODULATION, Volume Iaudio cycle. However, the rms distortion at 50 cycles is relativelyconstant at 3.5 per cent over a 2-volt range in bias,for 100-kc deviation,as shown in Figure 9.A large number of tube types (6J7, 6K7, 6V6, 6AC7/1852, 6AC7/1853, 6J5, 6L6) were used experimentally as modulators. <strong>The</strong>6AC7/1852, for example, has higher sensitivity (kc deviation peraudio volt) , but the dependence of distortion on bias is more critical.<strong>The</strong> 6L6 was finally chosen as a result of its lower rms distortionat 50 cycles modulating frequency, and the relative constancy of distortionwith bias.Analysis of the modulator circuit shows that distortion producedat low audio frequencies, caused by mismatch of the R pvs. E 9and vs. R curves, is due principally to insufficient curvature in the R pvs.J)ISTOffTIOH VS. FREQUENCY DEVIATION616 MQDULATO0 Tt/Se/tuDIO FP£OU£/^CY * SO cyclesAMS ' SI 7 VrffSOUEriev IXW/ITIO* k~CPig. 10E„ curve. This can be corrected, if desired, by some types of regenerativeaudio circuits, which tend to increase non-linearity in themodulator tube R pcurve, or by the use of an additional modulator tosupply 2nd harmonic variations in R pto produce additional curvature.Experimental ResultsFigure 10 shows the distortion incurred at 50 cycles modulatingfrequency vs. frequency deviation (in the 40.5 Mc carrier) taken ata value of bias for which the 2nd harmonic distortion is at a broadminimum.Figure 11 is a plot of rms distortion vs. audio frequency for twovalues of frequency deviation. Note that the distortion is essentiallyindependent of deviation except at frequencies below 200 cycles, forwhich the audio swings (approximately 20 peak-peak volts at 50 cycles)are large, causing considerable mismatch in the phase and R pcurves,which, at lower swings, are normally coincident.
GENERATION AND DETECTION 161feUMiMyaM^i^=fe-H--H^-t FBEQVSNCy.novo FuequENCY - erects Kg secoHDFig. 11<strong>The</strong> distortion at high audio frequencies is independent of modulatorbias, but is very much a function of tuning, even with sufficientcircuit damping. This is particularly the case in the 300-kc triplerfollowing the mixer stage, which must accommodate a band of frequencies15 times as great as that encountered in circuits directlyfollowing the modulator.Attention must be directed toward minimizing amplitude modulationin the frequency-modulated wave, particularly at the lower signalfrequencies, for which the phase deviation is small. As shown inAppendix II, n per cent amplitude modulation can produce n per cent2nd harmonic distortion in the frequency deviation, due to sidebandcancellations, if the phase deviation is sufficiently low to permit therepresentation of the wave by a carrier and a pair of first-ordersidebands.Appendix IAnalysis of Phase Modulator Load Circuit:C^ '/pore)-, c/ecv/r T(/rV£0TO t4t.4 SCC| f/~X~Fig. (a)(1) To demonstrate the constancy of tuned impedance as R isvaried.
162 FREQUENCY MODULATION, Volume I<strong>The</strong> circuit is resonant at V2"x the source frequency, i.e., C in theabove figure is half the value required for circuit resonance at thesource frequency. <strong>The</strong>refore, LC =-12aand_(RCw, +.)'•'2, + j'l \ 12RCu,-jl JRCu, + jju>tC<strong>The</strong> absolute magnitude of £ is therefore \g\ — .which is independentof R.(2) <strong>The</strong> phase vs. R equation of the circuit is readily determinedfrom the above, viz:_ / 2RCv>, + ;1 \ 1 1 / 1 - / 2RCa,\ 2RCa>, - ;1 / >,C a>,C \ 2RCu>, - ;1total phase shift
GENERATION AND DETECTION 163Appendix IIProof that amplitude modulation in a low-deviation phase-modulatedwave can produee frequency-modulation distortion equal approximatelyto the per cent amplitude modulation, if this factor isFirst assume that the phase deviation issmall.sufficiently low to justifythe use of only the first-order sidebands. <strong>The</strong> signal then has theform of Figure (b).r~ MAX.Fig. (b) = tan -1 sin n = 2ir X modulating frequencyNow let the carrier be amplitude modulated at the same audio frequency,viz:<strong>The</strong> phase angle is given bye c= E e (X + m sin a t)Letlation.<strong>The</strong>n2E,E ebe a constant, determined by the amount of phase modu-= tan- 1 Ksin
cos164 FREQUENCY MODULATION, Volume Ialso for m, (per cent amplitude modulation -r- 100) less than 0.10, itis sufficiently accurate (within 1 per cent) to write = K sin —u> a tm (1 sin o aO = K sin a at ~- Km sin 2 u> a t. This can be expanded to givem m1
A NEW EXCITER UNIT FOR FREQUENCY-MODULATED TRANSMITTERS*!ByN. J. OmanEngineering Department, RCA Victor DivisionCamden, N. J.Summary— This paper describes an exciter unit for use in frequencymodulationtransmitters. <strong>The</strong> new exciter unit is capable of producing afrequency modulated carrier of excellent linearity and low noise level. <strong>The</strong>carrier frequency is automatically maintained to an accuracy close to thatof a crystal-controlled oscillator, the frequency of the latter being used asa reference.T-"^HERE are two systems now in general use for producing a frequencymodulated signal which meets the Federal CommunicationsCommission's requirements for frequency modulationbroadcasting. One method, making use of phase-shift modulation, wasdeveloped by Major E. H. Armstrong. <strong>The</strong> operation of this system isshown in schematic form in Figure 1.AUDIO(-r)i,'TYV--~Z8- 28» MAX. MiO 50~ 2KC I5KC^L^— :r=*o\
'166 FREQUENCY MODULATION, Volume Ishown dotted in the proper phase relation. A portion of the output ofthe crystal is shifted in phase by 90 degrees, and added to the sidebands,as shown in the top right of the illustration. <strong>The</strong> effect of thesidebands is to advance and retard alternately the position of the carriervector. <strong>The</strong> whole picture rotates about the point at an averageangular velocity determined by the crystal frequency. <strong>The</strong> magnitudeof frequency modulation produced depends on the modulating freiookcXTALrlZHiHiH5LH3~G36.4 MC800KCAntennaFig. 2—Block Diagram of Armstrong Type FM Transmitter.quency, and on the amplitude or length of the sideband vectors relativeto the reintroduced carrier. It can be seen that, if the length of thesideband vectors is fixed, the frequency modulation will increase sixdecibels per octave as the modulation frequency isincreased.In order to obtain pure frequency modulation it is necessary todecrease the amplitude of the audio input six decibels per octave, withrising frequency.This is shown in the response curve, at the upper left,<strong>The</strong> audioin the modulating frequency range from 50 to 2,000 cycles.response is flat for frequencies above 2,000 cycles.This means that thefrequency-modulated output increases at six decibels per octave above2,000 cycles, to give the 75 micro-seconds standard pre-emphasis ofhigh frequencies agreed upon by the <strong>Radio</strong> Manufacturer's Association,as a measure to improve signal-to-noise ratio at the receiver. <strong>The</strong>receiver has a corresponding drop in response above 2,000 cycles to producea flat response for the overall system. <strong>The</strong> audio response is againflat for frequencies below 50 cycles, resulting in six decibels per octavedrop in frequency-modulated output below 50 cycles.This restrictionis imposed by the fact that the distortion in the frequency-modulatedoutput is five per cent, when the phase displacement is plus or minus28 degrees, and increases rapidly with greater phase shifts. <strong>The</strong>se
FM EXCITER 167representative figures call for a frequency multiplication of about 3,000to produce a frequency swing of plus or minus 75 kilocycles at 50megacycles.Figure 2 isa more complete block diagram of an Armstrong typeof transmitter making use of an arrangement to minimize radio carrierdrift.A second method of producing a frequency modulated signalemploys a reactance tube to produce a direct change in the frequencyof a master oscillator. <strong>The</strong> basic circuit is shown in Figure 3. <strong>The</strong>oscillator circuit is illustrated at the right and the reactance modulatoris shown at the left. <strong>The</strong> plates of the two tubes are tied together.<strong>The</strong> grid of the reactance tube is driven from the plate circuit, but is90 degrees out-of-phase with it. <strong>The</strong> plate current of the reactancetube is therefore 90 degrees out-of-phase with respect to the platevoltage. <strong>The</strong> tube reactance becomes either capacitive or inductive innature, depending on whether the 90-degree shift in grid excitationFMOUTPUTB +REACTANCE Bt"^TUBE SCREEN OSCILLATORFig. 3—Reactance Tube.leads or lags the plate voltage.<strong>The</strong> audio voltage changes the bias ofAs thethe reactance tube grid in accordance with the signal voltage.reactance tube is a pentode, this change in bias causes a correspondingchange in mutual conductance of the tube. <strong>The</strong> net result is that thereactive current of the tube varies as the impressed audio signal. Ina high-fidelity circuit it is customary to use two reactance tubes, oneacting as a capacitive reactance and the other as an inductive reactance,in order to obtain maximum frequency stability and linearityof response. <strong>The</strong> circuit is capable of a frequency swing of more thanplus or minus 10 kilocycles at 5 megacycles so that very little frequencymultiplication is required to obtain a plus or minus 75 kilocycles swing.Because of the advantages of the reactance tube modulator, considerableeffort has been devoted towards obtaining such an exciter
168 FREQUENCY MODULATION, Volume Iunit that would also have excellent frequency stability. <strong>The</strong> frequencycorrection should be effected independent of the modulation process,and, if possible, provision should be made to correct frequency manuallyif there should be a failure of the automatic frequency control. A goodcrystal-controlled oscillator should be used as a standard referencefrequency source for the automatic frequency-control circuit.One type of frequency modulation exciter (illustrated by the blockdiagram of Figure 4) beats the master oscillator frequency down toone megacycle, using a crystal oscillator as the beat-frequency source.<strong>The</strong> one-megacycle beat frequency acts on a discriminator to provide adirect current control potential which is applied to a reactance modulatortube grid so as to compensate any drift of the master oscillatorfrequency. <strong>The</strong> time constant of the correction is of sufficient durationto prevent it responding to modulation.
FM EXCITER 169Data on many other circuits intended to accomplish automatic frequencycontrol have been published. A number of these make use ofthe scheme shown in Figure 6. <strong>The</strong> signal from the oscillator to becontrolled is fed to two amplitude-modulation detectors or mixers. <strong>The</strong>signal from the crystal-controlled reference oscillator is also fed to thedetectors, but through circuits that shift phase so that there is a 90-degree displacement of the reference frequency between the two detectors.<strong>The</strong> resulting beat frequency of the two oscillators will appearin the output of each detector, and because of the 90-degree phase shiftof one of the exciting frequencies, the beat frequencies will also bedisplaced by 90 degrees. <strong>The</strong> interesting feature of the circuit is that,Fig. 5as the frequency of the oscillator, being compared to the frequencyof the crystal, is caused to change through the synchronous or zero-beatcondition, there is a reversal in phase of one beat-frequency outputwith respect to the other.<strong>The</strong>re are many ways in which to make use of this phase reversalto provide an indication as to whether the controlled oscillator frequencyis high or low. Several methods were investigated. <strong>The</strong> mostpromising idea was to make use of the fact that the two beat notesdisplaced by 90 degrees constitute a source of two-phase power and
170 FREQUENCY MODULATION, Volume Icould, therefore, be used to set up a rotating magnetic field in aninduction motor. Inasmuch as one phase reverses when the controlledoscillator frequency passes through zero beat, the rotation of the fieldf±OSCILLATORBEAT FREQUENCY—ft +9,°°BEAT FREQUENCY
FM EXCITER 171beat frequency would fall in the range where the motor had torqueenough to take control. Frequency modulation of the controlled oscillatorhad no apparent effect on the motor except to reduce its torque. <strong>The</strong>system was operated with program modulation from a local broadcaststation and ran for several days without once losing control. <strong>The</strong>re was,however, a constant danger that a sudden jump in oscillator frequency,especially in the presence of modulation, might cause loss of control.Some improvement could be obtained by speeding up the rate of frequencycorrection. In these first tests it had been necessary to drivethe control condenser through a gear train so that the frequencycorrection would be gradual and without overshooting, which wouldresult in hunting.<strong>The</strong> slow speed of the motor, added to the backlash and friction inthe gear train, gave rather poor performance in following minor de-Fig. 8partures in frequency. To eliminate some of these troubles, the condenserwas mounted directly on the motor shaft as illustrated inFigure 8. <strong>The</strong> tendency to hunt was eliminated by fitting a dash-potto the opposite end of the motor shaft. <strong>The</strong> friction of the tuningcondenser bearings was avoided by using a split stator condenser withthe rotor on the motor shaft and insulated therefrom. One set of statorplates was grounded and the other set was connected to the plate ofthe controlled oscillator. This procedure eliminated all friction savethat in the ball bearings of the motor. <strong>The</strong> range of operation was,thereby, extended at both high and low frequencies, the motor beingable to take control at 1,000 cycles above or below zero-beat. <strong>The</strong> oildamping gave much more rapid control action without causing troublefrom hunting. <strong>The</strong>se changes yielded an enormous improvement inthe operation of the frequency control.
172 FREQUENCY MODULATION, Volume ISince the limit of the control range isthe high-frequency-responselimit of the motor, an increase in the range of control can be obtainedby dividing the modulated oscillator frequency, so that it could becompared to a crystal oscillator at a lower frequency. <strong>The</strong> range ofcontrol would thus be increased by a factor equal to the division infrequency. An exciter unit, such as described by J. F. Morrison in hisU.S.P. #2,250,104, accomplishes this by using ten stages, each dividedby two, yielding a total division of 1024. Each divider stage is a duplicationof the one schematically shown in Figure 9. <strong>The</strong> circuit employsthe principle of regenerative-modulation whereby a subharmonicis obtained by a modulation process. Since the output energy is obtainedby a modulation process involving both the input and outputwaves, the output wave will appear only when an input wave isapplied,BALANCEDi AsMODULATOR*PsBPFL28 AMPFig. 9—Frequency Division Pat. By. R. L. Miller 2,159,595and bears a fixed frequency ratio with respect to it.<strong>The</strong> circuit makesuse of copper-oxide modulators and the output circuit is tuned to onehalfthe input frequency. <strong>The</strong> tuned circuits are made sufficientlybroad to permit substantial output voltage over a frequency range of± 1.5 per cent. While the circuit is rather complicated and expensive,the output waveshape is good and the fact that there is no output wavewhen there is no input signal, might prove to be of value. <strong>The</strong> divisionper stage is low, although division ratios greater than 2 are possibltunder special circumstances.Another possible way to obtain frequency division would be to makeuse of multivibrators. <strong>The</strong> waveshape would not be good, but it wouldbe possible to get higher division per stage.<strong>The</strong> circuit finally adopted for use in the new exciter unit is shownin Figure 10. This circuit minimizes the number of divider circuitcomponents. <strong>The</strong> waveshape of the output of the divider, described ingreater detail by G. L. Beers in his U.S.P. #2,356,201, has been found
FM EXCITER 173to be entirely satisfactory for automatic frequency control purposes.<strong>The</strong> circuit can be tuned over the required range by means of anadjustable iron slug located within the field of the coil. <strong>The</strong> lock-inrange may be as high as plus or minus five per cent. Division ratiosas high as12 have been successfully obtained.Having selected a circuit for frequency division the next considerationwas to fix the frequency at which the comparison of frequencieswas to be made. A crystal and holder with excellent performance designedto operate in the frequency range of 90 to 125 kilocycles is usedas the frequency standard for the exciter units.A preliminary test of the performance of the frequency control withfrequency comparison, made at 100 kilocycles, gave excellent resultsexcept for a loss of control in the presence of tone-frequency modulation6AC7 AS A TRIODEB +Fig. 10—Locked-In Oscillator Frequency Dividerwhen the modulating frequency was below 100 cycles. A fundamentalcharacteristic of frequency modulation is that the energy in the modulatedsignal does not change with the degree of modulation. However,as the amount of modulation is increased from zero, there is a transferof power from the carrier to the sidebands lying above and below thecarrier frequency. This effect continues with increasing modulationuntil a point is reached at which all the energy is in the sidebands andthere is no power in the carrier. With further increase in modulation,or frequency swing, the carrier again reappears. With the ± 75-kilocycleswing of frequency, used for broadcasting, there are several cyclesof this effect at low modulating frequencies. In the first experiments,where the frequency comparison was made at five megacycles, thisphenomenon was detected only in a loss of torque in the tuning motor.
174 FREQUENCY MODULATION, Volume I<strong>The</strong>oretically, it should have been possible to find conditions ofmodulating frequency, and degrees of modulation, where there was notorque. Actually, these points were so critical and so sharply definedthat it required considerable patience to find them. In actual operation,with program modulation, the condition of no torque would not existlong enough to lose control.<strong>The</strong> effect of frequency division is to reduce the swing of frequencywith modulation, along with the reduction of carrier frequency. Thisis carried far enough when the frequency comparison is made at 100kilocycles so that carrier loss occurs only at frequencies of modulationbelow 100 cycles and, for 100-cycle modulation, only with full frequencyswing or 100-per-cent modulation. This effect was not serious in programmodulation, but in taking performance data on a transmitter,4.5-6 M.C.AUDIOINPUTf/240I8.75-25.KC94-125 KCPig. 11—<strong>New</strong> FM Exciterwith tone modulation, it would be readily apparent.An additional divisionby five, to 20 kilocycles, eliminates this problem except for modulationbelow 20 cycles, which appears low enough not to be a source ofcomplaint.<strong>The</strong> circuit of the current model of the exciter unit is illustrated inFigure 11, as a block diagram. <strong>The</strong> items in the top row are (fromleft to right) the reactance tubes, a modulated oscillator, a frequencytripler, a second tripler, and a power amplifier. <strong>The</strong> power amplifier isused to obtain sufficient power to feed the main transmitter througha transmission line. <strong>The</strong> output frequency will fall in the range of 40.5to 54 megacycles.Multiplication by two, in the main transmitter, givesa possible output frequency range from 81 to 108 megacycles.A lead shown at the left of Figure 11 serves to conduct a synchronizingvoltage from the modulated oscillator to the first divider at the
FM EXCITER 175lower left. <strong>The</strong> dividers are arranged as shown, with four stages, givinga total division of 240. This places the output frequency of the lastdivider in the range of 18.75 to 25 kilocycles. <strong>The</strong> output of the lastdivider is connected directly to the two balanced modulators. <strong>The</strong>crystal oscillator shown at the lower right may operate at any frequencybetween 94 and 125 kilocycles. <strong>The</strong> crystal output synchronizes adivider at one-fifth the crystal frequency. This frequency is also fed tothe balanced modulators, but in this case a phase-shifting network isincluded in the lead to each modulator, adjusted to maintain a 90-degreedisplacement in-phase between the modulators, over the range of frequenciesinvolved.Each balanced modulator has a pair of 6L6 tubes biased to cut-off,and connected in push-pull. An induction motor with high-impedances«(Tin poim a, suppitJ-5U4S S-0D3/VRI50I-OC3/VRI05Pig. 12center-tapped windings on each phase is used in the plate circuit of themodulator tubes, the use of matching transformers then being unnecessary.In this way the motor receives full voltage to direct current beatfrequency.<strong>The</strong> need for this is evident when one considers that themotor must respond to a beat-frequency lower than one part in a millionat 20 kilocycles, which is .02 cycles per second or 1.2 cycles per minute.This rather phenomenal performance from an induction motor is largelymade possible by the elimination of any load on the motor. <strong>The</strong> absenceof gearing and the use of viscous damping establishes a condition in
176 FREQUENCY MODULATION, Volume Iwhich there is little or no resistance to slow rotation of the motor shaft.This motor responds on application of voltage to frequencies up to 1000cycles.In order to make tuning and performance checking of the frequencycontrol simple and rapid, the necessary test equipment is built into theexciter. A cathode-ray oscilloscope, with the required switching mechanism,is provided. By selecting the proper switch position it is possibleto check the division in each divider and also the tuning andmultiplication of the tripler stages, by means of Lissajous figures.<strong>The</strong> accuracy of the frequency control is so exact that it is limitedby the heat cycle of the crystal oven. During test, this effect producedBeBP» urQ»0.Fig. 13a regular variation of ± 40 cycles at 100 megacycles as the thermostatof the crystal oven went on and off. <strong>The</strong> control action is smooth andrapid. <strong>The</strong>re are no critical adjustments. <strong>The</strong> range of control can beas high as ± 1000 cycles at 20 kilocycles—that is, ± 5 per cent. At100 megacycles this amounts to ± five megacycles. In case of failure ofthe frequency control during a program, operation can be continuedwith manual frequency control by locking the motor shaft and adjustingthe frequency with a vernier tuning control located on the masteroscillator tank coil.
FM EXCITER 177<strong>The</strong> distortion inthe frequency-modulated output of the exciter isof the order of 0.5 per cent for modulating frequencies from 30 cyclesto 15,000 cycles. <strong>The</strong> noise level in the output is 74 decibels below 100-per-cent modulation.A schematic diagram of the new exciter unit is shown in Figure 12Figure 13 is a front view of the new exciter unit with the major componentsand controls identified. Figure 14 is a rear view of the exciterunit.Fig. 14In summary, the principal advantages of this new exciter unit are:(1) Its relative simplicity of circuit design.(2) Use of a minimum number of tubes.(3) Accurate frequency control.(4) Reliability of operation.(5) Excellent performance characteristics.(6) Ease of maintenance and service.
A PRETUNED TURNSTILE ANTENNA*tByGeorge H. Brown and J. EpsteinResearch Department, RCA LaboratoriesPrinceton, N. J.Division,Summary— Electrical and mechanical design refinements provide anultra-high-frequency unit that can be adjusted before being erected. Elementsare directly grounded for lightning protection and heaters are providedto prevent icing.VT)f ^HE purpose of this paper is to describe a new turnstile antennadesign for ultra-high-frequeney broadcasting.<strong>The</strong> original turnstile 1 was so constructed that the elementswere fed by means of open wires twisting around the supporting mast.Adjustment of the phase relationships and current magnitudes wasaccomplished by means of two properly matched transmission lines cutto the proper lengths and combined in a common terminal. <strong>The</strong> adjustmentof these lines at the base of the antenna proper was rathercritical and involved a certain amount of patient effort.With the advent of frequency modulation on the ultrahigh-frequencies,the turnstile antenna found many applications. It soonbecame apparent that many antennas would be placed on the topsextremely tall supporting structures, where the matching and phasingadjustments become very difficult if not impossible. With these factorsin mind, the development of a new type of turnstile was undertaken.2<strong>The</strong> most important feature of the new antenna isofthe fact that itis completely pretuned during the fabrication of the individual elementsso that no work of an engineering nature is necessary to putthe antenna into operation.<strong>The</strong> 90-degree phase relation is accomplished in the construction ofthe antenna elements themselves, so that no adjustments at the base areneeded to obtain the circular pattern.<strong>The</strong> antenna elements are so constructed that, while acting as insu-* Decimal Classification: R321.32.f Reprinted from Electronics, June, 1945.1 Brown, George H., "A Turnstile Antenna for Use at Ultra-High-Frequencies," Electronics, Apr. 1936.2Brown, George H., and Epstein, J., "A Turnstile Antenna for Ultra-High-Frequency Broadcasting," presented at the I,R.E. Summer Convention,Detroit, Mich., June 23, 1941,178
TURNSTILE ANTENNA 179lated members for the radio-frequency signal, they are actuallygrounded to the pole to afford lightning protection. Because of thegrounding feature, it is a simple matter to include sleet-melting unitsin each radiator.Two concentric feed lines connect the several units, replacing theopen wires formerly used. By means of standard concentric line, thesetwo feed lines are fed in push-pull from a single concentric feed linewhich runs back to the transmitter. This feed line is terminated toeliminate standing waves.Principle of Turnstile Antenna<strong>The</strong> fundamental objectives of the turnstile antenna are twofold,
180 FREQUENCY MODULATION, Volume IFi = (60 I/r) sin (u>t) sin (t) cos () (2)<strong>The</strong> sum of Equation (1) and Equation (2) gives the total resultantfieldF(4,)=F 1+F 2= (60 I/r) [sin (cat) sin () + cos (o>t) cos (changes, giving a circularly symmetrical horizontalpattern.<strong>The</strong> concentration of energy in the vertical plane is obtained bystacking a number of elemental turnstile units along the vertical axis.<strong>The</strong> vertical radiation pattern of n units spaced a half-wave lengthapart and cophased is equal towhere F (6) = vertical radiation patternsin [ (nir/2) sin 0]F(6)= (4)wsin [(tt/2) sin 0]n = number of layers6 = elevation angle measured with respect to the horizontalplane.Equation (4) shows that maximum radiation occurs for — 0, or inthe horizontal plane.Radiator Elements and Feed Lines<strong>The</strong> radiator elements for the new turnstile design were constructedfrom copper tubing having a two-inch diameter. One of these elementsis shown in Figure 2(a) in its proper position with respect to thesupporting pole. Since the radiator is made slightly less than onequarterwave in length, the impedance measured between the end adjacentto the pole and the pole consists of a resistance component and acapacitive component, as shown in the lower section of Figure 2(a).
TURNSTILE ANTENNA 181A modern turnstile antenna, serving WCAU's f-m audience in thePhiladelphia area.
182 FREQUENCY MODULATION, Volume I<strong>The</strong> method of supporting the antenna is shown in Figure 2(b).Here a one-inch tube extends from the support pole out through theradiator, and a metal shorting-plug connects the inner tube to the outersleeve. Thus the impedance of the radiator is shunted by the inductivereactance of the transmission line formed by the inner surface of theouter sleeve and the outer surface of the inner tube.If the shorting plug is placed in the proper place, the entire combinationwill be tuned to parallel resonance and the impedance will bea pure resistance, as shown in the lower part of Figure 2(b). <strong>The</strong>magnitude of this pure resistance will be determined by the lengthchosen for the outer sleeve.If R a is the resistance of the outer sleeveand X a is the capacitive reactance of this same sleeve, the parallelresonant resistance is•out
TURNSTILE ANTENNA 1831
184 FREQUENCY MODULATION, Volume Iseries-inductance elements each have a reactance equal in value to R.In a previous analysis of this circuit, 3(1) /i and I 2were equal in magnitude.(2) I x leads I 2 by ninety degrees.it was shown that(3) <strong>The</strong> input impedance of the total circuit is a pure resistanceof R ohms.<strong>The</strong> first condition, equality of the two currents, is evident from aninspection of Figure 4(c). A vector diagram of the currents and thedriving voltage is shown in Figure 4(d), and helps to show the quadraturerelation as well as the fact that the input impedance isresistance.a pureA complete single layer of a turnstile combination is shown inFigure 5. Here the East and North radiators are fed from one con-
TURNSTILE ANTENNA 185Pig. 6—Details of one radiator element.layers are one-half wave apart and itcorresponding phase.is desired to feed these layers in<strong>The</strong> concentric feed lines are shown laid out in a plane in Figure 8.It will be noted that the feed line on the left is one-half wave longerthan the feed line on the right. This insures the necessary push-pullFig. 7—Individual layers are connected together by means of two concentriclines which spiral around the pole. A simple matching network is also shown.
186 FREQUENCY MODULATION, Volume 1feed to each layer. Since each radiator has a resistance R, a resistanceof R ohms is present at each little end-seal. <strong>The</strong> half-wave connectinglines transfer impedance without conversion, so that the impedanceat point a on the right-hand line is that of the four sets in parallel,that is, R/4. In the general case, with n layers of radiators, theimpedance at point a would be R/n ohms. <strong>The</strong> input impedance of aline which is one-quarter wave in length and of characteristic impedanceZ is Z^/Z out, so the impedance at point b, looking up thePig. 8—A simplified layout of feed lines for four layers or less.right-hand line, is Z 2 /(R/n), or nZ 2 /R.An equal impedance is seen at point b looking into the left-handtransmission line. Since these two impedances are equal, the totalimpedance at point b is nZ 2 /2R. Now, if we choose the individualradiator resistance such thatR = nZ /2 (7)
TURNSTILE ANTENNA 187the input resistance is equal to Z and the main feed line is matchedin its characteristic impedance. <strong>The</strong> following table shows the values ofR which would be chosen for a number of layers of Turnstile:Table INumber of LayersR (ohms) when(n) R/Z. Z„ is 70 ohms1 0.5 352 1.0 703 1.5 1054 2.0 140While we could theoretically extend this procedure to many morelayers, it was found that the antenna dimensions became quite criticalwhen more than four layers were used. In order to obtain high parallelresistance, the radiators had been shortened to a point where theresistance changed a great deal with a slight change in antenna length.A practical feed system used for six or more layers is shown inFigure 9. Here the main feed line enters at a point midway in theantenna structure. To match the main feed line, the radiator parallelresistance must satisfy the conditionR = nZ /S (8)<strong>The</strong> table below shows the appropriate value of R:Table IINumber of LayersR (ohms) when(n) R/Z. Z. is 70 ohms6 0.75 52.58 1.0 70.010 1.25 87.512 1.5 105.0In order to provide a design which would be installed in the fieldwithout adjustment, tests were made on typical arrangements toassure ourselves that close tolerances on dimensions were not necessary.Our objective was to adjust and test an antenna of, say, fourlayers at some frequency in the f-m broadcast band, learn what scalefactor should be applied to each dimension in order to build an antennafor any frequency in the band, and provide charts so that any futureantennas which were to be provided could be constructed from thesecharts.
188 FREQUENCY MODULATION, Volume 1Method of Adjustment<strong>The</strong> main flag pole was laid out horizontally on two wooden supportingstructures so that the pole center was approximately twelvefeet above the ground, as shown in Figure 10. <strong>The</strong> antenna system wasassembled on the pole. <strong>The</strong>n the North and South radiators weredisconnected from the feed lines and the series inductance sectionsof the East and West radiators were shorted out directly across thes-v»4|Fig. 9—A practical feed system for six layers or more.small cylindrical insulators at the mouths of the inductance sections.Next, the antenna length and the position of the shorting plug onthe support rod (see Figure 3) were changed on each East and Westradiator until the main feed line was properly terminated in its characteristicimpedance. This condition was observed by means of aprobe voltmeter sliding along a slotted measuring line. <strong>The</strong> antennalength adjustment was made by sliding very thin-walled sleevesoverthe end of the radiator, while shorting plugs with spring-contactfingers were used to adjust the shunt tuning inductance.
TURNSTILE ANTENNA 189This adjustment insured that the correct value of R was present foreach radiator. It should be noted that even though mutual impedancewas present between radiators, this method of adjustment takes accountof the mutual impedances without even measuring the specific values.We were now ready to adjust the series-inductance and seriescapacitancesections. <strong>The</strong> shorting straps were removed from theseries-inductance sections of the East and West radiators. <strong>The</strong> Northand South radiators were connected to the feed lines. <strong>The</strong> North andSouth radiator lengths and position of the shorting plugs were madeto correspond with the dimensions found to be desirable for the Eastand West radiators. <strong>The</strong>n, the approximate length for the seriescapacitancesections was calculated and the capacitance sections werecut a little longer than this length. <strong>The</strong> series inductance sections wereFig. 10—Arrangement used for adjusting the new turnstile antenna on theground.next adjusted by means of variable shorting-plugs until the main feedline was matched.Under this condition, the currents in the North and South radiatorswill be in quadrature with the currents in the East and Westradiators, but may be somewhat greater in magnitude than the latter.A field-intensity meter was placed a few hundred feet away from theantenna. <strong>The</strong> turnstile antenna was then rotated about the axis ofthe flagpole and observations of field intensity were made at the remotepoint. If the maximum field intensity was obtained when the Northand South radiators were pointing straight up and down, it was necessaryto shorten the capacitance sections to obtain a circular pattern.When the capacitance sections were shortened, the series-inductance
190 FREQUENCY MODULATION, Volume Isections were readjusted to again match the main feed line. <strong>The</strong>nobservations were again made of the field intensity as the pole wasrotated.a circular pattern.Three or four adjustments of this type are sufficient to obtainMeasurements of a typical well-adjusted turnstile are shown inFigure 11.antenna.This may be regarded as the horizontal field pattern of theVertical Field Intensity PatternsWith the pole mounted horizontally above the ground, we wereafforded an excellent opportunity to measure the vertical radiationpattern by simply moving the field-intensity meter on the circumference
TURNSTILE ANTENNA 191
192 FREQUENCY MODULATION, Volume I1.0
—TURNSTILE ANTENNA 193one twenty-fourth of the total power, the voltage from each radiator tothe flagpole is 149.0 volts, with a similar voltage across each seriescapacitance and series—inductance. <strong>The</strong> feed straps carry approximately2.8 amperes, with a voltage from feed strap to ground of 209.0volts. <strong>The</strong> voltage and currents along the feed lines are shown inFigure 16. <strong>The</strong>se values speak for themselves.It is the authors' wish to acknowledge the helpful assistance oftheir colleagues Donald W. Peterson and 0. M. Woodward, Jr.Pig. 16—Voltage and currents on the feed lines of a six-layer turnstile,operating with a power of 10,000 watts.
CHARACTERISTICS OF THE PYLON FM ANTENNA*tByRobert F. HoltzEngineering Products Department, RCA Victor Division,Camden, N. J.Summary— <strong>The</strong> pylon antenna is a stack of slotted cylindrical sections.A description of the physical aspects and performance characteristics isgiven.General DescriptionI TRUCTURALLY, mechanically, and electrically this new antennahas been reduced to strictly functional elements. Each pylonsection, Figure 1, is a metal cylinder approximately 13 ft. highand 19 ins. in diameter.It carries no dipoles, no loops, no appendagesof any kind. <strong>The</strong> radiator is the cylindrical structure itself. A singletransmission line, running up the inside of the cylinder, along theslot to the mid-point, is the feed line.<strong>The</strong> cylinder is rolled from a single aluminum sheet, bolted at thetop and bottom to cast rings which give itgreat mechanical strengthand provide means for securing the pylon section to the supportingtower or to additional stacked sections.As many as four, and perhaps more of these basic cylindrical sectionscan be stacked to provide a high-gain antenna of remarkablysimple design. Such an assembly is shown in Figure 2. It should benoted that the bottom section is mounted directly on the building roof,without the use of a supporting tower.Origin op the Design<strong>The</strong> cylindrical pylon antenna Has been undergoing developmentsince early in 1944 at RCA in Camden. <strong>The</strong> principle of the so-calledslot antenna has been employed in a number of applications whereexisting plane metal surfaces had to be adapted to radiating highfrequencyenergy.When it was recognized that these radiating surfaces could berolledinto a cylinder and used for the radiation of omni-directional,horizontally-polarized waves, steps were taken to explore the furtherpossibilities of such a design. As Figure 3 shows, the pylon antennaDecimal Classification : R326.611 X R630.f Reprinted from FM and Television, Sept. 1946.194
PYLON ANTENNA 195is,in effect, made up of a large number of circular elements, each oneof which is a radiating member. When power is fed to the slot,Figure 4, the slot functions as a transmission line, and currents flowaround the circular paths shown by the dotted line.Early tests were conducted on 200-mc. models, fabricated of lightwire screen. Although it may appear that the choice of a radiatortPig. 1—Single pylon antennasection.Fig. 2—A 4-section pylon antenna,mounted on the roof of a building.y2wavelength in circumference and 1 wavelength long was an obviousone for such an antenna, this is by no means true. A given set ofdimensions for a cylinder yields a radiator which can be operated atany one of a number of nodes. <strong>The</strong> cylinder diameter is intimatelyassociated with the horizontal pattern. On the other hand, the diameteris also a controlling factor in the length of cylinder for resonance.
196 FREQUENCY MODULATION, Volume IA compromise was struck at this stage of the development.Investigationsrevealed that the slot width could be used to control theabsolute value of the impedance level at the feed point.This characteristicwas explored carefully,in order to arrive at an optimum design.Careful tests were carried out to make certain that a round cylinderwould yield the optimum characteristics.It was found that no reasonabledegree of ovality improved the performance in any way.Multipleslotcylinders, with more than one slot on the periphery, were con-^P^ i8\Pig. 3—Each section serves as anumber of circular elements.Fig. 4-—<strong>The</strong> slot functions as atransmission line when fed withpower.sidered and rejected because the structural and electrical simplicitywere lost.CharacteristicsPylon sections can be stacked to provide higher gain. Figure 2shows a 4-section assembly which has a power gain of 6.As many as8 sections can be stacked in the same manner to give a power gain of 12.Figure 5 illustrates the very simple feeder system required for 1,2, and 4 sections. <strong>The</strong> lines are actually run inside the pylon sections,
TPYLON ANTENNA 197so that they are protected from exposure. <strong>The</strong> feed system has anadvantage when the antenna is being erected. That is, each pair ofsections can be joined on the ground, and the interconnecting line putrtCD POINTS ACROSSCENTER Or EACH SLO" *\CONCCNTAIC LINES,ARE INSIOE IDE ANTCNNA J*——7 fW =(-SECTION 2-SECTIONS 4-SECTIONSFig. 5—Feeder system used for 1, 2, and 4 sections is exceedingly simple.in place. <strong>The</strong>n it is only necessary to make 2 or 3 connections "inthe air."Successive sections are joined by bolting the end flanges together.All construction work involving arms or loops is eliminated, and no
198 FREQUENCY MODULATION, Volume Isupporting mast is required since the pylon sections are at once mastand radiators.<strong>The</strong> power gain is indicated in Figure 6 and the horizontal radiationin Figure 8. While the pattern is not exactly circular, this is generallyan advantage since, in any area, there is always one direction18
PYLON ANTENNA 199Fig. 7—Horizontal radiation pattern for antennas of 1, 2, and 4 sections.One size of radiator, or pylon section, and two sizes of transmissionline lengths cover the whole FM broadcast band. No tuning oradjusting is required either on the ground or in the air. <strong>The</strong> widebandwidth is obtained by the use of line elements, Figure 9.Pig. 8—Plot of the horizontal radiation, at frequencies of 86 and 110 mc.
1200 FREQUENCY MODULATION, Volume-A single section, Figure 1, weighs only 350 lbs., or 700 lbs., for twosection, while a 4-section assembly, made of heavier material, comesto 2,000 lbs. <strong>The</strong>se weights include, the radiators, transmission line,beacon, steps, and hardware.<strong>The</strong> ice problem is negligible because the transmission lines areinside the cylinders, where ice formation is unlikely.Any formation onthe outside will add little to the weight and loading. Maintenance ismade easy by the simple feed-line arrangement, the small number ofend seals, and by the fact that the lines are enclosed within theantenna sections.aIit)
:PYLON ANTENNA 201saving in the cost of tower construction, if required, particularly inareas where icing and its attendant top-loading must be taken intoconsideration.<strong>The</strong> wind load at the center of the radiator sections is based on20 lbs. per square foot of the projected area and assumes a circularcross-section. <strong>The</strong> value of R xincludes the 300-mm. beacon.-o«-Hf^p\Pig. 10—Values for these design factors are given in the table here.Specifications<strong>The</strong> following table gives the specifications for pylon radiators of1, 2, and 4 sections1 Sec. 2 Sec. 4 Sec.Power Gain, nominal 1.5 3 6Field Gain, nominal 1.23 1.73 2.45Weight, lbs. 1 350 700 2000Height, ft 13.5 27 54R lt lbs. 2 501 950 1868D lt ft 1V2 14 27y 6D 2, ins 19y 2 19y 2 i9y 2D s , ins. bolt circle 3 22% 22% 22%1Total weight including radiator, transmission lines, beacon, steps, andhardware.2Total wind load on radiator, including beacon. Based on 20 lbs. persq. ft. of projected area, all sections assumed round.'Mounting is by means of eighteen %-in. bolts on 22%-in. circle.
202 FREQUENCY MODULATION, Volume IREACTANCE-TUBE FREQUENCY MODULATORS*!ByMurray G. CrosbyBOA Communications, Inc.,<strong>New</strong> York, N. Y.SummaryAn improved reactance-tube modulator is described which utilizes apush-pull circuit to balance out the carrier frequency instability due topower supply variations.Design considerations are given for the type of reactance-tube modulatorwhich uses automatic frequency control to stabilize the mean frequency.* Decimal Classification : R148.2.t RCA REVIEW, July, 1940.(8 pages; S figures)A TRANSMITTER FOR FREQUENCY MODULATEDBROADCAST SERVICE USING A NEW ULTRA-HIGH-FREQUENCY TETRODE*!ByA. K. Wing and J. E. Young$RCA Manufacturing Co., Inc., Harrison and Camden, N. J.SummaryThis article describes a 1-kilowatt transmitter developed for thefrequency-modulated broadcast service. A description of the circuits, tubesand mechanical arrangement of the apparatus is included. <strong>The</strong> electricalperformance is described.(10 pages; 6 figures)* Decimal Classification : R355 X R630.fRCA REVIEW, January, 1941.J Now with Engineering Products Department, RCA VictorCamden, <strong>New</strong> <strong>Jersey</strong>.Division,
SUMMARIES — TRANSMISSION 203DRIFT ANALYSIS OF THE CROSBY FREQUENCY-MODULATED TRANSMITTER CIRCUIT*!ByE. S. WlNLUNDRCA Manufacturing Co., Inc., Camden, N. J.SummaryComponent drift, sensitivity, and band-width expressions are combinedin an over-all expression for frequency stability of the Crosby circuit.Using experimentally obtained constants in this expression, an equationis derived for drift in terms of frequency and frequency multiplication opento choice by the designer, and the results are shown as design curves. <strong>The</strong>equation is checked against actual conditions existing in a Crosby exciterunit.(9 pages; 7 figures; 2 tables)* Decimal Classification : R148.2 X R630.f Proc. I.R.E., July, 1941.ANTENNAS FOR F-M STATIONS*!ByJohn P.TaylorEngineering Products Department, RCA Victor Division,Camden, N. J.Summary<strong>The</strong> importance of proper antenna choice is emphasized, and the significanceof antenna gain is discussed. <strong>The</strong> paper covers: advantages ofmulti-layer antennas, limitations of multi-layer antennas, interrelation ofheight, gain and power, how antenna gain is obtained, meaning of field gainand power gain, practical types of FM antennas, original Brown turnstile,improved Brown turnstile, modifications of the turnstile, circular or "ring"antennas, and square-loop antennas. <strong>The</strong> summary lists a number of checkoffitems toguide station engineers in planning an FM station.(8 pages; 15 figures)* Decimal Classification : R320 X R630.f Broadcast <strong>New</strong>s, August, 1944.
204 FREQUENCY MODULATION, Volume IF-M AUDIO MEASUREMENTS WITH ANA-M RECEIVER*!ByR. J. <strong>New</strong>manEngineering Products Department, RCA Victor Division,Camden, N. j.Summary<strong>The</strong> procedure for determining modulation level and making audioresponse measurements by the "Bessel Zero" method is covered in detail."Bessel Zero" points are explained and the problems of finding them andhow to use this information is discussed. <strong>The</strong> paper then dealsprocedure for making measurements of the AF response.with the(3 pages; 2 figures; 1 table)* Decimal Classification : R254.12.f Broadcast <strong>New</strong>s, August, 1944.A SQUARE LOOP F-M ANTENNA*fByJohn P.TaylorEngineering Products Department, RCA Victor Division,Camden, N. J.SummaryA typical installation of an FM antenna built around the top of an AMtower rather than on a flagpole extension is discussed. This constructionadds little weight or wind resistance. <strong>The</strong>ory, details of construction, andtuning procedures are described.(5 pages; 11 figures)* Decimal Classification: R320 X R630.f Electronics, March, 1945.
SUMMARIES — TRANSMISSION 205AUDIO FREQUENCY RESPONSE AND DISTORTIONMEASURING TECHNIQUES FOR F-MTRANSMITTING SYSTEMS*!ByR. J. <strong>New</strong>manEngineering Products Department, RCA Victor Division,Camden, N. J.SummaryNecessary procedures for making the response and distortion measurementsrequired for "proof of performance" of FM installations is dealt within this paper. <strong>The</strong> equipment required is indicated, and the subject ofpre-emphasis is discussed. Topics covered include: arrangement of equipment,calibration of the audio oscillator, frequency response measurements,use of distortion and noise meter for frequency response, measurements,harmonic distortion measurements, and FM and AM noise level measurements.(6 pages; 5 figures; 1 table)* Decimal Classification : R630.1.f Broadcast <strong>New</strong>s, June, 1945.F-M ANTENNA COUPLER*!ByJohn P. TaylorEngineering Products Department, RCA Victor Division,Camden, N. J.SummaryAn FM antenna at the top of a base-insulated tower used as an AMradiator is fed through a concentric line without short-circuiting the tower.<strong>The</strong> coupling unit which accomplishes this is described in detail. <strong>The</strong> couplingproblem is dealt with both in theory and with regard to construction.<strong>The</strong> tuning procedure is discussed in a thorough manner.(S pages; 8 figures)* Decimal Classification: R320.51.f Electronics, August, 1945.
206 FREQUENCY MODULATION, Volume IISOLATION METHODS FOR F-M ANTENNASMOUNTED ON A-M TOWERS*!ByRobert F. HoltzEngineering Products Department, RCA Division,Camden, N. J.Summary<strong>The</strong> problem of mounting FM radiators atop AM towers is dealt withfor both shunt-and series-fed AM towers. <strong>The</strong> general desirability of FMantennas atop AM towers is discussed. No particular problem other thanstructural requirements exists in the case of shunt-fed AM towers. However,in the case of series-fed AM towers, the more-usual arrangement, an isolatorunit is required. Such a unit is described and its function and operationdiscussed in detail.* Decimal Classification : R320,f Broadcast <strong>New</strong>s, October, 1946.(2 pages; 4 figures)SLOT ANTENNAS*fByN. E. LlNDENBLADResearch Department, RCA Laboratories Division,Rocky Point, N. Y.Summary<strong>The</strong> development of flush-type radiators of the slot and pocket type isdescribed. Special emphasis is made of types applicable to aircraft. Specificsolutions to altimeter and marker beacon pickup antennas are described.Reference to application in other fields is also made.<strong>The</strong> general aspects of the phenomena which are involved are examinedand it becomes evident that workable solutions, in the majority of cases,can be obtained only by means of actual experiment, since variations in thesurroundings have first-order influence upon such vital characteristics asradiation patterns, slot impedance, and bandwidth.Progress before and during the war is described in somewhat chronologicalmanner. It is pointed out that while this progress has been considerable,an appreciable amount of skillful investigation remains to be donebefore slot antennas can be brought to maximum usefulness.(7 pages; 19 figures)Decimal Classification: R326.21 X R630.t Proc. I.R.E., December, 1947.
THE SERVICE RANGE OF FREQUENCYMODULATION*!ByMurray G. CrosbyEngineering Department, RCA Communications, Inc.Summary— An empirical ultra-high-frequency propagation formula iscorrelated with experimentally confirmed frequency modulation improvementfactors to develop a formula for the determination of the relationbetween signal-noise ratio and distance in a frequency-modulation system.Formulas for the distance between the transmitter and the point of occurrenceof the threshold of frequency-modulation improvement, as well asformulas for the signal-noise ratio occurring at this distance, are alsodeveloped.Results of calculations and listening tests are described which evaluatethe signal-noise ratio gain obtained by applying pre-emphasis to the highermodulation frequencies of both amplitude and frequency modulation systems.Examples using a typical set of conditions are given and discussed.ITHAS BEEN shown that thepropagation characteristics of frequencymodulation are such as toconfine the use of this type ofmodulation insofar as telephony is concerned to the ultra-high frequencieswhich do not use the ionosphere as a transmission medium. 1Consequently, for most purposes, calculations of service range of afrequency modulation transmitter may be based totally on the propagationcharacteristics of ultra-high-frequency waves and in this paperthat base will be used. Formulas and empirical data now availablemake it possible to calculate the field strength at the receiver if transmitterpower, antenna heights, and distance are known.Consequently,the signal-noise ratio for amplitude modulation may be determined ifthe field strength of the noise is known. From this known amplitudemodulationsignal-noise ratio,the signal-noise ratio obtainable with agiven frequency-modulation system may be determined by multiplyingthe corresponding amplitude-modulation signal-noise ratios by the frequency-modulationimprovement factors as given inthe author's previouslypublished paper 2on frequency-modulation noise characteristics.It is the purpose of this paper to perform this correlation of thesepropagation and frequency-modulation improvement formulas anddevelop formulas so that from the known constants of the frequencymodulationsystem, the signal-noise ratio at a given distance may bedirectly calculated.* Decimal Classification: R630.ll.f Reprinted from RCA REVIEW, January, 1940.207
::208 FREQUENCY MODULATION, Volume IAmplitude-Modulation Signal-Noise Ratio vs.Distance<strong>The</strong> following empirical formula has been given by H. H. Beverage"for calculating the field strength when the receiver is within the opticaldistance of the transmitter88 VTV ahE (r-m-s volts per meter) =(1)where W = effective watts radiated = power in antenna times antennapower gain over a one-half wave dipole,a — the receiving antenna height in meters,h = the transmitter antenna height in meters,D = the distance in meters,A = the wavelength in meters.This formula is to be used for calculating the field strength for distanceswithin the horizon only. For distances bsyond the horizon,Beverage used a graphical method of plotting the curve of fieldstrength versus distance. In this graphical method the field strengthversus distance curve according to equation (1) was plotted for distancesout to the horizon and then the curve was continued for distancesbeyond the horizon, but with a slope of l/D H instead of 1/D 2 .<strong>The</strong> exponent "n" was determined empirically and varies with frequencyin the manner shown in Figure 1 which is reproduced fromBeverage's paper.In place of the graphical construction of the curve for distancesbeyond the horizon, the formula given by (1) may be revised to beapplicable to all distances, whether they be within or outside of thehorizon, as follows:88 VWahD,"-"-E (r-m-s volts per meter) =(2)XD"in which the exponent "n" is equal to two for distances within thehorizon and is chosen from the curve of Figure 1 for distances beyondthe horizon. D h is the distance to the horizon in meters and is equalto 2.21 \f~h + 2.21 \fa where a and h are the receiving and transmittingheights in meters. Thus, where D < D h, n = 2, and where D > D h ,n is taken from Figure 1.When the units of the formula given by (2) are converted to feet,microvolts, miles, and megacycles, the formula becomes0.01052 \fWahf D h"- 2E (r-m-s microvolts per meter) =- (3)D"
ISERVICE RANGE OF FREQUENCY MODULATION 209where W = effective watts radiated = power in antenna times antennapower gain over a one-half wave dipole,a-— receiving antenna height infeet,h = transmitting antenna height in feet,D = distance in miles,D h= distance to the horizon in miles = 1.22 \Hi + 1.22 \Z~a~,/ = frequency in megacycles.In comparing the calculated curves with the experimental data,Beverage states that "scattering and absorption, even in open country,1000kj6005400ZOOSIX1006040-kii',Z 4- 6 3 10 IIVALUE OF EXPONENT V?*Fig. 1—Variation of exponent"n" in propagation formula whentransmission is beyond the horizon.tend to reduce the average intensity to something in the order of thirtyto sixty per cent of the calculated value." In the following derivationsan average experimental factor of forty-five per cent will be included totake into account this absorption and scattering.It will be noted that this formula gives the average field intensityand does not take into account fading. More recent work by MacLeanand Wickizer 4shows the range of fading which may be expected forone set of transmission conditions. Thus, for transmission conditionsreasonably close to the case treated by MacLean and Wickizer, thesignal intensities at the fading minimums may be determined by applyinga correction obtained from Figure 12 of the MacLean andWickizer paper which is reproduced herewith as Figure 2. In thepresent paper, the formulas will be derived for the case of the averagesignal intensity and the fading correction will be applied to the examplesgiven.
_.'___.._210 FREQUENCY MODULATION, Volume I<strong>The</strong> peak carrier-noise ratio* obtained at a given distance may bedetermined by converting the voltage given by (3) into peak values(multiply by 1.414) and dividing by the peak noise voltage, N. N isthe noise field strength as determined by means of a field-strengthmeter having a pass band characteristic equal to twice the band widthof the audio spectrum which it is desired to receive. <strong>The</strong> experimentalscattering and absorption factor may be taken into account by multi-M!._M_:_J_L_L_J_U_._U__
:)SERVICE RANGE OF FREQUENCY MODULATION 211"~°0.0067 VWahf D hC/N = = S a/N a ( 4JVD»where C = peak carrier-field strength,N = peak noise-field strength as above defined,S a= peak audio-signal voltage,amplitude-modulation receiver,N a= peak audio-noise voltage, amplitude-modulation receiver.Frequency-Modulation Signal-Noise Ratio vs.Distance<strong>The</strong> author's previously cited paper 2 on frequency-modulation noisecharacteristics gives the improvement factors effected by a frequencymodulationsystem over an amplitude-modulation system.For the caseof fluctuation noise the factor is V3 times the deviation ratio /*. (<strong>The</strong>deviation ratio, p., is equal to F d /F awhere F d is the peak-frequencydeviation due to modulation and F a is the width of the audio channelof the system.) This factor holds for equal carriers fed to the tworeceivers and for the condition of a peak carrier at least 4 decibelsabove the peak noise in the frequency-modulation receiverintermediate-frequencychannel. Thus, the signal-noise ratio at the output ofthe frequency-modulation receiver may be found by multiplying thesignal-noise ratio given by (4) by the improvement factor or:0.0067 VWahf D h"~-S f/N f= x/3^N D"(fluctuation noise) (5)0.0116 m VWahf D,»-NowhereS f= peak audio-signal voltage, frequency-modulation recsiver,N f= peak audio-noise voltage, frequency-modulation receiver.When the received noise is impulse noise the improvement factoris equal to twice the deviation ratio or 2 /a. <strong>The</strong> corresponding signalnoiseratio is thenIt will0.0134 ,x VWahf L>/("- 2S f/N f= (impulse noise) (6)N D"be noted that in deriving the signal-noise ratio formulas of(5) and (6), the power gain normally effected by frequency modulationat the transmitter is automatically taken care of by the fact that Wappears in both the amplitude- and frequency-modulation formulas.In the case of amplitude modulation the value of W used would normallybe less than the corresponding value used in the frequency-
212 FREQUENCY MODULATION, Volume Imodulation formulas by a factor equal to the frequency-modulationpower gain at the transmitter.Effect of the Improvement Threshold<strong>The</strong> presence of the phenomena called the "improvement threshold"places a rather definite maximum service range on a frequency-modulationsystem. <strong>The</strong> improvement threshold occurs at the point wherethe peak voltages of the noise and carrier in the intermediate-frequencychannel of the frequency-modulation receiver are equal. <strong>The</strong>experimental work of the author's previously cited paper 2 shows thatthe full frequency-modulation improvement for fluctuation noise is notobtained until the carrier is at least four decibels above the improvementthreshold or where the carrier-noise ratio is about four decibels.<strong>The</strong> nature of the improvement threshold is such that thesignal-noise ratio drops rapidly as the carrier falls below the fourdecibel carrier-noise ratio. For the case of fluctuation noise, whichis of a continuous nature, the noise smothers the signal in a mannerwhich has been described in detail before 2 . Consequently the distanceat which the improvement threshold occurs for fluctuationnoise may be taken as the maximum service range of the frequencymodulationsystem. However, for impulse noise of the type whichconsists of sharp impulses having a low rate of recurrence, the situationis somewhat different. It has been pointed out to the authorby V. D. Landon of RCA Manufacturing Company, that for thecondition of no modulation present, if the receiver is carefully tunedso that the incoming carrier is approximately synchronized withthe oscillation frequency of the impulse, the frequency-modulationimprovement is maintained for impulse noise which is strongerthan the carrier. This effect is shown in the experimentally determinedcurve of Figure 3 which also shows the effect of a slight detuningfrom the point of synchronism. For these curves, the peak carriernoiseratio and the peak signal-noise ratios were measured by meansof an oscilloscope coupled to the intermediate-frequency channel outputand the audio output of the receiver, respectively. Curve B was takenwith the receiver carefully tuned to the impulse noise minimum. CurveA was taken with the carrier detuned about 20 per cent of the maximumfrequency deviation of the receiver used. It will be noted thatthe improvement threshold manifests itselfsharply when the receiveris detuned. Hence, for all except the very low passages of modulationthe threshold would be present since application of frequency modulationcorresponds to a momentary detuning. However, the reductionof the noise during the idle periods of the modulation is undoubtedlyvery helpful.
! ! 1SERVICE RANGE OF FREQUENCY MODULATION 213<strong>The</strong> curves of Figure 3 also show the value of carrier-noise ratiorequired to obtain the full frequency-modulation improvement for impulsenoise. It can be seen that for all practical purposes it can beassumed that the full improvement is obtained at a peak carrier-noiseratio of unity.
:..=214 FREQUENCY MODULATION, Volume Imay still be serviceable. On the other hand, if the impulse noise is ofa continuous nature like fluctuation noise, the noise discriminatesagainst the signal below the improvement threshold and, therefore,smothers the signal in the same manner that fluctuation noise does.<strong>The</strong> formula for the distance at which the improvement thresholdoccurs may be obtained by developing a formula for the distance fromthe transmitter at which carrier-noise ratios of four and zero decibelsare obtained in the intermediate-frequency channel of the frequencymodulationreceiver for fluctuation and impulse noises respectively.First—the equation for the carrier-noise ratio in the frequency-modulationintermediate-frequency channel must be determined. This maybe derived from (4) which gives the peak carrier-noise ratio as definedfor an amplitude-modulation system. For a given radiated carrier, thecarrier-noise ratio in the frequency-modulation receiver is less thanthat defined by (4) by a factor which depends upon the ratio of theeffective band widths of the two receivers and upon the type of noise.For the case of fluctuation noise,1C e/N - C/N X (fluctuation noise) (7)(F fi/2F a ) >/'where C = carrier level in i-f amplifier of the frequency-modulationreceiver,N = noise level in i-f amplifier of the frequency-modulationreceiver,F fi— i-f band width of frequency-modulation receiver,F a— band width of audio spectrum it is desired to receive.inFor convenience let Z f= F fi/2F afor fluctuation noise. Substituting(7), we obtain:C C 1= — X- (fluctuation noise) (8)N N VZ f<strong>The</strong> equation corresponding to (8) for impulse noise, which variesdirectly with the band width instead of as the square-root of the bandwidth, will beC C 1N_— (impulse noise) (9)N Z iwhere Z i= F fi/2F a for impulse noise.<strong>The</strong> factors \fz' fand Z itwhich are the ratios between one-half theintermediate-frequency channel width and the audio channel widthof the frequency-modulation receiver for the two types of noise, are
::SERVICE RANGE OF FREQUENCY MODULATION 215noise-determining ratios and, therefore, must be expressed in terms ofequivalent channel widths. <strong>The</strong> equivalent channel widths are differentfor the two types of noise; hence, a separate factor is used for eachtype of noise. For fluctuation noise, the equivalent channel width isdetermined by dividing the area under the energy response curve (theselectivity curve plotted with the ordinates squared) by the height ofthe curve at resonance. This gives the width of the rectangular channelwhich would be equivalent to the actual round-topped channel. Forimpulse noise, the equivalent channel width is determined by dividingthe area under the amplitude response curve by the height of the curveat resonance.A further simplification of the ratios, Z fand Z u may be effected byexpressing them in terms of the deviation ratio, fi. Thus,Z f=K f n(fluctuation noise) (10)Zi — KiH (impulse noise) (11)where K f= F n /2F d (fluctuation noise) (10a)and K t=F fi/2F d(impulse noise) (11a)in which F d= maximum applied frequency deviation.<strong>The</strong> factors K fand Ktexpress the ratio between the equivalent bandwidths of the intermediate-frequency channel and the total plus andminus peak frequency deviation of the frequency-modulation system.In other words they specify how far out on the intermediate-frequencyselectivity curve the frequency deviation may be carried.In order to determine the formula for the carrier-noise ratio inthe frequency-modulation intermediate-frequency channel for the caseof fluctuation noise, (4) and (10) may be substituted in (8) whichgivesCN0.0067 \ZWahfD,«-N D n VK^i(fluctuation noise, peak values) (12)Likewise, for impulse noise (4) and (11) may be substituted in (9)which givesC„ 0.0067 VWahfD,"-*= (impulse noise, peak values) (13)N K, (i D» N(12) and (13) give the carrier-noise ratio in the intermediatefrequencychannel of the frequency-modulation receiver for the twotypes of noise. Since it is known that the improvement threshold
216 FREQUENCY MODULATION, Volume Ioccurs when these carrier-noise ratios are equal to four and zerodecibels, respectively, the distance at which the improvement thresholdwill occur for a given set of transmission conditions may be determinedby equating (12) to 1.585 (four decibels) and (13) to unity (zerodecibels), and solving for the distance.Thus,0.0042 ^WahfD,»-\ 1/nDj =f )(fluctuation noise) (14)N \fK^LD.=0.0067 \JW~ahf D,r 2 \ 1/nNK&(impulse noise) (15)in which D tindicates the distance at which the improvement thresholdoccurs.A study of (14) and (15) shows the effect of a variation of thetransmission conditions. For both types of noise the distance to theimprovement threshold is directly proportional to the l/2w power ofthe watts radiated. Hence, for the higher radiation frequencies, wherethe exponent "n" is large, the improvement threshold distance increasesmore slowly with increase in power. For fluctuation noise,the improvement threshold distance is inversely proportional to thel/2w power of the product of the factor K fand the deviation ratio.Thus, as the deviation ratio is increased, the improvement thresholddistance decreases and decreases at a less rapid rate when it is beyondthe horizon and for the higher radiation frequencies where the exponent"n" is larger. <strong>The</strong> importance of making the factor K, as smallas possible, by carrying the frequency deviation out on the selectivitycurve as far as possible, is also indicated. When the noise is impulsenoise (formula 15) the improvement threshold distance is inverselyproportional to the "w"th root of the product of the factor K tand thedeviation ratio. Consequently, with this type of noise, the improvementthreshold distance decreases more rapidly as these factors areincreased.<strong>The</strong> distances given by (14) and (15) may be substituted in (5)and (6) to find the frequency-modulation signal-noise ratio existingat the improvement threshold as follows:S,/N, (at D t )= 1.585 V3/i V7^I= 2.74 \f~K~,^ (fluctuationnoise) (16)S f/N, (at Dt) =2tiK { fi= 2 K, y? (impulse noise) (17)
SERVICE RANGE OF FREQUENCY MODULATION 217Effect of Pre-Emphasizing the Higher Modulation FrequenciesAs has been pointed out for the case of amplitude modulation 5 ,use of pre-emphasis circuit at the transmitter and a de-emphasis circuitat the receiver produces an overall gain in signal-noise ratio.This gain depends upon the fact that the higher modulation frequenciesof voice and program material are of such a small amplitude thattheir accentuation does not increase the peak voltage of the appliedmodulating wave as much as the restoring circuit at the receiverreduces the noise. Thus, when the pre-emphasis circuit is inserted atthe transmitter; the peak voltage of the modulating wave may increasesomewhat so that the modulation level must be lowered, but this lossat the transmitter is overshadowed by the gain at the receiver. Consequentlythere are two quantities which must be evaluated—the lossat the transmitter and the gain at the receiver.In order to determine the losstheintroduced by the pre-emphasis circuitat the transmitter, the following experimental observations weremade: <strong>The</strong> equivalent of a two-string oscillograph was arranged byusing two electronically switched amplifiers to feed the vertical platesof an oscilloscope. <strong>The</strong> outputs of the amplifiers were common, withone of the separate inputs being fedby program material through apre-emphasis circuit. <strong>The</strong> gain of the two amplifiers was equalizedat a low modulation frequency where the pre-emphasis circuit was noteffective. <strong>The</strong> two amplifiers were alternately switched on by meansof a 60-cycle square-wave form and the oscilloscope sweep circuitsynchronized with the 60 cycles. <strong>The</strong> resulting pattern on the oscilloscopescreen consisted of two segments of sweep one of which wasactuated directly from the program material and the other throughthe pre-emphasis circuit.Hence, an accurate method of comparing thepeak voltages of the two waves could be provided by inserting anattenuator in the pre-emphasized circuit and setting for equal peakvoltages indicated by the two traces on the oscilloscope.<strong>The</strong> observations made with the electronic-switch oscillograph coveredall types of program material and were made for two audio-bandwidths of 5 and 12 kilocycles. <strong>The</strong> results of the observations indicatedthat in general the insertion of the pre-emphasis circuit increases thepeak voltage of the level about 2.5 decibels for both the 5 and 12-kilocycleband widths. On certain material such as guitar, harmonica, andpiano solos, the level is raised about 4.5 decibels total, but the occasionof such rises is rather infrequent and their duration very short.Hence,a permanent attenuation of 2.5 decibels might be inserted and thevolume-limiting equipment relied upon to take care of the occasionalhigher peaks.
218 FREQUENCY MODULATION, Volume I<strong>The</strong> action of the de-emphasis circuit in reducing the noise at thereceiver is somewhat greater for the case of frequency modulationthan it is for amplitude modulation. <strong>The</strong> reason for this is shown inFigures 4 and 5 which show the noise spectrums obtained in the outputof the amplitude and frequency-modulation receivers, respectively,with and without the use of a de-emphasis circuit such as would beused with a pre-emphasizing circuit in accordance with R.M.A. TelevisionTransmission Standard M9-218 at the transmitter.In the caseof amplitude modulation, the normally evenly distributed noise is concentratedat the lower modulation frequencies. In the case of frequencymodulation, the triangular noise spectrum is changed to a spectrum
SERVICE RANGE OF FREQUENCY MODULATION 219of the energies passed by the two spectrums; the root-mean-squarevoltage ratio is the square-root of this area ratio. <strong>The</strong> correspondingcomparison for impulse noise may be calculated by comparing theareas of the spectrums. <strong>The</strong> ratio of the areas of the spectrums givesthe peak voltage ratio directly for impulse noise. <strong>The</strong>se areas may beobtained by integration or they may be plotted and a planimeter used.<strong>The</strong> curves of Figure 6 show the results of such a determination bythe use of integration. <strong>The</strong>se curves give the signal-noise ratio gaineffected by the de-emphasis circuit alone. To obtain the overall gaindue to pre-emphasis, the transmitter loss of 2.5 decibels must be subtractedfrom the values indicated by the curves.—r44
220 FREQUENCY MODULATION, Volume Jlistening test and the overall gain isobtained by subtracting the transmitterloss of 2.5 decibels from the values obtained from Figure 6.For speech reception, where the noises were balanced for equalintelligibility, it was found that there was little or no gain effectedby the de-emphasis circuit. For the case of amplitude-modulationnoise, the use of pre-emphasis would apparently entail a slight loss inintelligibility when the 2.5 decibel transmitter loss was subtracted.With frequency-modulation noise, an intelligibility gain of a few decibelswould be realized.In connection with the listening testsanother interesting observa-*t16-r
:jSERVICE RANGE OF FREQUENCY MODULATION 221Example<strong>The</strong> curves of Figures 7, 8, 9, and 10 have been calculated for thefollowing assumed transmission conditions for a high-fidelity broadcastsystemTransmitting antenna heightReceiving antenna heightAudio channelFrequency= 800 feet.= 30 feet.= 15 kilocycles.= 42 megacycles.Maximum frequency deviations = 20 and 75 kilocycles.
222 FREQUENCY MODULATION, Volume Iin such a system, the increase in power would be two-to-one.<strong>The</strong> usualfactor of four-to-one assumes the more inefficient types of low-levelmodulation.<strong>The</strong> values of signal-noise ratio obtained for all of the curves werecorrected by subtracting one-half the maximum fading range as portrayedby Figure 2. Formula (4) was used to calculate the averagesignal-noise ratio for amplitude modulation and the fading correctionwas applied to obtain the minimum signal-noise ratio.It was assumedthat the transmission conditions of the fading correction curve werenear enough to the conditions of this example to allow this directcorrection without interpolation.Where the propagation curves of the corresponding amplitude-modulationsystem were to be. determined as well as those of the frequencymodulationsystems, which was the case in this example, the simplestprocedure was to draw the amplitude-modulation curves and then constructthe frequency-modulation curves which follow lines parallel tothe amplitude-modulation curve, but at higher signal-noise ratio levelsfor distances within the improvement threshold distances. To do thisthe average amplitude-modulation signal-noise ratios for fluctuationnoise were calculated from (4). <strong>The</strong>se were corrected for fading andthe pre-emphasis gain of 5.6 decibels was added. For the low-deviationfrequency-modulation system, the fluctuation noise gain is equal to 1.73times the deviation ratio, p. (/* = 20/15 = 1.33) or 7.2 decibels. <strong>The</strong>use of pre-emphasis adds another 7.4 decibels to the frequency-modulationgain as compared to the amplitude-modulation system with preemphasissince the total gain due to pre-emphasis on the frequencymodulationsystem is 13 decibels. <strong>The</strong> transmitter power gain addsanother 3 decibels. Hence the curve for frequency modulation with adeviation of 20 kilocycles is 7.2 + 7.4 + 3 = 17.6 decibels higher thanthecorresponding amplitude-modulation curve for the region withinthe threshold of improvement distance of the frequency-modulationsystem. <strong>The</strong> frequency-modulation system with a 75-kilocycle deviationhas a larger deviation ratio (/a = 75/15 = 5) so that its total gainover the amplitude-modulation system with pre-emphasis is 18.7 + 7.4+ 3 = 29.1 decibels.For the case of impulse noise, the frequency-modulation gains areequal to twice the deviation ratio and the pre-emphasis gains are alsodifferent. For amplitude modulation, the pre-emphasis gain is 7.5 decibelsand for frequency modulation it is 4.5 decibels more or a total of12 decibels. Hence, the gain of the frequency-modulation system usinga 20-kilocycle deviation is 8.5 + 4.5 + 3 = 16 decibels. <strong>The</strong> correspondinggain for the system using a deviation of 75 kilocycles is 20 + 4.5+ 3 = 27.5 decibels.
SERVICE RANGE OF FREQUENCY MODULATION 223In order to determine the signal-noise ratios at the improvementthreshold distances, the gains due to pre-emphasis must be added tothe signal-noise ratios calculated from (16) and (17). <strong>The</strong> preemphasisgains to be added in this case are the totalgains of 13 and12 decibels for fluctuation and impulse noise respectively. Beforeformulas (16) and (17) can be applied, the factors K, and K must betevaluated. <strong>The</strong>se factors are the ratios between the equivalent bandwidths of the frequency-modulation receiver intermediate-frequencychannel and the total plus and minus frequency deviation. It is obviousthat,in order to obtain the greatest distance to the improvementthreshold, the equivalent band width must be made as small as thefrequency deviation of the system will allow. <strong>The</strong> limitations encounteredare the introduction of harmonic distortion and the introductionof amplitude modulation due to the frequency variation exceeding theflat-topped portion of the selectivity characteristic. In practice thelimiter tends to take care of this departure from a flat-topped selectivitycharacteristic. Some rather preliminary measurements haveindicated that the deviation may extend out to about 2.5 decibels down(down to 75 per cent) on the sides of the selectivity curve without producingharmonics which are too high for high-fidelity reception.A study of typical intermediate-frequency equivalent band widthshas shown that the band width 2.5 decibels down is about 90 per centof the equivalent band width for fluctuation noise and about 78 percent of that for impulse noise. <strong>The</strong> factors K fand K are equal to thetreciprocals of these percentages or 1.1 and 1.3, respectively.<strong>The</strong> above evaluations of K fand K are based on somewhat incom-tplete distortion measurements and assume no guard band to take careof tuning drift in the case of the frequency-modulation systems.Furtherwork is undoubtedly necessary in these respects, but it is believedthat this evaluation will serve the purposes of this paper.With these evaluations of K fand K-„ formulas (16) and (17) simplifyto:S f/N, (at Dt) = 2.9 ii?'°- (fluctuation) (16a)S,/Nf (at Z>,) =2.6 a2(impulse) (17a)Applying (16a) to the system with a deviation of 20 kilocycles andadding the gain due to pre-emphasis of 13 decibels gives 25.9 decibelsfor the peak signal-noise ratio at the improvement threshold distance.<strong>The</strong> same calculation for the case of a 75-kilocycle deviation gives 43.2decibels. For impulse noise (17a) is used and a pre-emphasis gain of12 decibels is added to give ratios of 25.2 and 48.3 decibels for the twovalues of frequency deviation.
1224 FREQUENCY MODULATION, Volume I<strong>The</strong> curves of Figures 7 and 8 for fluctuation noise assume athermionic agitation and tube-hiss noise level equivalent to one peakmicrovolt per meter (0.224 r-m-s microvolts per meter). This correspondsto an r-m-s noise voltage of 0.52 microvolts in series with adummy antenna at the input terminals of the amplitude-modulationreceiver. Such a noise voltage is about that which would be obtainedwith good design using an 1852 radio-frequency amplifier tube. Allof the ratios for these curves were converted from peak to r-m-s ratiosto correspond to the general practice in considering this type of noise.This was done by adding 10 decibels to the ratios. <strong>The</strong> figure of 10"
SERVICE RANGE OF FREQUENCY MODULATION 225since root-mean-square values have little significance due to the veryhigh and variable crest factor.At distances beyond the improvement threshold for impulse noise,the curves are plotted for the condition of full modulation in whichthe improvement threshold manifests itself. Under this condition, thesignal-noise ratio is limited to a value which is equal to the deviationratio when pre-emphasis is not being used.It will be remembered thatthis ratio is what might be termed the "silencing" signal-noise ratiosince the noise tends to punch holes inthe signal, but when the noisepulses have a relatively slow rate of recurrence, this condition is quite6,7 . .60//V:.MI£SJFig. 9—Peak signal-noise ratio versus distance. Impulsenoise = 100 peak microvolts per meter.Curve I = amplitude modulation, 500 watts radiated.Curve II = frequency modulation, 1000 watts radiated,maximum frequency deviation = 20 kilocycles.Curve III = frequency modulation, 1000 watts radiated,maximum frequency deviation = 75 kilocycles.tolerable. On the other hand, if the pulses have a high rate of recurrence,the noise tends to smother the signal and service is limited tothe improvement threshold distance as in the case of fluctuation noise.When pre-emphasis is being used, a gain is added to this limited signalnoiseratio which isequal to the pre-emphasis gain of 7.5 decibels foramplitude-modulation noise. <strong>The</strong> pre-emphasis gain for amplitudemodulation noise is used in this case since the noise in the silencingcondition has lost its triangular spectrum characteristic of the frequency-modulationnoise received above the improvement threshold.Thus, for the system with a 20-kilocycle deviation, the signal-noiseratio in the silencing condition beyond the improvement threshold dis-
i226 FREQUENCY MODULATION, Volume Itance is 2.5 + 7.5 = 10 decibels. For the system with a 75-kilocycledeviation it is 14 + 7.5 = 21.5 decibels.At distances beyond the improvement threshold for impulse noisewhen the modulation is in the idle condition, the signal-noise ratiosare somewhat higher than those shown by the curves due to the synchronizationeffect pointed out by V. D. Landon. This results in aconsiderable reduction of the annoyance effect of the noise.Hence, thecurves may be taken as somewhat pessimistic, but satisfactory forcomparison purposes.DiscussionIt is apparent from the curves that the maximum distance issuch that the minimumserved if the maximum frequency deviation isopt
SERVICE RANGE OF FREQUENCY MODULATION 227It is seen from Figures 7 and 8 for fluctuation noise that at thedistance corresponding to the improvement threshold for a deviationof 75 kilocycles, a broadcasting service using a deviation of 20 kilocyclesyields a signal-noise ratio of 42 decibels.For the same distance,a service using a 75-kilocycle deviation yields a signal-noise ratio of53 decibels. At this point it is apparent that a 20-kilocycle deviationproduces a signal-noise ratio which is comfortably above what wouldbe considered commercially satisfactory,with an attendant conservationof band width in the available portion of the frequency spectrum.However, if it were assumed that a signal-noise ratio of 53 decibelsis necessary, this ratio may be obtained with a deviation of 20 kilocyclesat a somewhat shorter distance from the transmitter.For theconditions of the curves of Figures 7 and 8 this distance would be 20per cent shorter. On the other hand, a 20-kilocycle deviation is capableof furnishing what would be considered better than acceptable serviceout to a distance which is about 10 per cent greater than the maximumservice range for a 75-kilocycle deviation.itWhen the noise is impulse noise as portrayed by Figures 9 and 10,can be seen that the general shape of the curves are similar to thosefor fluctuation noise. If the frequency of recurrence happens to behigh so that the noise is continuous, the silencing properties of thefrequency modulation cannot be taken advantage of. Instead, thenoise, if stronger than the carrier, will depress the signal so as tosmother it.For this type of noise a low-deviation service will have agreater range than a high-deviation service by an amount that isconsiderablylarger than the corresponding case for fluctuation noise.This is especially true where the transmitter power is low enough tocause the improvement threshold to occur within the horizon as isthe case with the conditions of Figure 9.If the impulse noise happens to be automobile ignition where therate of recurrence of the pulses is rather infrequent and the time durationof the impulses short, the noise-silencing properties of the frequency-modulationsystem may be taken advantage of when the noiseis stronger than the carrier. With this type of noise, the effectivenessof the silencing action increases as the deviation is increased. However,for this type of noiss, even a system with a low deviation producesa noise output which has a rather low annoyance value.It is apparent that the service obtainable where fluctuation noisepredominates, may be predicted with a fair degres of accuracy.However,owing to the highly variable character and distribution of impulsenoise, predictions are difficult regarding this type of noise. Hence, itis felt that it is highly desirable to conduct field tests to further
228 FREQUENCY MODULATION, Volume Icompare the results of different deviations under actual service conditions.ConclusionsFrom the above considerations, it seems apparent that if fluctuationnoise is the primary limitation, a frequency-modulation broadcastingsystem using a deviation of 20 kilocycles will produce a signalnoiseratio greater than the values normally considered acceptable,for all distances out to the distance at which the improvement thresholdoccurs. If the limitation is impulse noise a similar relationship exists,but it is felt that further field work is desirable to study the resultsunder actual service conditions.<strong>The</strong> effect of increasing the deviation of the system is to reduce thedistance at which the threshold effect is realized, but at the same timethe signal-noise ratio at distances equal to or less than that distanceisimproved.<strong>The</strong> interests of band width conservation are, of course, best servedby a choice of the lowest value of deviation that will yield an acceptablesignal-noise ratio out to the threshold distance. It would alsoseem that the same choice will yield the desired service at the lowestcost.In order to evaluate carefully these effects under a large numberof actual service conditions, a series of field tests are being undertaken,using receivers designed for optimum performance at each of thedifferent values of deviation under consideration.Acknowledgment<strong>The</strong> guidance and helpful suggestions of Mr. H. 0. Peterson, andthe assistance of Mr. R. E. Schock in the experimental work of thispaper, are gratefully acknowledged.References1Murray G. Crosby, Frequency-Modulation Propagation Characteristics,Proe. I.R.E., Vol. 24, No. 6; June (1936).- Murray G. Crosby, Freauency-Modulation Noise Characteristics, Proc.I.R.E., Vol. 25, No. 4; April (1937).3H. H. Beverage, Some Notes on Ultra-High-Frequency Propagation,RCA Review, Vol. 1, No. 3, January (1937).4K. G. MacLean and G. S. Wickizer, Notes on the Random Fading of50-Megacycle Signals Over Nonoptical Paths, Proc. I.R.E., Vol. 27, No. 8;August (1939).
SERVICE RANGE OF FREQUENCY MODULATION 2295In an unpublished engineering report written in July (1933) andentitled: "Tests of a System for Reducing Interfering Noises in <strong>Radio</strong>Transmission", Messrs. I. Wolff, G. L. Beers, and L. F. Jones of RCA ManufacturingCompany describe tests which indicated improvements of from8 to 10 decibels in an amplitude-modulation program system.6 1. R. Weir, Comparative Field Tests of Frequency-Modulation andAmplitude-Modulation Transmitters, Proc. <strong>The</strong> <strong>Radio</strong> <strong>Club</strong> of America,Vol. 16, No. 2; July (1939).7 C. V. Aggers, Dudley E. Foster, and C. S. Young, Instruments andMethods of Measuring <strong>Radio</strong> Noise, A.I.E.E. Technical Paper 39-Hb, Preprintedfor A.I.E.E. Pacific Coast Convention, San Francisco, Calif., June26-30, 1939.
IMPULSE NOISE IN F-M RECEPTIONSByVernon D. LandonJRCA Manufacturing Co.,Inc.Summary— An investigation into the nature of impulsive noise in frequencymodulation receivers, making extensive use of oscillographic records.<strong>The</strong> relative effects of the plate-volt and grid bias types of limiteron impulsive noise are compared and recommendations made to insuremaximum noise reduction.IMPULSIVEnoise in frequency-modulation receivers has alreadybeen studied and reported by M. G. Crosby 1 and others. <strong>The</strong> purposeof the present article is to carry out the study in more detail.Certain theoretical considerations are presented and oscillographicconfirmation shown.When a shock, such as a noise pulse, is applied to the input of aradio receiver, a wave train or pulsation passes through the amplifier.<strong>The</strong> output of the final stage of the amplifier is a waive train which ischaracteristic of that particular receiver.<strong>The</strong> frequency of the wavetrain is the frequency of the center of the pass band, and the timeduration is l// cwhere /„ is one-half of the bandwidth. Typical responsewaveforms are shown in Figures 1A, IB, and 1C. <strong>The</strong>se oscillogramswere taken on the 5 Mc intermediate frequency amplifier of a frequencymodulation receiver having 200 kc bandwidth. In the cases1illustrated the time duration is about or 10 microseconds.100,000Thus, there are about 50 cycles present in the main portion of thewave train. <strong>The</strong> shape of the envelope of this wave train is a functionof the shape of the selectivity curve. <strong>The</strong>re is a tendency for thevoltage envelope to rise to a peak, drop to zero, and then reappear inthe form of a secondary lobe with the phase of the radio frequencywave reversed. <strong>The</strong> size of the secondary lobe is a function of theshape of the nose of the selectivity curve. A slightly double peakedselectivity curve results in a marked secondary lobe as shown inDecimal Classification: R630.3.f Reprinted from Electronics, February, 1941.J Now with the Research Department, RCA Laboratories Division,Princeton, N. J.1M. G. Crosby, "Frequency-Modulation Noise Characteristics", Proe.I.R.E., Vol. 25, April 1937, No. 6, p. 472.230
Figure 1A.IMPULSE NOISE 231<strong>The</strong> phase of the r-f wave reverses at the valley betweenthe lobes. A flat-topped selectivity curve gives a smaller lobe asshown at B. <strong>The</strong> lobe disappears as shown at C if the selectivitycurve is round nosed. <strong>The</strong> valley between the main lobe and thesecondary lobe goes to zero as in A if the selectivity curve is symmetrical.If one peak of the selectivity curve is higher than the other, thevalley between the lobes does not go to zero as shown at D.When a wave train such as that shown in Figure 1A is fed to adiscriminator of the type usually used in frequency-modulation receivers,the output has the form shown in Figure 1G. If the circuitWAVE TRAINDouble PeakedWAVE TRAINRat TopRound NoseDISCRIMINATOR OUTPUTOne Circuit One Circuit One CircuitMis-Tuned Tuned High Tuned LowDISCRIMINATOR OUTPUTGoodAfignmentOneCircuit HighDiscriminator RehiredPoor FidelityBalancePig.1—Oscillograms of noise wave train and output of discriminator forvarious conditions of tuning.were perfectly balanced, the output would be zero for this condition.<strong>The</strong> residual wiggles are due to slight imperfections in the balance.If one of the circuits of the receiver is detuned so as to give aselectivity curve with the low-frequency peak higher than the other,producing a wave train as in Figure ID, the discriminator output hasthe form shown at E. If the circuit is tuned to the other side makingthe high-frequency peak greater,that shown at F.the discriminator output changes toSimilar curves to E and F are obtained by mistuning the secondaryof the discriminator one way or the other. Thus, it appears that the
232 FREQUENCY MODULATION, Volume 1output of the discriminator goes plus or minus on the oscillogramaccording to whether the selectivity curve has more area above or belowthe frequency of resonance of the discriminator secondary. OscillogramH of Figure 1 shows the result of having the low-frequency peakexceed the high-frequency peak and of attempting to compensate bydiscriminator tuning. <strong>The</strong> indication is that the frequency of thepulse varies slightly with time for this condition.<strong>The</strong> output network of the discriminator consists of two separatediode output circuits connected in series. <strong>The</strong> fidelity of these twocircuits should be the same for a good balance, but this is not usuallyLow Gain Moderate Gain High GainWaveTrainC=1Q0;u,ufDiscriminatorOutputWaveTra i nO600;ujufDiscriminatorOutputFig. 2—Oscillograms of noise wave train and output of discriminatorshowing detuning due to grid current at higher amplitudes.obtained. <strong>The</strong> output circuit is grounded on one side instead of inthe center. This usually results in more capacitance across one sidethan across the other. This can be compensated for by adding capacitanceto the other side. <strong>The</strong> effect of a capacitance unbalance of 10micromicrofarads across 100,000 ohms is shown at I in Figure 1.Change of Tuning with Signnal StrengthAn unfortunate effect is the change in tuning with signal strength.This is illustrated in Figure 2. <strong>The</strong> oscillograms of this figure weretaken in the output circuit of a limiter. Limiter action was obtainedbecause of grid current and because of the low plate voltage employed.
IMPULSE NOISE 233At A the input level was too low for limiting to take place. <strong>The</strong>narrow neck between lobes indicates accurate alignment. <strong>The</strong> oscillogramsat B and C were taken at progressively higher signal levels.<strong>The</strong> deep valley between lobes is missing indicating that certain circuitswere detuned. <strong>The</strong> corresponding oscillograms of discriminatoroutput are shown at D, E and F.<strong>The</strong> fact that E and F go negativeshows that certain circuits are tuned to a lower frequency at the highersignal level. <strong>The</strong> circuit which is detuned most is the grid circuit of thelimiter. This is proved by the next six oscillograms. <strong>The</strong>se repeatthe conditions of the preceding six except that the grid of the limiterisnow fed by a tuned circuit having 600 micromicrofarads instead of100 micromicrofarads for a tuning condenser. <strong>The</strong> detuning at highsignal level is correspondingly less as illustrated by the deep valleybetween lobes at H and / and the smaller negative deflection at Kand L.<strong>The</strong> detuning caused by grid current can also be minimized byother methods. If the affected transformer is made broader than thepreceding stages the detuning will not affect the overall performance.Italso helps if the Q of the primary and the Q of the secondary areequal and if the coupling is less than critical in the affected transformer.Noise and Signal Applied TogetherWhen signals are being received, all the foregoing comments willapply only if the noise exceeds the carrier by about ten times or more.It is more usual for the noise to be less than the carrier or about equalto it. Under these conditions the noise output is a function of thereaction between the noise wave train and the carrier wave. <strong>The</strong> noisemay come through purely as amplitude modulation, as frequencymodulation, or as both, depending on the relative phase angle betweenthe noise wave and the carrier wave.To demonstrate these facts with an oscillograph itwas necessaryto build some special equipment. <strong>The</strong> difficulty with ordinary equipmentis to synchronize the impulse generator with the signal generatorso that the relative phase stays constant. Synchronization is obviouslyalmost impossible with separate sources. To get around thisdifficulty the two waves were obtained from the same source. <strong>The</strong>source chosen was a 10,000 cps oscillator which was fed into twochannels.In one channel the frequency was multiplied through a successionof stages up to the desired frequency of 5 megacycles.In theother channel the 10,000 cps wave was used to generate very narrowunidirectional pulses at the rate of 10,000 per second. <strong>The</strong> impulses
234 FREQUENCY MODULATION, Volume Iand the 5-Mc signal were applied simultaneously to the input of a5-Mc amplifier having a 200-kc bandwidth. Since the carrier waveand the impulses had a common source, the wave trains due to theimpulses always had the same phase relative to the carrier.However,the relative phase was adjustable by a slight change in the tuning ofone of the circuits in the frequency multiplier.Some of the oscillograms taken with this equipment are shown inFigure 3.In this figure the vertical column of oscillograms on the left
the discriminator.IMPULSE NOISE 235<strong>The</strong> intermediate phase angles produce both typesof modulation.<strong>The</strong> fact that the 90-degree phase angle produces the equivalent offrequency modulation can be seen by referring to the vector diagramon the left. <strong>The</strong> vector a represents the carrier wave, the vector brepresents the noise wave at the instant of its peak value and the vectorc represents the resultant when a and b are added. For the first halfof the duration of the noise wave the vector b is growing. For the secondhalf it is diminishing. During the time interval when b is growing,the phase angle between a and c is growing. Since frequency isthe rate of change of angle, the frequency of the vector c is low duringthe growth of b and high while b is decreasing. If b is much smallerthan a so that the angle is equal to its sine, then the frequency deviationis proportional to the rate of change of 6.In an amplitude-modulation receiver the output isa maximum fora 0-degree or 180-degree phase angle and the output wave form followsthe envelope of the noise wave train. In a frequency-modulationreceiver the output isa maximum at a 90-degree or 270-degree phaseangle, and the output waveform is the first derivative of the envelopeof the noise wave train.It should be noted that the output of the discriminatorfor 270 degrees is inverted compared to that for 90 degrees.Columns 3 and 4 in Figure 3 repeat the same tests except that adifferent signal-to-noise ratio was used. For columns 1 and 2 thesignal amplitude was twice that of the noise.For columns 3 and 4 thesignal had half the noise amplitude. It can be seen that with thestronger relative value of noise, the noise shows up as a peak even forthe 90-degree and 135-degree phase angles.For 180 degrees the noisebucks out the carrier completely and in addition there is a lobe inwhich the r-f voltage is 180 degrees out of phase with the carrier. Inspite of these differences the output of the discriminator has verymuch the same waveform for one signal noise ratio as for the other.This may be due to the inability of the audio circuit to follow thehigher-frequency components of the true wave form. <strong>The</strong> fidelitywould probably have to be flat to several hundred kilocycles to followthe output waveform accurately.Effectiveness of LimiterOscillograms of this nature can be used to test the effectiveness ofvarious types of limiters as demonstrated by Figure 4.the first column of oscillograms isIn this figurefor a signal-to-noise ratio of 2 andshows the output of a plate voltage limiter. This type of limiter obtainsthe limiting action by using a very low plate voltage. <strong>The</strong> r-f plate
236 FREQUENCY MODULATION, Volume Ivoltage swing is limited to something less than the d-c plate voltageemployed.<strong>The</strong> first oscillogram of the left-hand column is fordegrees phaseangle with a moderate amount of gain so that only partial limiting isobtained. For the second oscillogram the gain was increased so thatlimiter action was almost perfect. <strong>The</strong> third and fourth repeat the conditionsexcept that the phase angle between signal and noise is 180degrees. This shows that the plate voltage limiter is a rather goodlimiter.<strong>The</strong> second column of oscillograms is for a grid-leak limiter. Thistype of limiter obtains the limiting action by allowing the tube to biass/n?2s/n - '/2PlateGridPlateGridVoltageLeakVoltageLeakLimiter Limiter * LimiterLimitero°ModerateGain0*HighGain180°HighGainFig. 4—Oscillograms demonstrating the relative effectiveness of platevoltage and grid leak limiters.itself off as the signal increases in amplitude.to keep the circuit response as fast as possible.It is obviously importantFor these oscillograms100,000 ohms and 20 micromicrofarads were used. <strong>The</strong> other conditionsfor the second column are the same as for the first.<strong>The</strong>se testsseem to indicate that the grid-leak limiter is not as satisfactory as theplate voltage type. <strong>The</strong> grid condenser apparently cannot charge uprapidly enough to follow the pulsation. However, it does build up someextra bias during the pulsation, and after it is over, the carrier is attenuatedfor a short time until the extra bias leaks off.<strong>The</strong> third and fourth columns in Figure 4 repeat the conditions of
IMPULSE NOISE 237the first and second except that the noise amplitude is twice that of thesignal. For a phase angle of degrees the plate voltage limiter stilldoes a good job, but the defects of the grid-leak limiter are magnified.For a phase of 180 degrees even the plate-voltage limiter fails as itobviously must since the phase of the resultant wave is reversed duringthe central portion of the noise pulse.Noise with Carrier DetunedAs a matter of fact, these oscillograms are not as important as theyseem at first sight. As was shown in Figure 3, amplitude modulationdoes not come through the discriminator when the noise pulse and thecarrier are synchronous.Thus a limiter does no good under conditionsof no modulation if the signal carrier is tuned to the center of the passband.Actually, the limiter action may make the noise worse, as was shownin Figure 2 in which grid current was shown to detune the correspondingtuned circuit. This is also illustrated in the bottom oscillogram ofthe third column of Figure 4.It will be noted that the valley at the endof the lobe is not as deep as it should be. This is a sign of detuningdue to grid current.<strong>The</strong> only time a limiter helps to reduce the noise is when the carrierisnot in the center of the pass band because of mistuning or modulation.If the carrier wave is tuned to the edge of the pass band, there isa beating action between the noise wave train and the carrier wave.<strong>The</strong> frequency of the beat note is /„ where /„ is one-half the bandwidthof the receiver.Thus, the beat note goes through one cycle in a periodof time equal to l// c. However, the duration of the pulse itself is alsol/f (this is accurately true in a sharp cutoff filter and roughly true inany filter depending on what per cent of peak amplitude is called cutoff).Thus, the beat note goes through one complete cycle in the durationof the noise wave train. This is illustrated in Figure 5. In thefirst oscillogram of the first column, the noise wave starts out 180degrees out of phase with the carrier wave. As the noise wave grows,it gradually changes its phase relative to the carrier so that at thepeak of the pulse it is in phase. <strong>The</strong> relative phase continues to changefor the duration of the pulse so that at the end of the pulse it is again180 degrees. Since the relative phase assumes all possible values in theduration of each pulse it is difficult to assign a value to it. However, therelative phase at the peak of the pulse has a definite meaning and iton this basis that the various oscillograms of the first column arelabelled. It can be seen that as the relative phase is changed, the valleyof the beat note travels progressively across the noise pulse. <strong>The</strong> corre-is
238 FREQUENCY MODULATION, Volume Isponding output of the discriminator is shown in the second column.For the detuned condition characteristic of the oscillograms of Figure5, it can be seen that the greatest noise output occurs for the 180-degree position. This can be partially explained simply on the basis ofamplitude modulation. <strong>The</strong> carrier alone is producing a d-c output correspondingto peak frequency deviation on the discriminator curve.<strong>The</strong> reduced amplitude during the pulse reduces the d-c output voltagemomentarily.<strong>The</strong> third and fourth columns of Figure 5 repeat the conditions ofPhases/n-'/2DiscriminatorOutput45°90°ISO"270°Fig. 5—Oscillograms of noise and discriminator output with carrier tunedto edge of the pass band.the first and second columns except that the signal-to-noise ratio ischanged from 2 to %. A curious effect is obtained in the third columnfor 180-degree phase angle. For this condition the amplitude-modulationcomponent disappears almost completely. In spite of the fact, thenoise output is a maximum for this phase angle. <strong>The</strong> reason for this isshown in Figure 6. <strong>The</strong> vector a represents the carrier wave and thevectors b lt b 2, b 3 and & 4represent the successive values assumed by thenoise pulse. <strong>The</strong> vector c represents the resultant wave (shown in oneposition only). Obviously c makes one complete revolution around theorigin. In other words the resultant wave picks up one extra cycle in
IMPULSE NOISE 239the duration of the pulse.<strong>The</strong> angular velocity of the vector c is twicethat of b at the peak value of b. Thus, at the peak of the pulse theresultant wave has an instantaneous frequency lying at theoppositeedge of the pass band from the signal carrier wave. This results inmaximum noise output. If similar circle diagrams are drawn for theother phase angles, they account for the results quite well.Effectiveness of Limiter with Signal DetunedObviously a limiter can do practically no good for the set of conditionsillustrated by Figure 6, since there is almost no amplitude modulationpresent. It is also true that the limiter does little good at anyphase angle if the noise is stronger than the signal. For cases wherethe signal is stronger than the noise, and the signal is tuned to the edgeFig. 6—Vector diagram corresponding to Fig. 5. Signal-to-noise ratio is 0.5.Relative phase is 180 degrees at peak of noise.of the pass band (columns 1 and 2, Figure 5) the limiter can do a certainamount of good, as is illustrated in Figure 7. Column 1 of thisfigure is for a signal noise ratio of 2, with the signal tuned to the highfrequencyside of the pass band. This is a duplication of column 2 ofFigure 5 except that the signal is tuned to the opposite side of the passband.Column 2 was taken under the same set of conditions as column 1,except that a plate voltage limiter was used. <strong>The</strong> oscillograms ofcolumn 2 represent an appreciable noise reduction over those of column1. Strangely enough, column 3 which is for a grid-leak limiter, appearsto be equally good.Perhaps it is not quite self-evident that column 2 does represent a
240 FREQUENCY MODULATION, Volume Inoise reduction over column 1.This can be made clear by referring toFigure 8.Frequency Spectrum of Certain PulsationsIn Figure 8 several forms of pulsation are shown with the correspondingenergy distribution curves. <strong>The</strong> first pulsation is called "unitNo Li miterPlate VoltageLimiterGrid LeakLimiterFig. 7—Oscillograms illustrating noise reduction by plate voltage and gridleak limiters.step." <strong>The</strong> corresponding distribution curve has its amplitude inverselyproportional to the frequency.If the first derivative of the unit step is taken the result is calledunit impulse. It is supposed to have infinite amplitude and zero time
duration but it encloses unit area.of energy at all frequencies.IMPULSE NOISE 241Unit impulse has the same amountIf a unit impulse is applied to an ideal low pass filter, the theoreticalsin 2irf toutput is,which is the pulsation illustrated. <strong>The</strong> energydistribution is uniform out to the cutoff frequency.If the first derivative of this pulsation is taken, the result is thepulsation illustrated at the bottom of the figure. <strong>The</strong> energy content ofthis wave is directly proportional to the frequency up to cutoff.Pig. 8—Various types of pulsations and the corresponding curves of relativeamplitude vs. frequency.It isapparent that many of the oscillograms representing the discriminatoroutput are similar to one or the other of these pulsations.Now the bandwidth of a frequency-modulation receiver is 200 kc, sothat from a modulation standpoint the cutoff is 100 kc. <strong>The</strong> energy contentin the audio spectrum isthat represented by the shaded area ineach case. It is obvious that much less energy is present in the audiospectrum of the pulsation illustrated at the bottom of the figure. Oneway of looking at it is that the low-frequency components of the wavetend to cancel out if the area in the pulse above the axis is equal to thearea below the axis.
:242 FREQUENCY MODULATION, Volume I<strong>The</strong>ory of Improvement Due to LimiterReferring again to Figure 7, there are several oscillograms in column1 which do not have equal area above and below the axis. Thisinequality is almost eliminated in columns 2 and 3, indicating a reductionin the low-frequency energy content. <strong>The</strong> equalization of area is tobe expected from a theoretical standpoint. If the noise amplitude isless than the carrier amplitude, the resultant wave can neither gain norlose a cycle. If no cycles are gained nor lost, then the frequency mustaverage the same as the carrier. Thus if the limiter takes out amplitudevariations in the resultant wave, the output of the discriminator musthave equal area above and below the axis.Thus, a limiter does reducethe amount of noise if the carrier is detuned and if the noise is weakerthan the signal. When the signal is accurately tuned in, the improvementdue to the limiter takes place only on noise pulses which occurwhile the carrier is deviated from center by modulation.Recommendations for Improved PerformanceFrom the data provided by all these oscillograms, certain recommendationscan be made for improving the performance of frequencymodulationreceivers1. If the best noise reduction is to be obtained, the selectivity curvemust be symmetrical and the discriminator must be accurately centered.More specifically, the overall curve through the discriminatormust be symmetrical. <strong>The</strong> best noise reduction cannot be obtained ifthe selectivity curve is chair shaped, even if a limiter is used.2. This symmetry must be maintained for all possible signalstrengths. If automatic volume control is employed, consideration mustbe given to the fact that the input capacitance of the tubes varies withbias. A large enough tuning condenser must be used on the grid circuitsto make the change in tuning negligible.If automatic volume controlis not used, account must be taken of the change in tuning due togrid current. Large tuning condensers should be used for any tunedcircuits feeding grids that are apt to draw grid current. <strong>The</strong> degreeto which symmetry has been maintained in the presence of grid current(or limitation of any kind) can best be shown by a series of oscillogramsof the type of Figure 2. <strong>The</strong> desired information cannot beobtained by means of a selectivity curve because any lack of symmetryis masked by the limiter action. <strong>The</strong> apparent selectivity curve takenpoint by point might appear symmetrical because of the action of thelimiter in flattening the top of the curve. Under the same conditions,impulsive noise might come through at a frequency deviating from the
IMPULSE NOISE 243center of the pass band, the deviation being caused by grid currentwhich detunes one circuit during high amplitude impulses.From further tests, not shown here, the grid-leak type of limiterseems to be particularly good in avoiding the detuning due to gridcurrent.in spite of itsIn fact, it seems to be the most desirable type of limiter tested,apparent inability to remove the amplitude modulation.If Figure 4 is re-examined keeping Figure 8 in mind, it can be seen thatthe grid-leak limiter does remove the low-frequency components fromthe envelope of the wave.This type limiter may also be used as a sourceof automatic volume control voltage. It may be used in combinationwith the plate voltage limiter to obtain still better limiter action.3. In the output circuits of the discriminator the two sides of thecircuit must have the same fidelity characteristics. A good fidelity balanceis seldom obtained in practice because the output circuit is usuallygrounded on one side instead of the center. As a result, there is morecapacity across the grounded side than across the high side. <strong>The</strong> extracapacity can be compensated for, as shown in Figure 1.4. From the standpoint of noise reduction the limiter has littlevalue, providing the circuit constants are properly balanced. <strong>The</strong>limiter helps to reduce the noise only when the instantaneous frequencyof the carrier is off center. If the signal is accurately tuned in, thismeans that the improvement takes place only on noise that occursduring a modulation peak.Noise which occurs only during modulationpeaks is very likely to be masked by the modulation. However, thedesirability of a limiter isaffected by other considerations than noisereduction. For example, the limiter does reduce the distortion if theselectivity curve is not flat over the 200-kc frequency band. This maymake it desirable to retain the limiter. <strong>The</strong> grid-leak type of limiterseems to be almost as effective for noise reduction as the plate-voltagelimiter in spite of itsmodulation.demonstrated inability to remove the amplitudeA more accurate idea of the degree of usefulness of a limiter canbe obtained by referring to Table I. <strong>The</strong> upper table indicates thedegree of noise reduction obtainable for relatively weak noise pulses.It indicates that the use of a limiter,and the symmetry of the selectivitycurve are unimportant, providing the instantaneous frequencyof the carrier wave corresponds to the frequency of zero output at thecenter of the discriminator curve. It also indicates that if the frequencyof the carrier wave has a slightly different value, the limiteris of importance, but a symmetrical selectivity curve is still notnecessary.
244 FREQUENCY MODULATION, Volume I<strong>The</strong> lower table is for relatively strong noise pulses. It indicatesthat for this condition the limiter is useful only when the overallselectivity curve has poor symmetry. That portion of the noise pulsewhich is greatly in excess of the carrier level may be removed aboutequally well by the limiter or by the symmetry of the selectivity curve.Table INoise Much Less Than SignalSignalCenteredCircuit Conditions **
INTERMEDIATE-FREQUENCY VALUES FORFREQUENCY-MODULATED-WAVERECEIVERS*!ByDudley E. Foster and John A. RankinRCA License Laboratory, <strong>New</strong> York, N. Y.Summary— <strong>The</strong> selection of an intermediate frequency for a superheterodynereceiver involves consideration of the signal frequency, thetuning range, the pass-band width, the minimizing of spurious responses,regeneration stability and frequency stability. <strong>The</strong> consideration of thefrequency-modulation broadcast band of i2 to 50 megacycles illustrates themanner in which these several factors affect the choice of intermediatefrequency.Likelihood of Spurious Responses in Frequency-Modulation ReceiversFREQUENCY-MODULATION receivers are subject to spuriousresponses as are amplitude-modulation receivers, and because ofthe probable frequency-modulation-transmitter locations, thespurious responses are likely to be worse than on the present broadcastband. <strong>The</strong> superheterodyne type of receiver is used almost universallytoday because of its great advantage in sensitivity and selectivity, butit is subject to spurious responses. <strong>The</strong> selectivity requirements in the42- to 50-megacycle frequency-modulation band are so severe that theuse of the superheterodyne is even more necessary there than in thestandard broadcast band.Stations may be assigned to alternate channels in the frequencymodulationband in a given locality. Since the channels are 200 kilocycleswide this permits assignments 400 kilocycles apart. At the meanfrequency-modulation band frequency of 46 megacycles a separationof 400 kilocycles is the same per cent separation as 10 kilocycles at1150 kilocycles so that selectivity becomes a prime consideration.Since the service area of a frequency-modulation transmitter isessentially limited by the horizon, transmitter antennas will have asgreat a height as possible.In large cities this means that the tendencywill be to place the transmitter antenna on the tallest building available.Since tall buildings are generally in the center of the city, it is likely* Decimal classification: R630.1 X R361.111.t Reprinted from Proc. I.R.E., October, 1941.245
246 FREQUENCY MODULATION, Volume Ithat many frequency-modulation transmitters will be located in closeproximity to each other near the center of population of the area.Withtransmitters so located, high field intensities will occur at many receivinglocations, a condition which favors generation of spurious responses.Types op Spurious ResponsesSpurious responses may be of several types, some of which areunique to superheterodyne receivers, others exist in any type of receiver.<strong>The</strong> types of spurious responses which may exist in frequencymodulationreceivers are 1. image response, 2. direct intermediatefrequencyresponse, 3. response from two stations separated by theintermediate frequency, 4. combination of signal and oscillator harmonics,5. half-intermediate-frequency image response, 6. cross modulation,and 7.intermediate-frequency harmonic response.Cross modulation, whether within the receiver or of the externaltype, does not depend upon the type of receiver. <strong>The</strong> other forms ofspurious responses occur only in superheterodynes. <strong>The</strong>refore thechoice of intermediate frequency does not influence this category ofspurious response.Image ResponseImage response in frequency-modulation receivers is similar innature to that in amplitude-modulation receivers. Since the band extentis only 8 megacycles (42- to 43-megacycle educational and 43- to 50-megacycle commercial broadcasting)and intermediate-frequency over4 megacycles will prevent image response from frequency-modulationstations. Consideration must also be given to image response fromother radio services, but except for television transmitters and possiblyamateur and police transmitters, the location will make image responseunlikely.Furthermore, the greater frequency separation of such transmissionswill aid the radio-frequency attenuation of the image-frequencyresponse.Direct Intermediate-Frequency ResponseTransmission of signals having the same frequency as the intermediatefrequency through the radio-frequency system isto be a serious factor in frequency-modulation receivers.not believedVirtually anyintermediate frequency chosen will be so far different from the radiofrequencytune frequencies, that attenuation at the first-detector inputwill be considerably better than in the case of the 455 kilocycles on thestandard broadcast band. Nevertheless, all other things being equal,
INTERMEDIATE-FREQUENCY VALUES 247choice of a frequency to minimize direct intermediate-frequency responseis desirable.Eesponse from Two Stations Separated by theIntermediate FrequencyIn this type of response one of the signals acts at the first detectoras the local oscillator for the other signal, the detector output being theintermediate frequency. This type of response is likely to be seriouson frequency modulation when a low intermediate-frequency value isused, because stations may be allocated every 400 kilocycles in a giventerritory, and the per cent frequency separation is small with respectto the signal frequency. This type of response is particularly troublesome,because in localities where two strong signals exist separatedby the intermediate frequency, they will be heard throughout thetuning range of the receiver.Combination of Signal and Oscillator HarmonicsMost oscillators have appreciable harmonic content, so that ifconditionsexist under which signal harmonics occur in the first detector,spurious responses will result.<strong>The</strong> most common condition for signalharmonicproduction is when the signal exceeds the bias. Many frequency-modulationreceivers have not used automatic volume control,depending upon the limiter to maintain a uniform signal at the seconddetector. Under such conditions, particularly with a radio-frequencyamplifier present, relatively low-intensity signals will generate harmonics.Even with automatic volume control, harmonics may be generatedby an undesired signal of high intensity when the receiver istuned to a weaker desired signal. Whenever the difference frequencybetween the harmonics of signal and oscillator is equal to the intermediatefrequency, a spurious response will occur.Half Intermediate-Frequency ImageThis type of response in which the interfering signal differs fromthe oscillator by half the intermediate-frequency value, depends uponproduction of the second harmonic of this difference frequency in theconverter plate circuit. <strong>The</strong> second-harmonic generation in the converteris usually sufficiently small so that this type of response is notserious despite the fact that the radio-frequency separation of interferingand desired signals necessary for its production is small.
248 FREQUENCY MODULATION, Volume IIntermediate-Frequency Harmonic KesponseResponse at frequencies which are harmonics of the intermediatefrequency may be generated in the converter, but, unless an unusuallyhigh intermediate-frequency value is used, only high harmonic orderscan fall within the frequency-modulation band. As the amplitude ofthe harmonics decreases rapidly with harmonic order, littleis to be expected in practice from this type response.difficultyInfluence of Intermediate Frequency on Spurious Responses<strong>The</strong> value of intermediate frequency chosen has a large influenceon the number of spurious responses produced.It is evident that, witha frequency range of 8 megacycles, an intermediate frequency higherthan 4 megacycles will eliminate image response due to frequencymodulationstations.Similarly an intermediate frequency higher than8 megacycles will eliminate responses from two stations separated bythe intermediate frequency and an intermediate frequency higher than16 megacycles will eliminate the half-intermediate-frequency image.<strong>The</strong> effect of intermediate frequency on combinations of signal andoscillator harmonics is not as obvious, and detailed analysis is requiredto determine them.Any combination of signal and oscillatorharmonics which resultsin the chosen intermediate frequency will produce a spurious response.It is assumed that the receiver can be tuned to any frequency between42 and 50 megacycles. Also only signals between 42 and 50 megacyclesare considered. <strong>The</strong> analysis of the number of spurious responses producedis made without regard to the radio-frequency selectivity. Thatis,for any signal between 42 and 50 megacycles any tune point in thesame range may be chosen. It is, therefore, necessary to consider everypossible tune frequency for every signal frequency in the range.In determining the number of spurious responses, consideration ofthe relative magnitudes is reserved for later discussion. <strong>The</strong> lowestfrequency channel is 42.1 megacycles and the highest frequency 49.9megacycles, a total of 40 in all. It is assumed that the total numberof spurious responses from any cause is additive. That is, if for anygiven tune frequency there are three different signal frequencies whichcan cause a spurious response, three spurious responses are countedfor that tune frequency. Thus, for some values of intermediate frequency,while there are 40 frequency-modulation channels, the numberof spurious responses is appreciably higher than 40. This form ofanalysis is more illuminating than indicating only the actual channelson which interference can occur without regard to the frequencies
INTERMEDIATE-FREQUENCY VALUES 249causing the interference. This is so because spurious responses willbe caused mainly by strong signals, and a condition which will permitinterference from any one of three undesired signals will be threetimes as liable to interference as one where there is possibility ofspurious rsponse from only one undesired signal. In the latter casethe undesired signal might be too weak to cause a spurious response,whereas in the former case, if any one of the three undesired signalsis strong enough a spurious response will occur. It is further assumedthat tuning is continuous between 42 and 50 megacycles, but thatsignals are confined to definite channels.LetS = signal frequency= oscillator frequency/ = intermediate frequencyT = tune frequencyM = signal-harmonic orderAT = oscillator-harmonic order<strong>The</strong>n, for spurious response to occur,MS±I= NOT = 0±IMS±I = NT± NIM= T
250 FREQUENCY MODULATION, Volume Ision for all tune frequencies between 42 and 50 megacycles. It isapparent that consideration should be given to the oscillatorhigherthan the tune frequency separately from the condition for oscillatorlower than the tune frequency, since the oscillator cannot change fromone side to the other during the tuning process.To illustrate, suppose a receiver has an intermediate frequency of4.0 megacycles and is tuned to 49 megacycles ; the oscillator is then at45 megacycles and its second harmonic is 90 megacycles. If the secondharmonic of the signal isat either 86 or 94 megacycles, the resultantintermediate frequency is 4.0 megacycles and a spurious responseoccurs. That is, the fundamental of the signal may be either 43 or 47megacycles.t 4 t a 10 it 14 » la to & -m/A/TeBIHE0l/IT£Ffl£Cl/£NCV M M£G/KYCL£$Fig. 1—Spurious responses caused by harmonic combinations of signal andoscillator versus intermediate frequency.Signals: from 40 channels between 42 and 50 megacycles.Tuning: from 42 to 50 megacycles.M = signal-harmonic order.N = oscillator-harmonic order.Oscillator lower than tune frequency.From an examination of the above expressions it may be seen thatvariation of spurious responses with intermediate frequency is a linearfunction, so that a plot of the variation of spurious responses withintermediate frequency will consist of a series of straight lines.A plot of the number of spurious responses as a function of intermediatefrequency for the case where the oscillator frequency is lowerthan the tune frequency is shown in Figure 1 and for the case wherethe oscillator frequency is higher than the tune frequency in Figure 2.An examination of the expressions for spurious responses as afunction of intermediate frequency, along with the plots of Figures 1and 2, reveals that for the same harmonic order of signal and oscillatorfrequency, the number of spurious responses as a function of inter-
INTERMEDIATE-FREQUENCY VALUES 251mediate frequency is the same for the oscillator frequency higher orlower than the tune frequency. Further, the spurious responses dueto second harmonics of signal and oscillator go to zero at an intermediatefrequency of 16 megacycles and do not recur at any higherintermediate frequency. <strong>The</strong> spurious responses due to the third harmonicof signal and oscillator drop out at an intermediate frequencyof 12 megacycles, while the spurious responses due to the fourth harmonicof signal and oscillator drop out at 10.6 megacycles.When different harmonic orders of signal and oscillator are involved,the number of spurious responses is different when the oscillatorfrequency is higher than the tune frequency than that for the oscillatorfrequency lower than the tune frequency.5
252 FREQUENCY MODULATION, Volume Iseparated by the intermediate frequency, and spurious responses causedby oscillator and signal harmonics.In actual practice, stations will notbe so allocated in any given location, but the curves are valid in determiningthe best intermediate frequency to be used to reduce the numberof responses, regardless of how many stations are assigned in anyparticular location, provided of course the stations are uniformlylocated in the band.<strong>The</strong> relative severity of spurious responses is difficult to evaluateexactly without data as to the magnitude of signal-harmonic generationin the converter, which in turn depends upon the signal amplitude.However, an estimate may be made of the effect of oscillator harmonicsand instructive deductions made therefrom.In a typical converter of the pentagrid type, the amplitude of oscillatorharmonic has been found to be approximately proportional to*8\\\ ST\ \\ \i\\ T"\\2 4 « a 'o/MTfflU£D//>T£ Fff£Ol/eNCV /N M£G/ICYCtfSFig. 3—Interference caused by the image response and by two stationsseparated by the intermediate frequency versus intermediate frequency.Signals : from 40 channels between 42 and 50 megacycles.Tuning: from 42 to 50 megacycles.Oscillator either higher or lower than tune frequency.image.two stations separated by the intermediate frequency.1/N 2 ,where N is the order of the harmonic. <strong>The</strong> conversion gain isnot constant with respect to oscillator amplitude but reaches a maximum,usually a broad maximum (the conversion gain is substantiallyconstant over an appreciable oscillator range)at some value of oscillatorvoltage.For values of oscillator voltage below this maximum theconversion is, to a first approximation, proportional to the oscillatorvoltage. Since the oscillator amplitude is 1/JV 2 and the conversionproportional to amplitude, the conversion is approximately proportionalto 1/iV 2 if the converter is operated so that the fundamental does notexceed the optimum. If the fundamental somewhat exceeds the optimumconversion point, there will be no appreciable decrease in conversionfrom the optimum value. But under these conditions the secondharmonic may produce as much conversion gain as the fundamental.Consequently to minimize harmonic generation it is desirable to limitthe oscillator injection to a value only sufficient to develop maximum
INTERMEDIATE-FREQUENCY VALUES 253conversion. With the oscillator injection limited to such value, theprobability of a given signal causing a spurious response isinverselyproportional to the square of the oscillator-harmonic order involved.This factor may be applied to the calculations for signal- and oscillatorharmoniccombinations.Considering the image response; this isthe signal and the oscillator soasare the harmonic combinations.due to the fundamental ofshould not be decreased by any factorIn applying weighting to the case of two signals separated by theintermediate frequency, the oscillator isnot involved but the strengthof the spurious response is proportional to the strength of the signalsinvolved.This response will in general be less than that for the image.Accordingly a factor of 0.5 was applied to the two signals separatedby the intermediate frequency, giving ita weight between the imageand harmonic combinations due to the second harmonic of the oscillator.When weighting factors are applied we can no longer say that theordinates represent the number of spurious response signals. <strong>The</strong>ordinates in this case represent the probability of spurious responsesfor various intermediate-frequency values in a receiver having noselectivity ahead of the converter, with the probability for an intermediatefrequency of 1 megacycle considered to be 100. <strong>The</strong> variationof likelihood of interference is shown in Figure 4.This figure combinesthe weighted effect of image, two signals separated by the intermediatefrequency, and oscillator-signal harmonic combinations up to the fourthof both signal and oscillator.Itillustrates that the probability of interference decreases rapidlywith increasing intermediate frequency at firstand then more slowly,and that over the entire range of intermediate frequency there islittlechoice between oscillator lower and oscillator higher conditions. It doesnot indicate definitely any best intermediate frequency but does showthat a high intermediate frequency is better.While, as has been stated,direct intermediate-frequency interference is not believed to be a majorfactor, and as the image ratio for any intermediate frequency over 8megacycles should be adequately high for any receiver having morethan one tuned circuit ahead of the converter, nevertheless it is wellto minimize spurious response from these sources where no other disadvantageaccrues therefrom.In considering spurious responses, one characteristicof frequencymodulation, not heretofore mentioned, should be borne in mind, namely,that such responses when they occur on the frequency of a desiredsignal do not cause an audible whistle as they do on amplitude modulationbut appear essentially as cross talk.
254 FREQUENCY MODULATION, Volume I<strong>The</strong> types of signals, other than frequency-modulation stations,likely to cause interference are those where the transmitter may belocated in a populous district. <strong>The</strong>se are amateurs, television, andpolice signals mainly and possibly international broadcasting.If image response from other frequency-modulation stations is tobe eliminated an intermediate frequency of at least 4 megacycles hasbeen seen to be necessary. To minimize direct intermediate-frequencyinterference, a frequency range of some 200 kilocycles free from types112 4 a a /O 12 /* '& IS TO 22 *4MT£RM£D/ATE Fff£0(/£AICV W M£0/ICYCL£SPig. 4—Probability of spurious responses due to image, two signals separatedby the intermediate-frequency and harmonic combinations of signaland oscillator for different intermediate frequencies.Image weighting factor = 1.0.Two stations separated by the intermediate-frequency weightingfactor = 0.5.Spurious responses due to Nth harmonic of oscillator weightingfactor = 1/JV 2 .Probability of spurious responses for 1.0-megacycle intermediatefrequencytaken as 100.oscillator lower.oscillator higher.of services likely to cause such interference is required. <strong>The</strong> lowestsuch range above 4 megacycles is at 4.3 megacycles to which are allocatedgovernment, general communication, and coastal-harbor transmitters.Another intermediate frequency in that general range whichappears relatively free from direct intermediate-frequency interferenceis at 5.38 megacycles, where are allocated government, fixed, and generalcommunication channels.A frequency of 8.25 megacycles has been widely used as the inter-
INTERMEDIATE-FREQUENCY VALUES 255mediate frequency for the sound channel of television receivers, whichsuggests its use for frequency modulation in order to minimize componenttypes. Examination of frequency allocations shows that 8.26megacycles is somewhat better than 8.25 megacycles over a 200-kilocyclewidth. And that to 8.26 megacycles are allocated ship-telegraph andgovernment services, neither likely to cause interference. On the scoreof image, however, with the oscillator higher, both the 5-meter amateurand the second television bands fall within the image range. With theoscillator lower, we find 10-meter amateur, police, and governmentfrequencies.It would appear therefore that this frequency, particularlywith the oscillator lower, will be satisfactory in receivers havingenough selectivity preceding the converter to insure good image ratio.In receivers in the low-price classes, where selectivity ahead of theconverter is not high, it would seem desirable to operate with theoscillator lower than the tune frequency toavoid the television channels,and to use an intermediate frequency that would not permitinterference from the amateur bands. This requires an intermediatefrequency of over 11 megacycles. At 11.45 megacycles we find government,fixed, and aviation allocations, and for the image, fixed,government,and broadcast stations, so that this frequency is comparativelyfree from likelihood of spurious responses.It is not likely that frequencies appreciably higher than about 14or 15 megacycles will be useful, because of decreasing stability andgain limitation due to tube and circuit capacitances.Influence of Intermediate Frequency onSelectivity and Stability<strong>The</strong> value of intermediate frequency does not affect the selectivityif the Q of the intermediate-frequency circuits is varied proportionalto the intermediate frequency, thus for the same band width, the Qfor 8.26 megacycles should be 1.9 times as great as the Q for 4.3megacycles intermediate frequency. <strong>The</strong> necessary Q values for 200-kilocycle channels are readily obtainable for any practical intermediatefrequency so selectivity considerations do not influence the choice ofan intermediate-frequency value.Considerations of both frequency stability and regeneration stabilityare involved in the choice of an intermediate frequency. Bothare poorer with a high intermediate frequency than with a low one.an amplifier of N stages the over-all stable gain with regard to regenerationvaries inversely as the N/2 power of the intermediate frequency.It is more difficult to analyze frequency stability quantitativelybecause of the several diverse design factors involved but in generalIn
256 FREQUENCY MODULATION, Volume Ithe frequency drift is proportional to the intermediate frequency. Thisinfluence of intermediate-frequency value on frequency and regenerationstability is the principal difficulty involved in the use of a highintermediate frequency and must be weighted against the advantageof high intermediate frequency in reducing spurious responses. Designexpedients, such as impedance distribution or neutralization may beused to minimize the regeneration stability influence and expedientssuch as cathode degeneration used to minimize frequency-stabilityproblems.ConclusionsIt has been shown that the use of an intermediate-frequency valuehigher than 4 megacycles materially reduces the probability of spuriousresponses, but at the same time may entail some sacrifice in gain andfrequency stability.It would appear therefore, that for receivers designed to operateon weak signals, where spurious responses are unlikely, a relativelylow intermediate frequency of 4.3 megacycles or 5.38 megacycles ispreferable. However for a considerable part of the service area, wheresignal intensities are high and spurious responses likely, high sensitivityis not required and an intermediate frequency of 8.26 megacyclesor even 11.45 megacycles has much to recommend it. Where a receiveris designed to operate over a wide range of signal intensities, it maybe preferable to use a relatively high intermediate-frequency value tominimize spurious responses, using impedance distribution or neutralizationprinciples, and if necessary an additional stage to obtain therequired high gain with stability.
A FREQUENCY-DIVIDING LOCKED-IN OSCILLATORFREQUENCY-MODULATION RECEIVERSByG. L. BeersAssistant Director of Engineering in Charge of Advanced Development,RCA Victor Division, Camden, N. J.Summary— A new type of frequency-modulation receiving system isdescribed in which a continuously operating local oscillator is frequencymodulatedby the received signal. In an embodiment of the system whichis described, the oscillator is locked in with the received signal at one fifththe intermediate frequency. With this 5:1 relationship between the intermediatefrequency and the oscillator frequency, an equivalent reduction inthe frequency variations of the local oscillator is obtained. Received signalfrequencyvariations of ±75 kilocycles are reproduced as ± 15-kilocyclevariations in the oscillator frequency. <strong>The</strong> frequency-modulated signal derivedfrom the oscillator is applied to a discriminator which is designed forthis reduced range of frequencies.<strong>The</strong> oscillator is designed to lock in only with frequency variationswhich occur within the desired-signal channel. <strong>The</strong> oscillator is, therefore,prevented from following the frequency variations of a signal on an adjacentchannel. A substantial improvement in selectivity is thus obtained.<strong>The</strong> voltage required to lock in the oscillator with a weak signal ismapproximately one twentieth of the voltage applied to the discriminator.Since this voltage gain is obtained at a different and lower frequency thanthe intermediate frequency, the stability of the receiver from the standpointof over-all feedback is materially improved.Other performance advantages and the factors affecting the operationof the system are discussed.F^REQUENCY-MODULATION broadcastingis still in its infancyin terms of a nation-wide entertainment service. Until a largenumber of high-powered frequency-modulation broadcast stationsare operating on a commercial basis, the major technical problemswhich are involved in the design of frequency-modulation receiverswill not be fully appreciated.However, the experience which has alreadybeen gained from frequency-modulation broadcasting has indicatedsome of the problems which must be given serious consideration.Probably the most difficult requirement to be met is that of obtainingadequate adjacent-channel selectivity.This problem was emphasizedby a report on "Blanketing of High-Frequency Broadcast Stations"issued in 1941 by the Federal Communications Commission.High sensitivity is necessary in a frequency-modulation receiver to* Decimal classification: R361.111.t Reprinted from Proc. I.R.E., December, 1944.257
'United258 FREQUENCY MODULATION, Volume 1insure maximum performance. This requirement makes it difficult toprovide the desired over-all stability without excessive shielding andother circuit complications. This problem has already been the subjectof a great deal of engineering investigation and one of the solutionswhich has been proposed is the use of the double heterodyne type ofsuperheterodyne receiver. A new approach to a solution of these problemsis provided by a frequency-dividing locked-in oscillator frequencymodulationreceiving system which has been developed. 1 It is thepurpose of this paper to describe the new receiving system and toindicate some of the factors which affect its operation.Description of SystemBasically the operation of the system depends on producing, in thereceiver, a local signal which is frequency-modulated by the receivedsignal. <strong>The</strong> local signal is provided by a continuously operating oscillator.<strong>The</strong> received signal, after it has been amplified by conventionalradio-frequency and intermediate-frequency amplifiers, is applied tothe oscillator in such a way as to cause its frequency to change inaccordance with the frequency variations of the received signal.In theparticular applications of the system to be described .in this paper, theoscillator is locked in with the received signal at one fifth the intermediatefrequency. With this 5:1 relationship between the intermediatefrequency and the oscillator frequency an equivalent reduction in thefrequency variations of the local oscillator is obtained.Eeceived-signalfrequency variations of ± 75 kilocycles are reproduced as ± 15-kilocyclevariations in the oscillator frequency. It should be noted that thelocked-in oscillator operating at one fifth the intermediate frequencyreduces the frequency deviation corresponding to any modulationfrequency but does not change the modulation frequency. <strong>The</strong> frequency-modulatedsignal derived from the oscillator is applied to adiscriminator which is designed for this reduced range of frequencies.<strong>The</strong> output voltage of the oscillator is independent of the strengthof a received signal, in fact, the same voltage is applied to the discriminatorwhen no signal is being received as when the receiver is tunedto a near-by transmitter.This feature makes it unnecessary to employthe conventional arrangements for minimizing amplitude variationsin the received signal.<strong>The</strong> adjacent-channel selectivity of a conventional frequency-modulationreceiver is determined by the selectivity characteristics of theradio-frequency and intermediate-frequency circuits.If these circuitsStates Patent No. 2,356,201, filed February 12, 1942.
LOCKED-IN OSCILLATOR RECEIVER 259CONVERTER0WU.ATORREDUCEDMANXIISCRIUIWAUDIOAlPUftERMFig. 1—Block diagram.do not provide sufficient selectivity, a local transmitter on a channeladjacent to the desired signal may produce, at the discriminator, asubstantially greater voltage than is obtained from the desired station.Under these conditions the desired program will not be heard. In thenew receiving system a novel principle is used to provide additionaladjacent-channel selectivity. <strong>The</strong> oscillator is designed to "lock-in"only with frequency variations which occur within the desired-signalchannel. <strong>The</strong> oscillator is therefore prevented from following thefrequency variations of a signal on an adjacent channel. A substantialimprovement in selectivity is thus obtained by electronic means.<strong>The</strong> "locked-in" oscillator arrangement which is used provides,under weak signal conditions, a voltage step up of approximately 20.In other words, the voltage required to lock in the oscillator with aweak signal is approximately one twentieth of the voltage applied tothe discriminator.Since this voltage gain is obtained at a lower frequencythan the intermediate-frequency, the stability of the receiverfrom the standpoint of over-all feedback is materially improved. Thisimprovement is secured without the disadvantage of the additionalimage responses which are obtained with the double-heterodyne typeof superheterodyne receiver.One receiver arrangement is shown in Figure 1. In this diagramthe units which are heavily outlined are those which are peculiar tothe new system.Description op the Locked-In Oscillator<strong>The</strong> locked-in oscillator circuit diagram is shown in Figure 2.<strong>The</strong>WW—•- TO 0I3C-Fig. 2—<strong>The</strong> locked-in oscillator.
260 FREQUENCY MODULATION, Volume Itube generally used in this circuit has been an A-5581, an experimentalconverter tube, which is similar to the 6SA7 but has a higher mutualconductance. <strong>The</strong> oscillator tuned circuit is connected to the plate ofthe tube and the feedback coil is connected to the No. 3 grid. This gridis operated with self-bias. <strong>The</strong> received signal is applied to the No. 1grid of the tube through a 4300-kilocycle intermediate-frequency transformer.<strong>The</strong> No. 1 grid is likewise operated with self-bias.Description of DiscriminatorOne type of discriminator that can be used with the locked-inoscillator is shown in Figure 3. This circuit has a pair of diodes connectedwith their load resistors in opposition so the discriminator isbalanced at the center frequency. One diode has a tuned circuit inseries with it and the other has a tuned circuit across it. <strong>The</strong> discriminatoris connected across the tank circuit of the locked-in oscillatorFig. 3—Discriminator,through the coupling capacitor shown in the diagram. <strong>The</strong> audiofrequencyoutput from the discriminator is fed through a de-emphasisnetwork to the audio amplifier.Why the Oscillator Locks In with the Received Signal<strong>The</strong>oretical and experimental evidence indicates that the locked-inoscillator circuit operates in accordance with the following theory.As previously stated, the oscillator is designed to lock in at one fifththe intermediate frequency. With an intermediate frequency of 4300kilocycles the oscillator tank circuit is tuned to 860 kilocycles. Whenno signal is being received the tube will function as a normal oscillator.<strong>The</strong> amplitude of the oscillation in a feedback oscillator is determinedby the curvature of the E g— Ip characteristic and is usually so greatthat the grid voltage swings well into the curved parts of the tubecharacteristic during the cycle. This means that a distorted output
LOCKED-IN OSCILLATOR RECEIVER 261current is produced in the plate circuit, having component frequencies2o>, 3
262 FREQUENCY MODULATION, Volume IFig. 5—Effect on circuit.and thus will have an angular velocity relative to OA equal to thedifference of the two angular velocities.Now consider the instantaneous condition shown in Figure 4.<strong>The</strong>injected current AB has a component AC in phase with OA and anothercomponent AD, 90 degrees out of phase with respect to OA. Let thisresultant current OB be applied to a tuned circuit LC as shown inFigure 5. Since the LC circuit is tuned to 860 kilocycles, it will be atresonance with respect to the current OC which isalso 860 kilocyclesand equals i a + i b. <strong>The</strong> quadrature current AD is a leading currentat the instant shown by Figure 4, and the result is the same as thoughan additional condenser C is in the circuit. <strong>The</strong> effect is to decreasethe natural frequency of the tuned circuit.Now consider the condition at a later instant as shown by Figure 6.Since the vector AB is rotating with respect to OA it has now rotatedto the new position as shown. <strong>The</strong> injected current AB now has anin-phase component AC as before, but the component AD is nowlagging instead of leading. If this current OB is now impressed onthe circuit of Figure 5,the lagging component AD will cancel part ofthe leading current through C and this will be equivalent to reducingthe capacitance C since the circuit is now drawing a smaller leadingcurrent. This will raise the resonant frequency of the tuned circuit.It is now evident that the circuit of Figure 2 behaves like a reactancetube and swings the frequency of the tuned circuit back andforth. It is easy to see that if the frequency of the incoming signalis approximately five times that of the tuned circuit, a point will bereached when the frequency of the tuned circuit becomes exactly oneFig. 6—Vector diagram.
LOCKED-IN OSCILLATOR RECEIVER 263fifth of the incoming signal frequency. When this happens the oscillatorwill "lock in" with the incoming signal. This means that theamplitude and phase of the plate current now remain fixed with respectto the incoming signal;with OA.vector AB now makes a constant angle CABIf the incoming signal is exactly five times the frequency of thetuned-plate circuit, the vector AB will be in phase with OA. As theincoming signal frequency is decreased, the vector AB rotates to someposition such as that shown in Figure 4. A further decrease in frequencywill rotate the vector until it is 90 degrees out of phase withrespect to OA. Since this position gives the maximum amount ofquadrature current itcorresponds to the maximum amount the oscillatorfrequency can be pulled over,the lock-in range.and thus gives the lower limit ofIf the incoming-signal frequency becomes greater than fivethe plate-circuit frequency, the conditions willtimesbe similar except thatthe vector AB will be lagging as shown by Figure 6 instead of leading.<strong>The</strong> upper limit of the lock-in range is reached when the injectedcurrent lags by 90 degrees. <strong>The</strong> lagging current tends to reduce theeffective capacitance of the circuit and thus raises the frequency.When the sixth and fourth harmonics are both present simultaneously,it can be shown that the result is a single injected current ofvariable amplitude and phase.This causes the frequency of the tunedcircuit to swing back and forth in accordance with these variations;the process isvery similar to that already explained when the fourthharmonic only is present. Usually, the fourth and sixth harmonicswill be of unequal amplitude and the effect of the weaker one is toproduce relatively small variations in the other.Lock-In Range RequirementsAs previously stated by restricting the lock-inrange of the oscillatorto frequency variations in the desired channel a material improvementin selectivity can be obtained. On the other hand, it is necessarythat the lock-in range be adequate toof the received signal and infollow the frequency variationsaddition provide for receiver mistuningand frequency drift in the transmitter and receiver.<strong>The</strong> effect of the fourth and sixth harmonics in controlling thelock-in range of the oscillator has been previously discussed. <strong>The</strong>amount of fourth and sixth harmonics on the No. 3 grid of the oscillatoris limited, and this limits the lock-in range. When the deviationexceeds the lock-in range the oscillator breaks out and starts backtoward the center frequency since it is no longer controlled. <strong>The</strong>
264 FREQUENCY MODULATION, Volume I-MliK-OUTFig. 7—Breakout characteristic.oscillator may then suddenly jump to a series of different frequencyratios such as, 36/7, 41/8, 46/9 • • • • •5/1, • • , 44/9, 39/8, 34/7, • • •• •for short intervals. <strong>The</strong> lock-in range for each of those ratios is verysmall, and the oscillator breaks out between them. <strong>The</strong> result can bea distorted output as shown by Figures 7 or 8. It is, therefore, necessaryto provide adequate lock-in range in order to prevent this distortion.Factors Which Determine <strong>The</strong> Lock-in Kange<strong>The</strong> iock-in range of the oscillator depends upon several factorswhich will now be discussed.Effect of DiscriminatorWhen a discriminator is connected to the oscillator, it changes theimpedance relations of the tank circuit and increases the lock-in range.Fig. 8—Breakout characteristic.
LOCKED-IN OSCILLATOR RECEIVER 265Fig. 9—Input capacitance of discriminator.<strong>The</strong> equivalent input capacitance of the discriminator circuit shownin Figure 3 decreases rapidly with frequency near the center frequencyof the oscillator. Figure 9 shows how this capacitance falls off nearthe center frequency f. If the oscillator tank circuit is to be kept intune over the operating frequency range, the tank circuit capacitanceshould decrease with increasing frequency as shown by Figure 10. <strong>The</strong>slope of this curve is determined by the L/C ratio of the tank circuit.<strong>The</strong> discriminator input capacitance characteristic can be designedto provide an apparent capacitance change with frequency nearly tomatch the requirements for tuning the oscillator.In Figure 11 the solid line represents the falling input capacitanceof the discriminator and the dashed line is the variation of capacitancerequired to keep the oscillator in tune as the frequency is varied. Ifthe two curves have approximately the same slope at the center frequency/ , the lock-in range will be greatly increased since only a smallamount of reactive current will shift the oscillator frequency a considerableamount.Effect of Signal VoltageIf the No. 1 grid is operated with self-bias so that the operating* z^=-Fig. 10—Oscillator-tuning capacitance.
266 FREQUENCY MODULATION, Volume IFig. 11—Matching the discriminator to the oscillator.bias is approximately equal to the peak amplitude of the applied signalvoltage, the lock-in range will be as shown by Figure 12.For small applied voltages the lock-in range increases rapidly fromzero with increasing signal voltage until it reaches a maximum, andit then decreases slowly with further increase in voltage as shown bythe dashed line.In practice, the screen and plate resistors can be chosen to correctthis falling off of the lock-in range with increased input. This compensationwill give the constant lock-in range beyond the knee of thecurve as shown by the solid line.Effect of Tube Constants<strong>The</strong> lock-in range depends upon the amount of quadrature currentthat can be developed by the tube.This means that the tube shouldhave a fairly high zero-bias plate current and a fairly high mutualconductance from the No. 1 grid to plate. This assures large pulsesof plate current which produce the required reactive current. <strong>The</strong>APPLIED VOLTAGEFig. 12—Effect of signal voltage on lock-in range.
LOCKED-IN OSCILLATOR RECEIVER 267experimental A-5581 tube has been found to meet these requirements.This tube issimilar to the 6SA7 but provides increased peak currentand increased mutual conductance.Effect of Intermediate-Frequency Selectivity on Lock-In Range<strong>The</strong> primary effect of intermediate-frequency selectivity is toattenuate the voltage on the No. 1 grid as the signal frequency movesdown the side of the selectivity curve. Naturally the oscillator cannotlock in if the incoming signal voltage becomes too small. This meansthat the bandwidth of the intermediate-frequency amplifier willaffectthe lock-in range. Figure 12 shows the variation of lock-in range withinput voltage. <strong>The</strong> range falls off very rapidly when the applied voltagefalls below the knee of the curve. <strong>The</strong> amplifier should be designed soit is broad enough to assure sufficient voltage to lock in the oscillatorat the maximum frequency swings encountered and also to provide fordrift and mistuning.Effect of Oscillator Frequency<strong>The</strong> lock-in range isin general inversely proportional to the oscil-|j-*- TC DISS.Pig. 13—Tuned-feedback coil.lator tank circuit C. An increase in the intermediate frequency willresult in an increase in the lock-in range only when C is correspondinglyreduced.Effect of Feedback Winding<strong>The</strong> lock-in range will increase somewhat with increased mutualinductance from the tank coil to the feedback winding. Fairly tightcoupling should be used for increased range.A method which can be used to increase the lock-in range is to tunethe feedback winding to the second harmonic of the oscillator as shownby Figure 13. Capacitor C is chosen to tune the grid circuit to 1720kilocycles.This builds up the second harmonic, which in turn causesan increase in the fourth and sixth harmonics because of the nonlinearityof the tube. <strong>The</strong> result is an increase in the lock-in range.
268 FREQUENCY MODULATION, Volume INoise-Reduction CharacteristicsIt has been previously stated that the lock-in oscillator arrangementcan be designed to increase materially the adjacent-channel selectivityof a receiver. This improvement is obtained by restricting the lock-inrange of the oscillator so that it will follow only the frequency variationswhich occur within the desired channel.This restricted lock-inrange is of interest also from the standpoint of the noise-reducingpropertiesof the receiver.In conventional frequency-modulation receivers the discriminatoris designed so that the linear portion of its response characteristic isadequate to accommodate the frequency variations of received signals,with due allowance for mistuning both by the user and that resultingfrom frequency drift of the heterodyne oscillator. <strong>The</strong> curved portionsof the discriminator characteristic which extend beyond the linearregion just referred to provide an additional frequency range in whichnoise components with wide frequency variations are converted intoPig. 14—Discriminator characteristic.amplitude variations:Figure 14 shows a typical discriminator characteristicin which AB isthe linear region within which the frequencyvariations of received signals are converted into amplitude variations.<strong>The</strong> sections of the characteristic designated CA and BD are the portionswhich are not useful in the reception of desired signals becauseof the curvature, but which are effective in converting frequencymodulationnoise components into amplitude variations. <strong>The</strong> upperfigures, indicating deviation, correspond to the discriminator characteristicin a conventional receiver, while the lower figures are the frequencyvalues for the locked-in oscillator discriminator. <strong>The</strong> restrictedfrequency range of the oscillator in the locked-in oscillator type ofreceiver can be used to limit the portion of the discriminator characteristic,which is utilized in converting the frequency variations of both
LOCKED-IN OSCILLATOR RECEIVER 269the received signal and noise components into amplitude variations, tothe linear region AB.Another characteristic of the locked-in oscillator which may be usedto advantage in minimizing the effects of noise is the ability to preventthe oscillator from following the frequency variations corresponding tosuperaudible noise components. This is accomplished in the oscillatorarrangement shown inFigure 2 by the proper choice of circuit constants.Modipied-Circuit ArrangementA modification of the frequency-dividing frequency-modulation receiverhas been developed by which its ability to select between desiredsignals or noise is further extended. Figure 15 is a block diagram ofthis modification.<strong>The</strong> locked-in oscillator used in this arrangement is likewise designedto operate at one fifth of the intermediate frequency. <strong>The</strong>normal lock-in range of the oscillator, however, is restricted to only20 to 35 per cent of the frequency-variation range required for receivedsignals. This very restricted lock-in range is extended by means of aWCONVERTEROSCILLATORFig. 15—Modified-circuit arrangement.reactance-tube arrangement so that the oscillator will follow themaximum frequency variations of received signals. <strong>The</strong> audio-frequencypotential developed at the discriminator-rectifier combinationis applied through a phase-correcting network to the reactance tubein the proper phase and magnitude to cause the reactance tube toshift the oscillator resonant frequency so that, at any instant its frequencyis such that the limited lock-in range will permit it to lock inwith the received signal. <strong>The</strong> amplitude of the control potential appliedto the reactance tube is normally kept slightly below the value whichwould shift the oscillator to the correct frequency, assuming that theoscillator had no lock-in range. In other words, for 100 per cent modulationthe reactance tube shifts the oscillator frequency by slightlyless than ±15 kilocycles.Let us consider the merits of this arrangement in connection withnoise impulses and adjacent-channel selectivity. Superaudible fre-
270 FREQUENCY MODULATION, Volume Iquency-modulation noise components applied to the input circuit of thelocked-in oscillator may appear in the oscillator output circuit. <strong>The</strong>phase-correcting network, however, may be designed so that thesecomponents either are not fed back to the reactance tube at allnot fed back inor aresuch phase and amplitude as to permit the oscillatorto follow them. In other words, the receiving system is provided witha circuit which is responsive only to small frequency variations andthis restricted-response range is moved back and forth at a rate whichfollows the desired modulation of received signals but is not movedback and forth at a rate which will follow superaudible noise impulseswhich may be present with the received signals.<strong>The</strong> effect of the reactance-tube arrangement on adjacent-channelselectivity is also of interest.This can best be Understood by referenceto the discriminator-rectifier—voltage-frequency response characteristicshown in Figure 14. As the output potential of the discriminatorrectifierand hence the potential applied to the reactance tube variesover the useful portion of the discriminator characteristic (the linearportion of the characteristic between the points A and B) the effectof the reactance tube is to shift the oscillator frequency in the samedirection as the frequency changes which give rise to the demodulatorpotentials.If, on the other hand, we assume that a signal on the adjacentchannel could reach the discriminator circuits and produce potentialscaused by frequency variations over the side of the discriminatorcharacteristic as indicated by the portion A-C of the curve, the phaseof the potentials applied to the reactance tube would be such that theeffect of the reactance tube on the oscillator would be to reverse thedirection of the oscillator-frequency change. That is, the reactancetube cannot shift the oscillator frequency so that it will lock in withthe signal on an adjacent channel because the circuit elements are sodesigned that if the frequency of the oscillator were to change beyondthe useful range of the discriminator and toward the adjacent channel,the phase and magnitude of the potential applied to the reactance tubewould shift in such a manner that the oscillator frequency would beshifted away from the adjacent channel frequencies.Experimental ResultsAs a part of an experimental investigation of the new receivingsystem, work was carried on with two identical commercial receivers.One was modified by incorporating the locked-in oscillator and reducedrangediscriminator, shown in Figure 16, in place of the two-tubecascade limiter and the discriminator used in the original construction.<strong>The</strong> other receiver was used for comparative tests in the laboratory and
L0CKED-1N OSCILLATOR RECEIVER 271field. This procedure was repeated with two identical laboratoryreceivers constructed along conventional lines.It should be noted that the locked-in oscillator circuit shown inFigure 16 isrepresentative of the receiving system illustrated by theblock diagram in Figure 1.This arrangement was used in preferenceto the modification illustrated by the block diagram in Figure 15because it was less complicated and, therefore, considered more suitablefor commercial receivers.With the arrangement shown in Figure 16 an intermediate-frequencysignal of about 1volt on the No. 1 grid of the oscillator tubewas required to provide the desired lock-in range of approximately± 110 kilocycles. <strong>The</strong> frequency range in excess of the ± 75 kilocyclesrequired for the normal modulation of a received signal isprovided totake care of mistuning by the user, frequency drift of the heterodyneoscillator, and over-modulation at the transmitter. <strong>The</strong> oscillator voltagedeveloped at the discriminator was between 20 and 30 volts. FromI.F AMPLIFIER4,300 KCLOCKED-INOSCILLATOR 860 KCDISCRIMINATOR860 KCOUT.AVCPig. 16—Locked-in oscillator and discriminator.the foregoing, it is apparent that the receiver should be sufficientlysensitive to produce 1 volt on the No. 1 grid of the oscillator to providesatisfactory reception of a desired signal.Improvement in Selectivity<strong>The</strong> results of selectivity measurements, made by the two-signalmethod, are shown in Figure 17. In these tests, the receivers weretuned to a desired signal of 100 microvolts, with 400-cycle modulationand a deviation of ± 25 kilocycles. An interfering signal, modulatedwith 1000 cycles, and a deviation of ± 25 kilocycles, was adjusted insignal strength and frequency to give an interference output 30 decibelsbelow the 400-cycle output. A considerable improvement in selectivity,
I272 FREQUENCY MODULATION, Volume Iespecially for the entire adjacent channel, is shown with the receiveremploying the frequency-dividing locked-in oscillator system. It shouldbe noted that with an increase in interfering signal, a point of oscillatorbreakout may always be reached. <strong>The</strong> level of interfering signal atwhich breakout occurs is higher than the — 30-decibel interferencelevel. <strong>The</strong> improvement in adjacent-channel selectivity, shown by thesecurves, is equivalent to the addition of two intermediate-frequencystages in the receiver.TWO SIGNAL SELECTIVITYDESIRED SIGNAL IOO/"V.INTERFERING SIGNAL ADJUSTED FOR -30 DB INTERFERENCE:"A"«LOCKED-IN OSCILLATOR'•UNMODIFIED RECEIVER.10,000ipoo100300 200MODULATIONJ LMTTSOTADJACENT"I CHANNEL jIH\TsVKl 10100 100 200 300KC SEPARATIONPig. 17—Selectivity curves.Impulse Noise InterferenceOscilloscopic investigations of the effects of impulse interferencewith both modulated and unmodulated signals were made with the fourreceivers. <strong>The</strong> results indicated a general superiority in noise reductionfor the frequency-dividing locked-in oscillator system.Field TestsField tests showed the receivers using the new receiving system
LOCKED -IN OSCILLATOR RECEIVER 273to be considerably more selective with respect to adjacent-channel interferencethan conventional commercial receivers. More distortion was,however, encountered when the locked-in oscillator receivers were tunedso that the signal was received at the edges of the receiver-responsecharacteristic than was obtained with the conventional units.This isdue to the oscillator breakout characteristic and the fact that the voltageat the discriminator remains fixed irrespective of the signal appliedto the oscillator. In general, it can be stated that an increase in distortion,when tuned to one side of a desired signal, goes hand in handwith increased adjacent-channel selectivity in any type of radioreceiver. Some observers felt that this effect assisted in properlytuning the receiver.Observations with respect to noise reduction substantiated thelaboratory measurements which previously have been discussed.Modified-Circuit ArrangementAn experimental receiver was also constructed incorporating themodified arrangement illustrated by Figure 15. Although the tests onthis receiver were not so extensive as those on the receivers in whichthe Figure 16 arrangement was used, they did indicate that the modifiedcircuit possessed superior noise reducing and adjacent-channelselectivity characteristics.ConclusionsA novel method of receiving frequency-modulated signals has beeninvestigated both theoretically and experimentally. <strong>The</strong> investigationindicates that the system has the following advantages:1. By restricting the lock-in range of the oscillator to follow onlythe frequency variations which occur within the desired-signalchannel, a material improvement in selectivity is obtained.2. An equivalent voltage step-up is secured at a different and lowerfrequency than the intermediate-frequency and a correspondingimprovement in freedom from over-all feedback is secured.3. A constant voltage is applied to the discriminator irrespectiveof the strength of a received signal, and arrangements forminimizing amplitude variations in a received signal are, therefore,not required.4. <strong>The</strong> frequency-dividing locked-in oscillator receiving systemprovides a means for incorporating, in a frequency-modulationreceiver, a type of selectivity which can be used to discriminatebetween the desired-signal modulation and frequency-modulation-noisecomponents.
274 FREQUENCY MODULATION, Volume I<strong>The</strong> following characteristics should also be considered in anevaluation of the system:1. Adequate receiver gain ahead of the locked-in oscillator mustbe provided if distortion of the weaker signals (due to theoscillator falling out of step) , is to be prevented.2. When the receiver is tuned through a signal, more noticeabledistortion occurs at the edges of the receiver response characteristicthan is obtained with a corresponding conventionalreceiver.Acknowledgment<strong>The</strong> writer wishes to acknowledge the valuable assistance of Messrs.M. S. Corrington, G. L. Grundmann, W. R. Koch, and W. F. Sandsduring the development of the frequency-dividing locked-in oscillatorfrequency-modulation receiver.
FREQUENCY-MODULATION DISTORTION CAUSEDBY MULTIPATH TRANSMISSIONSBymurlan s. corringtonHome Instrument Department, RCA Victor Division,Camden, N. J.Summary— When a frequency-modulated wave is received by more thanone path, so that two or more of the voltages which are induced in theantenna have nearly the same amplitude, considerable distortion can result.Large objects, such as hills or high buildings, can reflect and absorb thewaves and thus cause interference. Two interfering waves will be in phasepart of the time and out of phase part of the time during modulation. Thiscauses amplitude modulation on the resultant carrier, and a sharp irregularityin the instantaneous frequency, corresponding to each hole in thecarrier caused by the interference.<strong>The</strong> distortion can often be greatly reduced by detuning the receiveror discriminator until the hole in the carrier coincides with the zero-balancepoint of the discriminator. Directional antennas are helpful when thesignals from the desired station are not coming from the same direction.Formulas are derived for the modulated envelope and for the distortion.A Fourier-series analysis of the distorted audio output makes it possibleto calculate the effects of de-emphasis networks and other audio selectivity.DURINGIntroductiona demonstration of a frequency-modulation receiver in<strong>New</strong> York in the spring of 1942, difficulty was experienced inlocating an antenna in the RCA Building which would producea signal of quality comparable with that known to be transmitted bystation W2XWG. <strong>The</strong> antenna was located in a room in this steel buildingon the side away from the transmitter.<strong>The</strong> distortion was presenteven on relatively small deviations.<strong>The</strong> tests were repeated in an apartment house on 93rd Street, andsimilar distortion was encountered. Further tests were made laterwith a second frequency-modulation receiver to determine whether thedistortion was caused by a defective receiver or was introduced duringthe transmission of the signal.of distorted output.Both receivers produced the same typeSince intermediate-frequency amplifier selectivitywould not cause this effect, it was suggested that it might be caused bymultipath reception. During July and August of 1942, further observationson a qualitative basis were made on the eighty-fifth floor of theEmpire State Building. Path differences due to reflections were encoun-* Decimal classification: R113.110XR148.2.t Reprinted from Proc. I.B.E. December, 1945.275
;276 FREQUENCY MODULATION, Volume 1tered which were of sufficient magnitude to cause partial or completecancellation of the waves at one or more frequencies in a 150-kilocyclewidechannel as used by frequency-modulation broadcast stations.large number of field tests have been made since that time, and theyshow that this trouble can occur in nearly any location in Manhattanas well as in many of the surrounding towns in northern <strong>New</strong> <strong>Jersey</strong>.In midtown Manhattan there are many steel buildings which causemultipath transmission. If the receiver is inside such a structure, anoutside antenna is desirable. If such an antenna is not practicable, itprobably will be necessary to use more than one inside receivingantenna in order to obtain full performance on the high-fidelity programsfrom all the <strong>New</strong> York frequency-modulation stations. This willbe true even if the receiver has the best performance characteristicsnow commercially available. For a single stationary antenna, distortionwill probably be noticed in many locations on at least one of the stations.Cases have been observed where the movement of a person aroundin the room near the receiving antenna has changed the relative fieldstrengths enough so that, when the person was in some parts of theroom, the reception was satisfactory, and when he was in other partsit was unsatisfactory. A parasitic element such as a metal rod ordipole can sometimes be moved around in a room to produce the sameeffect. Maximum distortion occurs at the time of cancellation of thetwo waves.This causes a great reduction in the voltage in the intermediate-frequencychannel and it may fall below the threshold of limitingin the receiver.If the cancellation occurs near one edge of the band, the signal maysound fairly good during the soft passages but it becomes distorted onthe loud passages.It will then sound like an overloaded audio-amplifierstage. If the cancellation occurs near the middle of the channel, theentire output may be so distorted that it becomes almost unintelligibleit then sounds somewhat like severe selective fading in amplitudemodulation. Since high-order harmonics are produced, the distortionmay appear as buzzes, rattles, or swishes, and if it occurs during theplaying of a phonograph record, one may think the pickup is not trackingproperly. <strong>The</strong> high frequencies often tend to become irritatingdue to intermodulation.Two amateurs 1 have reported distortion of the programs fromWMIT when the receiver is in the mountainous region near Asheville,N. C. At times they found that the audio signal was badly distorted tothe point of becoming unintelligible, even for strong signals,Aand that1A. D. Mayo and Charles W. Sumner, "P. M. distortion in mountainousterrain," QST, vol. 28, pp. 34-36; March, 1944.
MULTIPATH DISTORTION 277the distortion is a constant phenomenon over periods of weeks in thosespots where it occurs. DuMont and Goldsmith 2 found that multipathconditions are common in which two signals of approximately equalstrength arrive at a receiving antenna, and therefore this type of distortionwith frequency-modulation sound transmission can be expectedto occur frequently.A similar type of distortion had previously been encountered inlong-distance transmission. In 1930, Eckersley 3 was working withamplitude-modulation transmitters which had incidental frequencymodulation. Because of this frequency shift he found "most appallingdistortion" resulting from delayed echoes caused by deflections fromthe Heaviside layer. He found that it was necessary to use specialprecautions to keep any frequency shift from getting into the amplitude-modulationtransmitters. <strong>The</strong> distortion when frequency modulationand amplitude modulation were both present was worse than thatfor amplitude modulation only.A study of frequency-modulation propagation over long distanceswas made by Crosby. A 4 transmitter was set up in Bolinas, California,and the transmissions were observed on receivers at the Eiverhead,<strong>New</strong> York, station. He found that there was considerable distortion,and that in some cases a signal which gave fair intelligibility on amplitudemodulation was practically unintelligible on frequency modulation.He stated, "<strong>The</strong> general conclusion derived from the tests andtheory is that, on circuits where multipath transmission is encountered,frequency modulation is impracticable." In a later paper, 5 he againreported similar distortion. Other studies 67 have shown that reflectionsfrom the ground and nearby buildings cause multipath transmission,for both horizontal and vertical polarization, which can introducedistortion.Reflections from airplanes flying overhead sometimes causeinterference for short intervals.<strong>The</strong> same difficulty is encountered in television reception. <strong>The</strong>higher frequencies used tend to increase the difficulty,changes encountered are greater.since the phaseThis causes light and dark bands in2Allen B. DuMont and Thomas T. Goldsmith, Jr., "Television broadcastcoverage," Proc. I.R.E., vol 32, pp. 192-205; April, 1944.3 T. L. Eckersley, "Frequency modulation and distortion," Exp. Wirelessand the Wireless Eng., vol. 7, pp. 482-484; September, 1930.4Murray G. Crosby, "Frequency-modulation propagation characteristics,"Proc. I.R.E., vol. 24, pp. 898-913 ; June, 1936.5Murray G. Crosby, "Observations of frequency-modulation propagationon 26 megacycles," Proc. I.R.E., vol. 29, pp. 398-403 ; July, 1941.6P. S. Carter and G. S. Wickizer, "Ultra-high-frequency transmissionbetween the RCA building and the Empire State Building in <strong>New</strong> YorkCity," Proc. I.R.E., vol. 24, pp. 1082-1094; August, 1936.7R. W. George, "A study of ultra-high-frequency wide-band propagationcharacteristics," Proc. I.R.E., vol. 27, pp. 28-35; January, 1939.
1278 FREQUENCY MODULATION, Volume Ithe picture and results in synchronization difficulties when frequencymodulation is used on video or synchronizing signals.Since field tests have demonstrated the possibility of encounteringdistortion due to multipath propagation even though the distance fromthe transmitter to the receiver is relatively short, a theoretical andexperimental study was made to determine the factors contributing tothis type of distortion. It is the purpose of this paper to present theresults of this investigation.<strong>The</strong>oretical ConsiderationsSuppose that one frequency-modulated wave is delayed with respectto the second by a time interval t because of two-path transmission.<strong>The</strong> equations for the instantaneous voltages of the two waves arere 1= Ex sin -i at -\— sin 2-irjj.tyDl(1)e 2= E 2 sin < trD}L m 1 + X COS {z COS (2-TTixt — 7r/ui ) +
IMULTIPATH DISTORTION 279andx =-(5)<strong>The</strong> first part of this expression (that under the radical sign) givesthe variations in amplitude of the resultant carrier, and the argumentof the sine function shows the variations in phase of the signal.<strong>The</strong>reis considerable amplitude modulation introduced, and the frequencymodulatedsignal is also distorted. <strong>The</strong> resulting carrier envelope willbe considered now, and the distortion in the audio output will be discussedlater.Effect of Interference on the Envelope of the <strong>Radio</strong>-Frequency Wave<strong>The</strong> resultant amplitude of the radio-frequency carrier isgiven by40° 60° 80° ICO' 120° 140" 160° IBO° 200°ZTTflt—*-Fig. 1—Carrier envelope.e l + e 2 I= E l VI + X 2 + 2x COS {Z COS (27Tjui — 7T/ji ) + a>t ). (6)<strong>The</strong> amplitude is a function of the ratio of the two signal voltages x,the maximum deviation D, the time delay t , and the audio frequency 11.<strong>The</strong> only effect of the carrier frequency w is to determine the initialphase angle a>t .Figure 1 shows the carrier envelope for a deviation of 60,000 cyclesper second from a mean carrier frequency of 45 megacycles per second.E x was assumed to be one volt and E 2 was taken as 0.9 volt, so thevoltages are nearly equal.<strong>The</strong> conditions were chosen so that the tworadio-frequency signal voltages were in phase at the undeviated positioncorresponding to 2-nji.t = 90 degrees. <strong>The</strong> equation of the envelopebecomes| «x + e 2 |= V1.81 + 1.80 cos {4tt cos (2ir/it - 0.18°) }. (7)
=280 FREQUENCY MODULATION, Volume I<strong>The</strong> path difference corresponding to t is 6.2 miles. Zero degrees correspondto full deviation on one side.Since the audio signal is a cosine function, it varies slowly at first,then more rapidly as it goes through 90 degrees, and then slows downas it approaches 180 degrees. Figure 1 shows how the spacing of thepeaks and dips of the carrier envelope corresponds to this variation.Zero degrees corresponds to the slowest rate of change, and the peakis very wide; at 90 degrees, the variation is most rapid, and the peakis narrow. <strong>The</strong> amplitude can be represented by the resultant of tworotating vectors R as shown by Figure 2 If E 2 were to rotate at auniform rate, the resultant R (which corresponds to the instantaneousvalue of the envelope) , would go through identical cycles, and the peaksof Figure 1 would be evenly spaced. When the carrier wave is modulatedsinusoidally, however, the vector E 2 does not rotate uniformly,but rocks back and forth, with a sinusoidal variation of the angle 8.Fig. 2—Resultant of two signals.Under the conditions represented by Figure 1, the vector E 2 startswith 6 — 0.18 degrees and makes two revolutions (4tt radians) whilethe carrier frequency varies from maximum deviation to the meanundeviated frequency. Each time it goes past point B it gives a holein the carrier envelope, and when it goes through A it gives a peak.Figure 3 shows what happens when the frequency is increased from30 cycles per second to 5000 cycles per second. <strong>The</strong> equation of thisenvelope isei + e 2\V1.81 + 1.80 cos {12 cos (2ir/*i - 30°) }. (8)Since ir/ui = it/6 radians = 30 degrees, the curve is shifted over approximately30 degrees from that in Figure 1, corresponding to onehalf the fraction of the audio cycle by which one wave is laggingbehind the other.
MULTIPATH DISTORTION 281[B0° 4060° SO" 100° /SO' 140° 160° BO' 200°Sni.it——Fig. 3—Carrier envelope.Another interesting difference is that the two voltages come almost,but not quite, into phase at 30 degrees. This peak is therefore slightlylower than the others. <strong>The</strong> difference is caused by the fact that the sineof an angle is not linear, but departs from a straight line for largerangles.<strong>The</strong> maximum angle through which the one vector of Figure2 rotates with respect to the other is given byDz = 2 — sin -rrp,t radians (9)and this sine function introduces the nonlinearity. Further changesof the frequency merely move the curve along the axis, but effectslight changes in shape.Variation of the Envelope with DeviationFigure 4 shows the effect of changes of the maximum deviation D.<strong>The</strong> constants were chosen such that the two voltages are always inphase when 1-rr^t — degrees. For a small deviation, say D = 15,000cycles per second, the two voltages start to go out of phase as 2irfitincreases, but do not go completely out of phase.between the vectors in this case is<strong>The</strong> maximum angleD-lSkcEO° 40° 60° ' 80° 100° 120° 140° 160° ISO' £rWFig. 4—Variation of carrier envelope with D.
282 FREQUENCY MODULATION, Volume 1Fig. 5—Variation of resultant.Dz = 2 — sin Tr/ito/*15,000 ir (15,000)= 2 sin15,000 30,000= 2 radians.<strong>The</strong> vector # 2 rotates clockwise 2 radians, then reverses and goes 2radians counterclockwise, as shown in Figure 5.envelope shown in Figure 4.This process gives theIf the maximum deviation D is increased to 23,600 cycles per second,the two voltages go just out of phase in the mean position.A furtherincrease in D causes them to start to come into phase again, as shownby the curve for D = 30,000 cycles per second. Further increases in Dincrease the number of peaks and holes in the envelope.Variation of the Envelope with Path DifferenceA change in the path difference for the two waves will also changethe number of peaks and holes. Figure 6 shows the envelopes for dif-
MULTIPATH DISTORTION 283ferent path differences from 1.0 mile to 6.2 miles. <strong>The</strong> curves are verysimilar to those of Figure 4. <strong>The</strong> shapes can be changed further byadjusting the initial phase of the two waves.Variation of the Amplitude with DeviationWhen the wave is modulated sinusoidally, the variation of the frequencydeviation is not linear, and this causes the unequal spacing ofthe peaks and dips as shown in Figure 1.If the same set of conditionsis used, and the variation of amplitude is plotted against the deviation,the spacing of the peaks and dips will be uniform as shown by Figure7. A further increase in deviation will cause more peaks, but will notalter the spacing if the time delay is unchanged.<strong>The</strong> equation of the amplitude is
+[\284 FREQUENCY MODULATION, Volume Ideviations D. It took approximately 30,000 cycles per second deviationto cause the carrier to go from in-phase to out-of-phase.<strong>The</strong> oscillograms of Figure 9 show how the number of peaks andholes varies with the deviation D. <strong>The</strong>y are seen to be very similar tothose of Figures 1, 3, 4, and 6. In each one, the two voltages werenearly equal.Figure 10 shows an oscillogram in which one signal is about 3.5times as strong as the second. <strong>The</strong> general shape is the same as thoseof Figure 9, but the holes do not go nearly so deep. <strong>The</strong> velocity ofpropagation in the cable was 66 per cent of that in free space; therefore,the effective path difference was 15,900 feet. This corresponds toa time delay of 16.2 microseconds.Determination of Time DelayLet the path difference be d and the time delay corresponding toFM SignalGenera tor75^1Short Coaxial Cable*f -tt-75sl-F rr^E] B-LONS CoAXJALCable t" /—Fig. 8—Circuit for studying interference.Oscilloscopethis difference be t . <strong>The</strong> unmodulated carrier frequency is a. Let A xbe the wavelength corresponding to
MULT1PATH DISTORTION285andd =st3X10 8Dmeters.(13)D- 30,000 '~ 0= 35,000 ~0= 60,000- D= 75,000'^^^^P^^D=I00,000~ 0=150,000-wmrnm^D= 175,000' 0=200,000-Fig. 9— -Oscillograms of carrier envelopes.
286 FREQUENCY MODULATION, Volume IFig. 10—Oscillogram of carrier envelope.<strong>The</strong> time delay*o ="d3 X 10 8 D= — seconds. (14)If D is the frequency shift required to go from out-of-phase, to inphase,and out-of-phase again, the time delay will be 1/D.Field TestsTo study the distortion encountered in <strong>New</strong> York City, the NBCtransmitter at the Empire State Building was operated with 300-cyclepure-tone modulation and a deviation of ± 75 kilocycles. A mediumpricedreceiver and an antenna were set up in a room next to the transmitter.<strong>The</strong> antenna could easily be located to give two-path reception,with a time delay of about seven microseconds. Figures 11 and 12show the carrier envelope and the discriminator output. In Figure 11the two waves canceled each other near one end of the swing. <strong>The</strong>resultant amplitude modulation which passed the limiter, and thecoincidental phase modulation gave the result shown in Figure 12.One half of the cycle is relatively free from distortion, since the twosignals did not go out of phase at any part of that swing. <strong>The</strong> twoirregularities in the audio output correspond to the point of cancellation.This distortion could be eliminated by correct antenna location.In the RCA Building on the side away from the transmitter,theTime£ FrequencyFig. 11—Carrier envelope.Fig. 12—Discriminator output.
MULTIPATH DISTORTION 287antenna was fairly well shielded from the direct wave from the transmitter,and it received signals which may have been reflected fromother buildings.Figure 13 shows several curves of the audio outputand the corresponding variation in the carrier voltage during the cycle.<strong>The</strong>y are all for a 300-cycle audio tone and ± 75-kilocycle deviation, forvarious antenna positions. <strong>The</strong> audio output should be a pure sinewave, and the intermediate-frequency voltage should show the intermediate-frequencyselectivity curve, as shown by the dotted lines.Although there were several irregularities along the straighter portions,the most serious distortion occurs at the ends of the swing. <strong>The</strong>firstintermediate-frequency voltage curve shows that there were severalpaths of nearly equal voltage. In the second case, the secondarypaths were still present, but the relative voltage was much less, asshown by the decreased departure from the selectivity curve. Since the^wIFVoltageFig. 13—Distortion for various antenna positions.signal strength was fairly low, some of the distortion was probablydue to the inability of the limlter to remove allthe deep holes in thecarrier.Many other field tests in <strong>New</strong> York City and northern <strong>New</strong> <strong>Jersey</strong>have shown this distortion. <strong>The</strong> time delay is usually about 7 to 12microseconds. This means that, for two-path transmission, there willbe one or two holes in the carrier. Since the limiter tends to fail atthese holes, the distortion can often be reduced by detuning thereceiver until the hole in the carrier coincides with the discriminatorzero-balance frequency. Since the discriminator output is zero at thispoint, variations in input voltage cause a minimum of distortion. Itsometimes happens, when the direct and indirect waves are nearlyequal, that severe distortion isencountered in the audio output of theset even though the input signal, as indicated by the voltage developedat the limiter grid, would normally be sufficient to secure limiting.
:288 FREQUENCY MODULATION, Volume IEffect of Interference on the Audio Output from the DiscriminatorAs shown in Appendix I, Equation (23), the audio output from thediscriminator is proportional to2D sin 7i-yui sin (2-rr/j.t — 7r,ui )Dcos2TTjjt + (15)1/X + COS {z COS (2ir)xt — TTjit^) + at ]X + COS {z COS (2-np.t — TTfit ) + od }<strong>The</strong> first term represents the undistorted output, and the second termshows the distortion introduced by the interference. This result wasobtained by assuming that a limiter removes the coincidental amplitudemodulation from the wave, and that the discriminator output isproportionalto the instantaneous frequency.General Case — Two Voltages Nearly Equal<strong>The</strong> distortion term can be expanded in a Fourier series,as shownin Appendix II. <strong>The</strong> audio output from the discriminator is proportionaltoOutput = D COS 2ir[).t00- 2/x 2 (- D*C (2m + l,z; x, ,d ) (2n + 1) sin (2n + 1) ywhere00— 2,u 2 (— l) n S (2n, z; x, mt )n = l(2n) sin 2ny (16)y — 2-!Tjj.t — 7r/tt and the C and S functions are defined as followsoc(— X)*C (m,n; x, 0) = 5 Jm {sn) cossff. (17)« (-*)«S (m,n; x,8) = 2 /,„ (sn) sin s8. (18)8= 1s<strong>The</strong> amplitude of each harmonic can be calculated from these equationsby assuming the proper value of n. <strong>The</strong> C and S functions can be commutedfrom tables of Bessel functions. Figures 14, 15, 16, and 17 showsome graphs of these functions.Figure 18 shows the distortion caused at an audio frequency of 500cycles per second under the conditions listed. <strong>The</strong> phase of the two
MULTIPATH DISTORTION 289Fig. 14—Graph of C(l, n; x, 0).o
290 FREQUENCY MODULATION, Volume 1C?
MULTIPATH DISTORTION 2911.5
292 FREQUENCY MODULATION, Volume IFig. 20—Variation of a.This theory assumes an infinite bandwidth and linear phase-shiftin the receiver. <strong>The</strong> very deep and narrow dips and peaks show thepresence of harmonics of high order which are in phase at each peak.Since the receiver has a limited bandwidth, many of these harmonicswill be filtered out in the audio system, so the audio output will not beD-oo,coo~ A-o.yu = 5000~ £",-/' sec. LuU~Zn(l8(fl+Scr0°
MULTIPATH DISTORTION 293If the maximum deviation is reduced, such that the two vectors donot go out of phase so often, the distortion will be much less,becausethe number of peaks will be reduced and the one vector will not rotateso fast relative to the second. Figure 22 shows the output at 1000cycles per second with a maximum deviation of 15,000 cycles persecond. <strong>The</strong> time delay is 1/30,000 second as before. <strong>The</strong> phase of thetwo radio-frequency carriers was chosen such that they were in phaseat the undeviated frequency. This assumption also reduces the distortion.Upon reducing the deviation further, or decreasing the time delayof the retarded signal, the irregularities will disappear.Experimental Study of Distorted Output<strong>The</strong> distortion in the audio output from the receiver was studiedby using the circuit of Figure 8 with a frequency-modulation receiverconnected just ahead of the oscilloscope. <strong>The</strong> signal was passed throughthe intermediate-frequency amplifier, limiter, and discriminator, andthe distortion was studied with the oscilloscope. Figure 23 shows aseries of oscillograms taken with different audio frequencies and deviations.It is easily seen that high deviations and high audio frequenciescause the most distortion.Reducing either one will decrease the distortion.<strong>The</strong>se curves cannot be compared directly with the theoreticalones previously shown, since the time delay is not the same. <strong>The</strong> timedelay used experimentally was limited to 16.2 microseconds by theavailable length of cable, while the theoretical curves were based on atime delay of 33.3 microseconds.Naturally, the increased time delaycauses the one signal to lag further behind and thus causes greaterdistortion. Crosby 8 has also shown many oscillograms of this type ofdistortion, taken over a path from Kansas City to Riverhead, LongIsland. <strong>The</strong>se show the characteristic sharp breaks in the audio outputand the effect of noise.Conclusion<strong>The</strong> calculations and experimental study show that serious distortionof a frequency-modulation signal can be caused by multipathtransmission over relatively short distances. This distortion is liableto be encountered in the vicinity of large buildings or other objectswhich reflect and absorb the waves and thus cause interference.<strong>The</strong>sebuildings or other large objects can be near either the transmitter orthe receiver and cause such reflections. <strong>The</strong> two signals will be inphase part of the time and out of phase part of the time during the8See page 401 of footnote reference 5.
294 FREQUENCY MODULATION, Volume Iaudio cycle. If the signals have approximately equal amplitudes, nearlycomplete cancellation results when they go out of phase. This changein amplitude modulates the resultant carrier since it causes a suddendrop or deep hole in the resultant carrier amplitude, as shown byD - I00,000~ ft = 4000" D- 75,000" fJ =4000~D 100,000" fJ = IOOO" D =75,000" fJ = 1000*D = 75,000" fJ = 400"Pig. 23—Oscillograms showing distortion.
MULTIPATH DISTORTION 295Figures 1, 3, 9, etc. If these holes are so deep that the limiter in theconventional receiver cannot hold the output constant, amplitude modulationwill be impressed on the discriminator.respond to these variations inIf the discriminator canamplitude, the output will be distortedat the part of the cycle which corresponds to the hole in the resultantcarrier.If the resultant-carrier amplitude drops below the noise level,the distorted part of the cycle will have noise superimposed on it.Cases have been observed in which the output was undistorted at allparts of the cycle except at one point, and there the output was allnoise.Each time the two nearly-equal carriers go out of phase, there is avery rapid phase shift which causes a peak or dip in the output correspondingto this phase modulation. <strong>The</strong> worst distortion occurs whenthe two signals are of nearly equal voltage, and when the two radiofrequencycarriers are out of phase when the modulation is removed.<strong>The</strong> distortion increases with the audio frequency because the higherthe audio frequency, the further the retarded wave lags behind, interms of an audio cycle. An increase in the maximum frequency deviationincreases the number of times the two signals go in and out ofphase in each audio cycle, and this also increases the distortion. Thisincrease of the distortion as the deviation is increased is in contrast tothe reduction of ordinary noise as the bandwidth of the transmissionis increased.<strong>The</strong> amplitude of each harmonic can be calculated by the formulasgiven. From these values, the effect of a low-pass audio filter can bedetermined. <strong>The</strong> low frequencies are not distorted very much, and thehigh frequencies will have their distortion reduced by the audio selectivity.This means that the medium frequencies will be the ones whichare distorted the most and they are the ones most needed for intelligibility.For shorter path differences the time delay is less, and thedistortion is reduced. If the two signals are approximately in phase atthe undeviated position, they cannot go entirely out of phase for pathdifferences less than about one mile with the deviations used today.However, if they are out of phase at the undeviated position, distortionwill be produced even for small time delays.For small deviations andlow audio frequencies the signals do not get far out of phase; thusthere is not much distortion.<strong>The</strong> distortion due to multipath transmission of frequency-modulatedwaves contains many high-order harmonics and is,therefore, differentfrom amplitude-modulation distortion caused by the same process.In amplitude modulation the harmonics are all of low order andare not so disagreeable.Frequency-modulation distortion often sounds
296 FREQUENCY MODULATION, Volume Ilike crackles, rattles, swishes, or gurgles and may not be objectionableon low modulation.It sometimes makes one wonder if the transmitteris being operated properly. At times it is noticeable only on the loudpassages and may sound somewhat like overloading in an audio-amplifiertube. At other times the distortion may be so bad that the signalis almost unintelligible; it then sounds somewhat like selective fadingin amplitude modulation.It is doubtful whether an increase in selectivity can decrease thedistortion. <strong>The</strong> hole in the resultant carrier and the coincidental phasemodulation can occur at any part of the audio cycle, and thus can occurat the carrier frequency as well as any other. This cancellation at thecenter frequency cannot be eliminated by greater selectivity. An increasein sensitivity usually helps to decrease the distortion, since ithelps to maintain sufficient carrier amplitude to operate the limiter atall times. A commercial frequency-modulation receiver designed toreduce multipath distortion should have a sensitivity of at least 10 or20 microvolts, and for that signal strength should remove all amplitudevariations in the signal even at the ends of the swing. <strong>The</strong> receivershould also remove the holes from the carrier; otherwise, distortionmay be noted on some stations that may have much higher signalstrengths than others which have no apparent distortion.A properly oriented directional antenna, such as a dipole, willreduce the distortion if the two signals are coming from differentdirections, as is likely to be true near large buildings.Such antennasare of limited value when the signals are coming from the same direction.A power-line antenna or built-in loop often gives multipathtrouble, and little can be done to reduce it since most such antennas arenot ordinarily adjustable, and the voltage pickup is usually less thanfor a dipole.In some receiving locations, the antenna should preferably beremote from the receiver so the relative field strengths will not bechanged appreciably as the occupants of the room move about.Caseshave been observed where the signal was either distorted or undistorteddepending upon where one stood in the room. For time delays ofapproximately 6 or 8 microseconds, the distortion can often be greatlyreduced by mistuning the receiver or discriminator until the hole inthe carrier coincides with the zero-balance point of the discriminator,since any amplitude modulation that passes the limiter then causesHowever, this may cause an increase in noise.very little audio output.Under these conditions, a tuning meter is of little value.
MULTIPATH DISTORTION 191Appendix IDerivation of Equations for Frequency-Modulation DistortionCaused by Multipath Transmission<strong>The</strong> analysis of this appendix is similar to that developed byCrosby, 4 and is repeated here for convenience. It will serve as an introductionto the derivation in Appendix II.Let one frequency-modulated wave be delayed with respect toanother by a given time interval t . This condition can be caused by atwo-path transmission, where one path islonger than the other by afixed distance. <strong>The</strong> equations for the instantaneous voltages of thetwo signals are£i cos0-j/ er^^-EesrneFig. 24—Composition of two vectors.D/\e x— E 1 sin I
298 FREQUENCY MODULATION, Volume IR = V#i8 + # 2 2 + ZEiE 2 cos 6.<strong>The</strong> angle 8 between the two vectors #1 and E 2 equals the differenceof the two arguments of the sine functions.D D8 = ^- sin 2-Kjxt sin 27r/i (t — 1 ) + a>t .<strong>The</strong> angle a between R and E 1is given byE 2 sin 8 x sin 8tan 1E x + E 2 cos 8 1 + x cos 1E 2-where x =Ei<strong>The</strong> law of cosines gives, thereforeej + e 2= V#i2+ £,2 2 + 2£' 1 £' 2cos 8 sinjD a; sin 6,>t + — sin 2-n-fit — tan-1fi 1 + x cos 8) . (21)Since sin a — sin (a — /?) = + 2 cos (a — /J/2) sin /?/2,D8 = 2 — sin irjitf) cos (2-Kjxt — T/xi ) + &tM= 2 COS (2-Kji.t — ,T/xi ) +
MULTIPATH DISTORTION 299gives the frequency modulation and resulting distortion. When thesignal goes through a perfect limiter the amplitude term is suppressed,and the argument of the sine term is effective at the discriminator.Calculation of Audio Output<strong>The</strong> output from the discriminator is proportional to the instantaneousfrequency, where the instantaneous frequency 9 is defined by1 df =2tt dt(argument of sine function)1 d2ttdtat H— sin Zirfit — tan-1D X sin {z COS (2ir/j.t — 7r,u£ ) + t, o)JSinced— tan --1 u -dxand
300 FREQUENCY MODULATION, Volume IAppendix IIFourier Series Analysis of Distorted Audio Output<strong>The</strong> third term of (23) of Appendix I represents the distortion inthe audio output from the discriminator.It was obtained by differentiationof the argument of the sine function of (22). Consider thistermd X sin {Z COS (27Tjui — TT[xt ) +
MULT1PATH DISTORTION 301and take logarithms of both sides,log (1 + xe
302 FREQUENCY MODULATION, Volume Icos (a; cos 8) — J (x)00+2 2 (— l) n ^2«(z) cos2«0n=looand sin (x cos 0) = 2 2 (— l) B/ 2B+1 (a;) cos (2re + 1) 0.n=0Multiply the second equation by i and add the first equation. Changethe cosine terms to the complex form.This givescos (x cos 0) + i sin (x cos $)= J (*) + 2 (-l)»/ 2n (a;)e !!i »»+ 2 (- 1) "/»(*)«-""'+ » 2 (-lW2„+i(»0 e.< 2»+«« + i 2 (-l) B / 2 n+i(a!)e-«» +1)W .Since (—l)» = i 2 » = r- a » and /„(a:) = (— 1)" •/_„(«), this proves thelemma.Lemma j3sin cos (a cos 6 + b)= 2cos& 2 (-l) m Jzm+iia) sin (2m + 1) 8m=0In complex form, using lemma a2m+ 2sin&ec2 (— !)"• ^(a) sin2mfl.m=lasin cos (a cos 8 + b)1= (q fc=— oo_ e -tW-»>2 VJ k(a)eW — e -U8+v 2 (— * ^* (°) «** \k=— ook=—ooJl r «.= J 2 WkW [e» —4tL fc =--Me«'«+
MULTIPATH DISTORTION 303J1 xAi k =- -' r-+ (-i) ~ lc 1J lc ^ 1 (a) e* - (- i) + !c 1 J Jc+1 (a) e*-"'}1 =.,4 /^- -*>1 K fe= 2 — i'- J,. (a) {e
304 FREQUENCY MODULATION, Volume I= 2^ 2 2 (-i) m (-^) B - 2 (2m + 1)
INPUT IMPEDANCE OF SEVERAL RECEIVING-TYPEPENTODES AT FM AND TELEVISIONFREQUENCIES*ByF. MuralIndustry Service Laboratory, RCA Laboratories Division,<strong>New</strong> York, N. Y.Summary— <strong>The</strong> input impedance of vacuum tubes is an importantcircuit design consideration at high frequencies. This report includesinformation on the input impedance of a number of currently availabler-f pentodes.Measurements are given on the variation of input resistance withfrequency, and on the variation of input resistance and capacitance withplate current. Measurements are also given for the compensation of inputresistance and capacitance variation with plate current by means of unbypassedcathode resistance.<strong>The</strong> frequency range of measurement was chosen roughly to cover thefrequency modulation and television transmission assignments as well asthe recommended intermediate frequencies of receivers for these services.Method of MeasurementT^HE resistance measurements were made by observing the changein Q when the vacuum tube input was shunted across a tunedcircuit. For this purpose two standard commercial Q-meterswere used to cover the desired frequency range. An important considerationin these measurements, particularly for low values of biasvoltage and for high values of measured resistance, was to keep the r-fvoltage across the tuned circuit to as low a value as possible. This wasdone not only to prevent grid current but also to avoid a shifttube's operating point.of theSince this difficulty was encountered primarilyat the lower frequencies the Q-meter used for this work was equippedwith an external 30-microampere d-c meter connected in series withthe Q-indicating meter of the instrument.This meter was calibratedby connecting a standard signal generator with calibrated attenuatoracross the Q-meter terminals and using the 1-volt point on the Q-meteras reference.values.This arrangement also extends Q measurements to lowerIt was also found necessary to place a shield plate,electrically connectedto the case of the Q-meter, between the coil of the tuned circuitand the tube being measured. This was done to eliminate the effects* Decimal Classification: R330 X R630.305
306 FREQUENCY MODULATION, Volume Iof inductive and capacitative coupling between the tube and the tunedcircuit.<strong>The</strong> capacitance measurements were made by observing the detuningwith the Q-meter's calibrated condenser.In the measurements for varying conditionsof transconductance,i.e. bias voltage, the parameter measured was the plate current. Thiswas done because plate current is nearly proportional to transconductance,the variable of interest, and readily measured.No attempt was made to operate the tubes at plate and screenvoltages other than the typical operating conditions given in Table 1.
:INPUT IMPEDANCE OF PENTODES 307general, circuit values and structural features were designed to simulateconditions found in typical circuit applications.For these reasons the graphically presented data is given in termsof smoothed out curves representing gross phenomena.Input Resistance<strong>The</strong> data is given in terms of input resistance since this is ofpractical interest to the designer. In the discussion, however, inputconductance is also used because, when complex, it is more readilyresolved into its component factors.Figure 1 gives the results of measurements on a number of tubesillustrating the relationship between the input resistance and thefrequency.<strong>The</strong>se tubes were operated under the conditions given inTable 1. <strong>The</strong> circuit connections are shown in Figure 2, where C hasthe values 4000 and 500 micromicrofarads for thefrequency ranges10-50 and 50-200 megacycles respectively.<strong>The</strong> input conductance of a vacuum tube with fixed operatingvoltages may be considered as varying with frequency according to theexpressiong l= k l + k af + k^p (1)where the fe's are constants for a specific tube and for specific operatingvoltages. <strong>The</strong> terms k t and hj are primarily dielectric losses due toleakage and hysteresis respectively, and distinguished from k 3f 2 whichis electronic. <strong>The</strong> electronic term, which is of particular interest athigh frequencies, is generally resolved into two factors, i.e. the motionof electrons in the cathode-to-plate space and the reaction of the platecurrent through any residual coupling element between the plate andgrid circuits.Although these factors could be analysed by means ofelectron ballistics and circuit theory an empirical method isas being more practical for engineering purposes.indicatedIf k tand k zf were negligible (1) could be written in terms of inputresistance as:1R< =—(2)Plotted in logarithmic coordinates (2) would give a straight line witha negative slope of 2. This is shown in Figure 1 for the purpose ofcomparison with the measured values.<strong>The</strong> departure at low frequencies from the theoretical curve ia dueto the increasing importance of k t and kj.
308 FREQUENCY MODULATION, Volume I10 100FREQUENCY- MEGACYCLES PER SECONDFig. 1—Input resistance vs. frequency with plate by-passed and tubesoperated under conditions given in Table 1.
——rINPUT IMPEDANCE OF PENTODES 309Pig. 2—Circuit for input impedance measurements.<strong>The</strong> departure at high frequencies, however, is the result of approachingseries resonance of the lead inductance, both internal andexternal, with the input capacitance of the tube. This condition isapproximately indicated in Figure 3.Although the actual input resistancebetween grid and cathode, R{, is inaccessible for direct measurementby the method employed, we can assume for the sake of argumentthat it does not depart from the inverse square law with frequency.<strong>The</strong> resonant effect then makes the apparent input resistance, R bseem to be lower than the corresponding value of R{. However, inO*~ffi\onps^-Fig. 3a—Series resonance in tube input circuit.oHJW^—Cgk!Fig. 3b—Equivalent tube input circuit.
310 FREQUENCY MODULATION, Volume Iaddition to this result, the resonance effect gives a voltage rise betweengrid and cathode resulting in an increase in the apparent transconductance.This may be considered as a compensating effect with respectto the R (gm figure of merit, which is discussed later, and should betaken into account by the designing engineer. It should be noted in
INPUT IMPEDANCE OF PENTODES 811resistance with plate current for the tubes in Table 1. <strong>The</strong> plate andscreen voltages used were those in the table and the plate current wasvaried by adjustment of the externally supplied bias voltage as indicatedin Figure 2.tjtr
312 FREQUENCY MODULATION, Volume Iductance which for most applications isa more useful figure of meritthan input resistance alone as this product determines the gain of highfrequency stages coupled by high Q single-tuned circuits.In original design work at high frequencies some effort is alwaysmade to adapt the circuits to the tubes being used by obtaining animpedance transformation in the interstage coupling network. <strong>The</strong>tooo>to
INPUT IMPEDANCE OF PENTODES 3139i = 9o + K9m (3)where g is the residual conductance with zero plate current and k 4 isa constant for a particular tube and a particular frequency. Inspectionof the graphical data shows that for these tubes at the frequenciesinvestigated the residual conductance, g , in (3) is so small that it canbe neglected. This makes possible the expression of the variation ofinput resistance with transconductance by:R t=(4)k±gmIf plotted in logarithmic coordinated (4) would give a straight linewith a negative slope of 1.Compensation of Input Resistance Variation<strong>The</strong> variation in input resistance of a vacuum tube may be substantiallyreduced by means of negative feedback through an unbypassedcathode resistor. This consideration is of particular value inthe operation of tubes with varying bias voltage.Also the use of anunby-passed cathode resistor makes possible an increase in the effectiveinput resistance for either fixed or variable bias operation. Figure 5gives measurements of input resistance with unby-passed cathoderesistors for those tubes which had their suppressors brought out ina separate base connection. <strong>The</strong> cathode resistor was interposed inplace of the connection kk in Figure 2.<strong>The</strong> effect of an unby-passed cathode resistor on the input impedanceof a tube is discussed in report LB-450. Neglecting higher orderfrequency terms and making a number ofapproximations the inputconductance of a tube with unby-passed cathode resistor may beexpressed as:g{ = gi— g tRk9m —
:314 FREQUENCY MODULATION, Volume Iresponds to the average input conductance of the compensated tube.Since g itfor the frequencies investigated, varies almost as the squareof the frequency the value of R k is almost independent of frequency.It may be noted from the measurements in Figure 5 that at lowerfrequencies the optimum compensating value of R kruns somewhathigher. This is to be expected since at lower frequencies g variestmore slowly.<strong>The</strong> use of an unby-passed cathode resistor produces a loss in theeffective transconductance of a tube. This is expressed by1 +RliOnv i + « 2 c fc2 i? fc2(6)where gm is the nominal transconductance. Since the second term inthe denominator is usually small compared to unity the R (gm figure ofmerit is generally improved.It should be noted that in the case of the 6BA6 tube the resistorfor optimum compensation is somewhat larger than the normal cathodebias resistor. This makes it necessary to either operate the tube at alower than normal value of nominal transconductance or secure thebias from a point in the circuit which is positive with respect to thecathode return point. It is also conceivable, since the departure is nottoo great, that the optimum compensating resistor could be used bychanging the plate and screen voltages to shift the operating point.Input CapacitanceIt was found that for the frequencies and tubes investigated theinput capacitance was practically independent of frequency.<strong>The</strong> measurements presented in Figure 7 were made at 10 megacyclesusing the tube operating voltages in Table 1 and the circuit inFigure 1. If transconductance instead of plate current were used forabscissae the curve would be substantially linear so that the inputcapacitance could be expressed as:Ci = C + k 5gm (7)which bears similarity to (3) except in that the first term is notnegligible and the C's are independent of frequency.
INPUT IMPEDANCE OF PENTODES 315Compensation of Input Capacitance Variation<strong>The</strong> variation of input capacitance with transconductance isa disadvantagewhere the capacitance of the input circuit must remainunchanged under conditions of varying transconductance, i.e. varyinggrid bias. This is particularly true at the higher frequencies wherethe tube input capacitance usually forms a larger fraction of the totalinput circuit capacitance.
316 FREQUENCY MODULATION, Volume I<strong>The</strong> measurements in Figure 8 correspond to those in Figure 5 inthat the same values of unby-passed cathode resistance were used.Itshould be noted that at higher frequencies the third term in (8)becomes more important and contributes the negative shift observedin the measurements. If (8) is compared to (5) it is noted that thecoefficient of the second term in each is identical, i.e. R kgw Now ifthe third term in (5) were negligible the optimum compensatingresistor for variations in both input resistance and input capacitancewould be the same. However, since this is not usually the case, theoptimum value of compensating resistance for input capacitance variationis somewhat higher than for input resistance variation.Effect of Plate Load<strong>The</strong> measurements given in this report are for plate by-passed toground. Consideration of a finite plate load involves circuit designwhich is beyond the scope of this paper. However, it should be pointedout that the existence of a finite plate load has an effect on the inputimpedance of a vacuum tube through the coupling action of the gridto-platecapacitance. <strong>The</strong> effective input admittance of a tube whoseplate load is small in magnitude compared to its plate resistance andto the reactance of its grid-to-plate capacitance is given by:Y t'=Yt + 3aC„(l + gJ!,) (9)where Yj is the input admittance between grid and cathode, C gpis thegrid-to-plate capacitance and Z pis the plate load impedance. If Z pwere a pure resistance the effective input resistance would remainunaltered but the effective input capacitance would be increased.ConclusionBecause of the complexity of analysis the study of input impedanceof vacuum tubes has been, for engineering purposes, largely empirical.Also, the compensation of undesired impedance changes has beeneffected largely through experiment.<strong>The</strong> input resistance with zero plate load is practically inverselyproportional to the square of the frequency for the frequencies ofinterest here. <strong>The</strong> input capacitance is practically independent offrequency.<strong>The</strong> variation of input resistance is negative and that of inputcapacitance is positive with increase in transconductance. Negativefeedback through an unby-passed cathode resistor can be used to substantiallyreduce these variations. In general, the value of cathode
INPUT IMPEDANCE OF PENTODES 317
318 FREQUENCY MODULATION, Volume 1resistance must be higher for input capacitance than for inputresistance variation compensation.At the higher frequencies the designer should take into considerationseries resonance of the lead inductance with grid-to-cathode capacitance.Also he should take into account any appreciable reaction dueto a finite plate load.
FREQUENCY MODULATION DISTORTION CAUSEDBY COMMON- AND ADJACENT-CHANNELINTERFERENCE*!Bymurlan s.corringtonHome Instruments Department, RCA Victor Division,Camden, N. J.Summary— During frequency-modulated radio broadcasting the signal is liableto be badly distorted whenever muliipath transmission occurs or when any other interferingsignal is present on the same or an adjacent channel. During hot weather, orbefore a storm, long-distance reception has been observed from frequency modulationbroadcast stations on the U2-50 megacycle band. When such a distant station was in thesame channel as a desired station, it sometimes happened that for short intervals theundesired station became stronger than the desired one. When this happened there wasa small amount of noise and the programs suddenly changed. This interchange oftenlasted for several seconds but sometimes was limited to a word or two or a few notesof music.Formulas are given for computing the amplitudes of the harmonics and crossmodulationfrequencies produced by the interference. <strong>The</strong>se enable the calculation ofthe effect of a de-emphasis network following the discriminator, of a low-pass audiofilter, and of nonlinear phase shift in the amplifiers.FORIntroductionseveral years it has been evident that frequency-modulatedradio broadcasting offers certain advantages in noise reductionwhen compared with the usual amplitude-modulation systems.Many papers describe and discuss frequency modulation systems andtheir noise-suppressing properties. 1-8 Extensive field tests showed 9 that* Decimal Classification: K148.2 X R430.f Reprinted from RCA REVIEW, December, 1946.1 Edwin H. Armstrong, "A Method of Reducing Disturbances in <strong>Radio</strong>Signaling by a System of Frequency Modulation," Proc. I.R.E., Vol. 2'4, No.5, pp. 689-740; May, 1936.2 Murray G. Crosby, "Frequency Modulation Noise Characteristics,"Proc. I.R.E., Vol. 25, No. 4, pp. 472-514; April, 1937.3H. Roder, "Noise in Frequency Modulation," Electronics, Vol. 10, No. 5,pp. 22-25, 60, 62, 64; May, 1937.4E. H. Plump, "Storverminderung durch Frequenzmodulation," Hochfrequenztechnikund Elektroakustik, Vol. 52, pp. 73-80; September, 1938.5Stanford Goldman, "F-M Noise and Interference," Electronics, Vol. 14,No. 8, pp. 37-42; August, 1941.6Harold A. Wheeler, "Common-Channel Interference Between Two Frequency-ModulatedSignals," Proc. I.R.E., Vol. 30, No. 1, pp. 34-50 ; January,1942.(See next page for References 7, 8 and 9.)319
320 FREQUENCY MODULATION, Volume Iwhen frequency modulation was used there was less interference producedby two stations operating at the same frequency than for the correspondingcase of amplitude modulation, and that less power was required tocover a given area.It was also found that when the ratio of the carriervoltage to the noise voltage is high, the signal-to-noise ratio improvementdue to frequency modulation is considerable. As the interfering noisevoltage is increased with respect to the desired carrier-wave voltage,the improved noise suppression is obtained as long as the desired signalis several times as strong as the noise.When a definite carrier-to-noise voltage ratio is reached (a ratio of 2 or 3for wide-band frequency modulation) the amount of distortion in theaudio output increases rapidly. When the noise voltage exceeds the signalvoltage during all parts of the audio cycle, the noise eliminates the desiredsignal. This means that when frequency modulation is used the signal iseither good or bad; there is only a small range for the ratio of carriervoltage to noise voltage that gives a noisy, but tolerable, signal.Multipath transmission occurs when two or more interfering signalscome from the same transmitter, but one is delayed with respect to theothers because of a longer transmission path.been observed when multipath transmission occurs inConsiderable distortion hasfrequency-modulatedbroadcasting and fairly complete discussions of this problem areavailable. 10-13 If the second wave comes from a different station thanthe desired wave, the result is common- or adjacent-channel interferenceaccording to whether the two carrier frequencies are nearly the same orare separated by the width of one channel.<strong>The</strong>re is not much information available on the amount of interferenceto be expected in the new frequency modulation band. <strong>The</strong> effects to bedescribed were observed on the old 42-50 megacycle band and on the30-42 megacycle police bands. <strong>The</strong> frequency of occurrence and themagnitude of these effects will not be known for the new 88-108 megacycleband until a reasonable number of transmitters with normal powerand antenna gains are in operation.analysis given here will be applicable.If such interference does occur, the7Herbert J. Reich, "Interference Suppression in A-M and P-M," Communications,Vol. 22, No. 8, pp. 7, 16, 19, 20; August, 1942.8Robert N. Johnson, "Interference in F-M Receivers," Electronics, Vol. 18,No. 9, pp. 129-131; September, 1945.8 1. R. Weir, "Field Tests of Frequency- and Amplitude-Modulation WithUltra-High-Frequency Waves," Gen. Elec. Rev., Vol. 42, Nos. 5 and 6, pp. 188-191, May, 1939; pp. 270-273, June, 1939.10Murray G. Crosby, "Observations of Frequency-Modulation Propagationon 26 Megacycles," Proc. I.R.E., Vol. 29, No. 7, pp. 398-403; July, 1941.11A. D. Mayo and Charles W. Sumner, "F.M. Distortion in MountainousTerrain," Q.S.T., Vol. 28, No. 3, pp. 34-36; March, 1944.18Murlan S. Corrington, "Frequency-Modulation Distortion Caused byMultipath Transmission," Proc. I.R.E., Vol. 33, No. 12, pp. 878-891; Dec, 1945.18 S. T. Meyers, "Nonlinearity in frequency-modulation radio systems dueto multipath propagation," Proc. I.R.E., Vol. 34, No. 5, pp. 256-265; May, 1946.
COMMON- AND ADJACENT-CHANNEL INTERFERENCE 321Sometimes during hot weather, or before a storm, long-distance transmissionhas been observed from frequency modulation broadcast stations.During the summer of1944, station WSM-FM in Nashville, Tenn. washeard often in Camden, <strong>New</strong> <strong>Jersey</strong>. During July it was very strongand free of noise for nine evenings in succession and it was heard severalother evenings. Occasionally, long-distance reception from stations in alldirections was observed. On July 7, 1944 nearly all the mid-westernstations and several from other directions could be received in Camden,for about 2^2 hours with a standard commercial receiver and indoorsantenna. <strong>The</strong> following list of stations received was compiled that evening:Call Station MegacyclesWWZR Zenith <strong>Radio</strong> Corp., Chicago 45.1WGNB WGN, Inc., Chicago 45.9WBBM-FM Columbia Broadcasting System, Chicago 46.7WDLM Moody Bible Institute, Chicago 47.5WSBF South Bend Tribune, South Bend, Ind. 47.1WMLL Evansville on the Air, Evansville, Indiana 44.5WENA Evening <strong>New</strong>s Assn., Detroit 44.5WMFM <strong>The</strong> Journal Company, Milwaukee, Wisconsin 45.4WSM-FM National Life & Accident Ins. Co.,Nashville, Tenn. 44.7WMIT Gordon Gray, Winston-Salem, N. C. 44.1WMTW Yankee Network, Mt. Washington, N. H. 43.9W2XMN Edwin H. Armstrong, <strong>New</strong> York 43.1WHNF Marcus Loew Booking Agency, <strong>New</strong> York 46.3WBAM Bamberger Broadcasting Service, <strong>New</strong> York 47.1WABC-FM Columbia Broadcasting System, <strong>New</strong> York 46.7WABF Metropolitan Television, Inc., <strong>New</strong> York 47.5WIP-FM Pennsylvania Broadcasting Co., Philadelphia 44.9Some interesting common-channel phenomena were observed.StationsWENA, Detroit, and WMLL, Evansville, were of nearly equal strength.First one, and then the other was received; they changed about everyfifteen seconds.<strong>The</strong>re would be a slight amount of noise and the programswould suddenly be interchanged. This continued for about one-half hour.Sometimes the carrier-wave voltage levels dropped below the level atwhich the limiter inheard simultaneously.the receiver operated and both programs could beStations WSBF, South Bend, and WBAM, <strong>New</strong> York, were also in acommon channel.WSBF was stronger and was clear most of the time;WBAM would come in with sudden bursts of a word or two or a bit ofmusic as station WSBF faded rapidly. <strong>The</strong>se bursts occurred at intervalof about ten seconds.
,322 FREQUENCY MODULATION, Volume 1Some of the state police frequency-modulation systems have reportedserious skip interference on numerous occasions. In Missouri, on thetalk-back frequency of 39.78 megacycles, the interfering signals are usuallythose of the <strong>New</strong> <strong>Jersey</strong> State Police and the North Carolina HighwayPatrol Cars, although cars of the Ohio State Patrol and those of RhodeIsland occasionally cause interference. <strong>The</strong> signal strengths of the undesiredstations are greatest during May, June, and July and rangefrom weak to strong. <strong>The</strong> strong signals are of sufficient intensity toswamp out the local cars and may be received for an hour or two or forthe whole day, from about two hours after sunrise to an hour or so aftersunset.<strong>The</strong> Florida State Patrol have reported considerable interference onfrequency modulation from stations in California , <strong>New</strong> <strong>Jersey</strong> , Connecticutand Massachusetts, and they have made car-to-car contacts with Pittsfield,Massachusetts. <strong>The</strong> Michigan State Police reported that signalsfrom the Alabama State Patrol stations were received by their patrol carswith signal levels at the input to the receiver as high as 300 microvolts,and these stations in Alabama have taken control of their receiversthroughout Michigan for hours at a time.<strong>The</strong> Indiana State Police have had their cars blocked out by stationsin Virginia and Oklahoma for all cars more than three miles from the transmitter.During the hunt for escaped German war prisoners near Carlisle,Indiana, on June 10th, the interference was so bad they had considerabledifficulty maintaining contact with their cars.On June 22nd, during aman-hunt and road blockade following a bank holdup at San Pierce,Indiana,cars were completely blocked out at various times by cars inVirginia and Massachusetts. Further disruption of service was causedmany afternoons by the second harmonic of short-wave broadcast stationsin Massachusetts and <strong>New</strong> York.Recent observations by the Federal Communications Commissionshow that such bursts or sudden increases in strength of signals receivedbeyond the line of sight occur regularly. 14-15 <strong>The</strong> long-distance transmissionthat occurs during such bursts can be interpreted as reflections frommedia of height comparable to the E layer, but lying at each side of thegreat-circle plane. It is assumed that when meteors pass through theupper atmosphere, the air is ionized and this causes the bursts.If a local station is on the same channel as a distant one which is beingreceived in bursts, interference may be expected to occur for intervals as14"Measurement of V-H-F Bursts," Electronics, Vol. 18, No. 1, p. 105;January, 1945.15K. A. Norton and E. W. Allen, Jr., "Very-High-Frequency and Ultra-High-Frequancy Signal Ranges as Limited by Noise and Co-Channel Interference,"Pn:. T.R.E., Vol. 33, No. 1, p. 58; January, 1945.
|xCOMMON- AND ADJACENT-CHANNEL INTERFERENCE 323long as several seconds. This might even cause the program to changesuddenly from one station to the other during these short intervals.Analysis of Fundamental Case<strong>The</strong> most elementary case of frequency modulation interference is thatproduced when two unmodulated radio-frequency carriers, having nearlythe same frequency, are added together. This gives the usual heterodyneenvelope as the two voltages beat together. In addition there is a variationin the phase of the resultant which is equivalent to frequency modulation.If the difference in frequency of the two carriers is now variedsinusoidally by changing the frequency of one, keeping the two amplitudesconstant, the result is common-channel interference or adjacent-channelinterference, depending upon the way the one frequency is varied. It isthus evident that, if the most elementary case is properly analyzed, thefrequency modulation interference is merely a generalization of theresults.Heterodyne Envelopee 2As shown in Appendix I, if two radio-frequency carriers e t sin wi andsin (w + 2ir{L)t are added, the heterodyne envelope is given bywhereEnvelope = e^y/l + x 2 + 2x cos 2t\jjI (1)e i= amplitude of first carriere 2 = amplitude of second carrierx = e 2 /eiw = angular frequency of first carrier, radians per second[a = difference in frequency, cycles per secondThis is the voltage that will be obtained if the resultant signal is sentthrough a linear rectifier and filtered. Figure 1 shows the variation of theenvelope over one beat-note cycle as the ratio of the amplitudes of thetwo signals, x, is changed. For small values of x the envelope is approximately,Envelope = ei(l + x cos 2ir\i.t) x«l (2)As the ratio x is increased gradually, the higher harmonics increase inamplitude; so the peaks become broader and the hole in the carrier becomesdeeper and narrower. In the limit, as x—»1, the envelope becomesa series of rectified cosine waves, or:Envelope = 2e i |cosir[it= 1 (3)Average Value of Envelope. If the resultant heterodyne voltage is sentthrough a linear rectifier, the direct-current voltage across the rectifieroutput increases gradually as x is increased. Figure 2 shows that this
-324 FREQUENCY MODULATION, Volume Ivoltage increases 27.3 per cent when x changes from zero to one.in Appendix I, this voltage is given by:Average voltage = 2(1 + x)e, E 2yx1 + XAs shown(4)where E ] [is a complete elliptic integral of the second kind with1 + xmodulus2VxRoot-Mean-Square Value of Envelope. If a square-law rectifier instead of alinear rectifier is used, the root-mean-square value of the rectified envelopecan be read with an average-reading direct-current voltmeter. <strong>The</strong> rootmean-squarevoltage will increase more rapidly with x than the average2nyt —Fig. 1—<strong>The</strong> heterodyne envelope.Fig. 2—Harmonic content of theheterodyne envelope.voltage, as shown by Figure 2.<strong>The</strong> voltage is given by:Root-mean-square voltage = e,-\/l + x 2 (5)and it increases 41.4 per cent when x increases from zero to one.Fourier-Series Analysis of Envelope. If the heterodyne envelope is rectifiedwith a linear rectifier, and the radio frequency is filtered out, the resultantaudio signal (shown by Figure 1) can be expanded in a Fourier series.<strong>The</strong> coefficients of this series are given in Appendix I and the zero-frequencycomponent is the same as the average value which is shown byFigure 2. <strong>The</strong> fundamental component increases almost linearly withincreasing £ to a maximum value of % of the corresponding direct currentvoltage. <strong>The</strong> second harmonic increases slowly until it equals 20 per centof the fundamental when x = 1 , and the third harmonic has a maximumvalue of 8.6 per cent of the fundamental.
COMMON- AND ADJACENT-CHANNEL INTERFERENCE 325Phase-Angle Variations<strong>The</strong> two signals e i sin ut and e 2 sin (w + 2ir\x)t are in phase when t = 0.Since the frequency of the second signal is higher than the frequency of thefirst signal, this means that a vector representing e 2 will rotate with respectto one representing e t . If ei is a vector rotating at w radians per second,then e 2 will rotate at w + 2tt',j. radians per second.Figure 3 shows the variation of the phase angle cp which the resultant,R, of ei and e 2 makes at any given instant with the vector ei. Whent = 0, the two vectors are in phase and cp = 0. At a later time 2iryl =90 degrees, so e 2 and ei are at right angles and tan cp = e 2/ei = x. When2ir[j.t = 180 degrees, cp is again zero. This process gives the variations incp shown by Figure 4 . <strong>The</strong>maximum value of
.326 FREQUENCY MODULATION, Volume 1inscribed angle is measured by one-half its intercepted arc, cp increaseslinearly when e 2 turns uniformly. As e 2 approaches cancellation of e,, Ris an infinitesimal vector and + 90 degrees. As e 2 swings past cancellation,the direction of R suddenly reverses so
COMMON- AND ADJACENT-CHANNEL INTERFERENCE 327a frequency modulation receiver, with perfect limiting and linear phaseshift in the tuned circuits. As x approaches one, the output becomes moreand more like an impulse, until at x = 1, the output has the constant valueone-half except when 2ir\d = x; here the output becomes infinite. <strong>The</strong> areabetween the line one-half unit above the time axis and the curve for theinstantaneous frequency over one cycle is constant for aH values of x andequals — xfj..This means that as x—>l the output is constant except at2-ir^.t = 7r and at that point is an impulse equal to it(jl times a unit-impulsefunction.When x becomes greater than one, the polarity of the impulse changebut the shape is the same, as shown by Figure 8.2rrpt-Fig. 8—Audio output, x > 1.Average Value of Instantaneous Frequency. If the discriminator is tunedto the frequency w, the average audio output is zero when x < 1. Asshown in Appendix I, the average output is proportional to [a when x >1.<strong>The</strong> curves of Figure 8 show this shift in average value when e» becomesstronger than d and takes control.Root-Mean-Square Value of Instantaneous Frequency. If the audio outputfrom the discriminator is measured with an root-mean-square meter, thereadings will vary as shown by Figure 9. <strong>The</strong> output increases uniformlyfrom zero when x = until it rapidly approaches infinity when x = 1.When x > 1 the output decreases uniformly to one as x becomes large.'
328 FREQUENCY MODULATION, Volume 1
COMMON- AND ADJACENT-CHANNEL INTERFERENCE 329Peak-to-Peak Value of Instantaneous Frequency. <strong>The</strong> output when2ir\xt = it minus the output at 2x\tl = gives the peak-to-peak value ofthe instantaneous frequency. This is given by:Output O) - Output (0) =2x\i.(10)<strong>The</strong> curves of Figure 10 show how the peak-to-peak output varies as xincreases. When x = 1, the peak-to-peak output becomes infinite, andit decreases uniformly beyond this point.Harmonic Analysis of Instantaneous Frequency.of the audio output isthe result can be expressed as:If the harmonic contentcalculated by means of a Fourier-series analysis,06o3 0.4|o2
330 FREQUENCY MODULATION, Volume 1Fig. 12—Effect of low-pass filter.fore, of limited band width is to reduce the output at 2ir\d = ir and tocause the resulting wave to oscillate about the curve that would be obtainedwith unlimited band width. For the case when n = 5, the peakoutput is reduced from 9 .0 to 3 . 69 , or the output becomes 4 1 per cent of thatfor unlimited band width. <strong>The</strong> curves of Figure 13 show thaeffect of limitedband width. <strong>The</strong> variable on the axis of abscissas shows the number ofharmonics passed by the low-pass filter, and the other axis shows thepercent of peak amplitude compared to that for unlimited band width.Thus, if x = 0.9 and 10 harmonics are passed by the filter, the peak output1 _y-zhiO 6040
COMMON- AND ADJACENT-CMANNEL INTERFERENCE 331will be approximately 65 per cent of what it would be if all harmonics werepassed.If x = 0.5, it is evident that five or six harmonies will give nearlyundistorted output.As shown by Appendix I, this ratio of the peak output to the correspondingpeak for unlimited band width is equal to 1 — x n where n. is thenumber of harmonics passed.Common- and Adjacent-Channel Interference<strong>The</strong> simplest case of frequency modulation interference(that of twoo2TT(jtFig. 14—Variation of distortion as interfering signal becomes stronger.unmodulated carriers of slightly different frequency) has already beendiscussed.If now the amplitudes of the two waves are kept constant, butthe frequency of one carrier is changed, the problem becomes one ofcommon- or adjacent-channel interference depending upon what range offrequencies the swings of the modulated carrier cover.If the deviationsof the one wave are about a mean frequency which coincides with thefrequency of the second carrier, the result is common-channel interference.If the mean frequencies are separated by the width of one channel, theresult will be adjacent-channel interference.
332 FREQUENCY MODULATION, Volume ICommon-Channel Interference, Interfering Signal Unmodulated. If afrequency-modulated signal and an unmodulated carrier produce thebeat-note interference,the output from a frequency-modulation receiverwith limiter will be as shown by Figure 14. This shows the wave form forthe various ratios of the interfering signal voltage x. When x = (i.e., nointerference) the output is an undistorted cosine wave, as shown by thedotted line. As the interference increases, the peaks and dips increase insize, until finally, in the limit, they become very narrow pulses superimposedon a cosine wave of one-half the amplitude obtained with no interference.As x becomes greater than one, the interfering signal takes control and2TTptFig. 15—Variation of distortion as interfering signal becomes stronger.the modulation of the desired signal is suppressed. Figure 15 shows howthe peaks and dips in output decrease when x increases from one to infinity.<strong>The</strong> envelope of the carrier amplitude corresponding to Figures14 and 15 is shown by Figure 16. <strong>The</strong>re is one cancellation or hole in thecarrier amplitude corresponding to each peak or dip in the output, sincethe rapid phase change which occurs at cancellation produces the largefrequency deviation. If the limiter is not able to maintain a constantvoltage input to the discriminator, the amplitude variations of the carrierwill cause a reduction in the peaks in the output.Envelope of Beat-note Pattern. As shown in Appendix II, the beat-noteproduced in the output of a receiver with a perfect limiter during commonchannelinterference is a series of peaks and dips which are limited by the
COMMON- AND ADJACENT-CHANNEL INTERFERENCE 3332.0-1.8uj 1-6Qa. 1.22^ 1.00.80.60.40.2
334 FREQUENCY MODULATION, Volume IThis will be true for all modulation indexes D/\y. <strong>The</strong> effect of increasingthe modulation index is to produce more peaks and dips in output withno change in the limits. Figure 17 shows these two limits as dotted lines,for x = 0.5, and modulation indexes of 5 and 10. <strong>The</strong> output that wouldbe obtained with no interference is also shown as a cosine wave of unitamplitude. Figure 18 shows how the number of peaks increases when themodulation index increases to 30. <strong>The</strong> limiting curves are the same asbefore. <strong>The</strong> two signals have the common center frequency at 2ir\d = 90Fig. 18—Common-channel interference.degrees and 270 degrees so they do not beat together there.As the modulatedsignal deviates toward the end of the swing, the frequency differenceis large, and the peaks come more and more rapidly.Effect of Detuning Interfering Signal. If the interfering signal is detunedby an amount equal to one-half the deviation of the desired signal, theeffect is to move the frequency at which zero beat occurs to that point.
COMMON- AND ADJACENT-CHANNEL INTERFERENCE 335Figure 19 shows how the beat-note then becomes unsymmetrical.At oneend of the swing the two signals have nearly the same frequency and thebeats come slowly. At the other end of the swing there is a considerablefrequency difference and the beats are very much more rapid. <strong>The</strong> peaksand dips are limited by the two curves:D ex *cEnvelope = cos 2ir\sl + —1 + x 2r x + 1(12)andD „ ,a xcos 2-w\d +2ir x(13)Fig. 19—Common-channel interference, interfering signal detuned.Fourier-Series Analysis of Distorted Output. If the desired frequencymodulatedsignal is:e i= E isin (u< -\ sin 2r{it)t 1 (14)and the interference is an unmodulated r-f carrier of angular frequency
336 FREQUENCY MODULATION, Volume Iw + a, and phase angle 6, or:e 2 = E 2sin {(to + a)t + 6} (15)then, as shown in Appendix II, the envelope of the resultant carrier isgiven by:Envelope = Ei V 1 + x* + 2x cos /3 (16)where: /3 = — sin 2ir\d — at — 6and the audio output is given by:D COS 27T[X< - a/2-TTOutput = D cos 27rui —,cos (8 + xWhen this is expanded in a Fourier series to determine the harmonicand cross-modulation distortion, the audio output is given by:Output = D cos 2ir\d+ S 2 (- a;)" j- - £- I J r (nDM cos (re - nod - w6) (18)n = l r=-o° ( TO 2lT )where s = 2ir[i£, and a;/(i; x, 6) sin {(2r) (2^)} (19)r = lwhere the C- and S-functions are defined as follows:C(m, n; x, 6) = S Jm (sn) cos s6s = l S(20)S(m, n;x, 8) = 2 -^-^-* Jm (sw) sin s0 (21)x 2^1
COMMON- AND ADJACENT-CHANNEL INTERFERENCE 337To find the amplitudes of the various harmonics produced duringcommon-channel interference, compute the value of the desired C— or S —function from equations 20 and 21, and multiply by the proper factor,which is shown by the above equation 19 for the audio output. A specialtable of Bessel functions has been prepared for this purpose. 17<strong>The</strong> effect of a de-emphasis network following the discriminator, andof a low-pass audio filter, can be determined by computing the amplitudeof each harmonic that falls within the working range, correcting each onefor amplitude and phase changes in the audio amplifier and filters, andthen recombining them by superposition.If the signal-noise ratio is defined as the desired audio output withno interfering carrier present, divided by the peak noise (i.e., the maximumdeparture from the desired audio output when no interference ispresent), then, as shown by Figures 17 and 18, the signal-noise ratioindependent of the modulation index, but depends only on the ratio of thetwo voltages, x. This assumes a perfect limiter, adequate band width inthe amplifiers and discriminator, and linear-phase-shift circuits.If a de-emphasis network and a low-pass audio filter are used, many ofthe harmonics will be attentuated or removed, and the nonlinear phaseshift will prevent the remaining harmonics from coming into phase all atthe same time. <strong>The</strong> peaks of noise are therefore reduced considerably.When the modulation index, D/[x, is large, the noise beat-note peaks comevery rapidly. This means that the harmonics will be of high order andthey will be reduced or removed by the audio selectivity.isThis accountsfor the observed noise reduction with wide-band frequency modulationand shows that it is very important to use a de-emphasis network and lowpassfilter.Common-Channel Interference, Both Signals Modulated. <strong>The</strong> precedingcases have described the interference produced by an unmodulated carrieron the same channel as the desired signal, and the effect of detuning theinterfering carrier.This section is a discussion of the case when both thedesired and undesired signals are modulated sinusoidally, and of theresultant distortion, which is even more complicated.In order to illustrate this form of interference,conditions:assume the followingDi/y.i = 10, D 2 /'M = 5, Di = 4D 2 , (M = 2[A 2 ,x = E2/E1For example, Di = 60 kc, [Xi = 6 kc, Di = 15 kc, (a2 = 3 kc, x = 0.5 and0.9 could be one set of numerical values.17Murlan S. Corrington and William Miehle, "Tables of Bessel FunctionsJ„(x) for Large Arguments," Jour. Math. Phys., Vol. 24, No. 1, pp. 30-50;Feb., 1945.
33dFREQUENCY MODULATION, Volume I<strong>The</strong> beat-note envelope produced in this case is shown by Figure 20.<strong>The</strong> characteristic peaks and holes in the resultant carrier amplitude arepresent, but some of them are modified in shape because the two audiofrequencies are present simultaneously.Near 40 degrees and again near 130 degrees the two voltages start togo out-of-phase,but the two vectors then begin to reverse themselvesand only a small decrease in amplitude occurs.If this signal is sent through a receiver with a perfect limiter and lineardiscriminator, the resultant audio output will be as shown by Figure 21.Two cycles of the desired signal are shown as a dotted curve. This correspondsto one cycle of the undesired signal. As x increases toward one, thebeat-note interference increases inthe pulses become very narrow and long.amplitude until in the limit as x—>l,If x becomes greater than one,20° 40° 60° 80° 100° 120° 140° 160° 180°2^!-*-Fig. 20—Heterodyne envelope.the polarity of the pulses is reversed (as shown by Figure 22) and thisundesired signal gains control. When x becomes very large, only theundesired signal is received, as shown by the dotted cosine wave of unitamplitude.<strong>The</strong> equations for the envelope and the beat-note interference arederived in Appendix III. If Di and D 2 are the two deviations and [ju and[j.2are the corresponding audio frequencies, the envelope of the carrier is:Envelope = Ei VI + x 2 + 2x cos {Z>i/[J.i sin 2-iry.xt - ZVfAs sin 2irM}(22)and the audio output from a receiver with limiter and balanced discriminatoris:
COMMON- AND ADJACENT-CHANNEL INTERFERENCE 339Fig. 21—Beat-note interference, x < 1.Output cc D i cos 27r(j.—itDi cos 2irp.it — D 2 cos 2ir\Lttcos + 1/x+ 1cos 6 + x(23)where= — sin 2irii.itD[1.9sin 27T[x 2£.(24)2^Fig. 22—Beat-note interference, at > 1.
340 FREQUENCY MODULATION, Volume I<strong>The</strong> audio output isby the two envelopes:composed of a beat-note pattern which is limitedandEnvelope = -— — cos 2-rr^it + cos 2ir(j, 2 .it, /3 = 2tt|j,2< and the generalized C-function is denned as:C(k, I; m, n: x, 6) = 2 -t^-' 3 k (sl) Jm (sn) cos s6. (28)
COMMON- AND ADJACENT-CHANNEL INTERFERENCE 341<strong>The</strong> amplitude of any desired combination tone can be determined bychoosing the appropriate values of r and s and by computing the desiredC-function. Since the C-function cannot exceed unity for a given combinationtone, it is evident that if D i»[x i or jx 2 the distortion will be reducedwith increasing modulation index.ConclusionsFrequency-modulated radio broadcasting offers the advantage of improvednoise reduction when compared with the usual amplitude-modulationsystems. <strong>The</strong>re is less interference between stations operating onthe same frequency than for the corresponding case of amplitude modulation,and less power is required to cover a given area.A difficulty arose occasionally in the 42-50 megacycle frequencymodulation band because long-distance transmission could be observedfrom frequency modulation broadcast stations during hot weather orbefore a storm. It sometimes happened that such an interfering stationbecame stronger than a desired station in the same channel for shortintervals.When this happened there was a small amount of noise andthe programs suddenly were interchanged.This change often lasted forseveral seconds but sometimes was limited to a word or two or a few notesof music. If the proposed new frequency modulation stations are allcompleted, this interference may occur again. When the interfering stationhas nearly the same carrier frequency as the desired station this effectis called common-channel interference.If the two carrier frequencies areseparated by the width of one channel the result is called adjacent-channelinterference.<strong>The</strong> simplest case of frequency modulation interference occurs whentwo modulated carriers, having nearly the same frequency, beat togetherto produce a resultant signal. As the two voltages alternately reinforceand cancel each other, the result is a heterodyne envelope consisting ofa series of broad peaks and sharp dips. Each time the two interferingvoltages cancel each other to produce a hole in the envelope, there is arapid phase shift of the resultant voltage.Since the audio output from afrequency-modulation receiver is proportional to the rate of change ofthe phase of this resultant, the rapid phase shift produces a distorted audiooutput, which becomes more and more like an impulse as the interferingcarrier voltage becomes nearly equal to the desired carrier voltage.When the two amplitudes of the interfering voltages are kept constantbut the frequency of one is changed, the result is common- or adjacentchannelinterference depending upon what range of frequencies the swingsof the modulated carrier cover. <strong>The</strong> beat-note produced by this interferenceconsists of a series of sharp peaks and dips of noise and is super-
'342 FREQUENCY MODULATION, Volume 1imposed on the desired audio output. When the modulation index isincreased, these peaks occur more and more rapidly, and the harmonicsproduced are redistributed to higher and higher orders. If the receiverhas sufficient band wid^h, a perfect limiter, and a wide-band audio system,the signal-noise ratio does not depend on the modulation index, butis determined solelv by the ratio of the desired signal voltage to theundesired signal voltage.Formulas are given for computing the amplitudes of the harmonicsand cross-modulation frequencies produced by the interference. <strong>The</strong>effect of a de-en phasis network following the discriminator, of alow-passaudio filter, and o f nonlinear phase-shift can be determined by computingthe amplitude of each harmonic that falls within the working range.Each such harmonic is then corrected for amplitude and phase changes inthe audio amplifier and filters, and they are then recombined by superpositionto obtain the filtered audio output.When the modulation index is large, the beat-notes of the noise comevery rapidly, and since this means that the harmonics are then of highorder, most of the distortion will be removed by the audio selectivity.This accounts for the observed noise reduction with wide-band frequencymodulation and shows that it is very important that a de-emphasis networkand low-pass filter be used to obtain maximum performance. Inorder to obtain the r.aximum signal-noise ratio, it
"COMMON- AND ADJACENT-CHANNEL INTERFERENCE 343<strong>The</strong> instantaneous frequency becomes:Id,, . to Id, x sin 2ttu1+ 9) = tt: + 5Z ^ tarrlf = 7T -r, M2t d< 2t 2i dl 1 + a; cos 27r[iito x cos 2ttu.< + x 2'zi + v--2ir ^ 1 + z 2 + 2z cos 271-fj.Z=_^ !^_2tt cos 2ttjj.< + 1/xcos 2ir\±t + x1 30This is valid for all values of x.to:For a balanced linear discriminator, the audio output is proportionalOutput oc(icos2^+l/% 1cos 2-K\d + x(31)When x«l, this is,approximately,Output
'344 FREQUENCY MODULATION, Volume I[ is a complete elliptic integral of the second kind with1 + x)modulus2Vx~1 + x'Root-Mean-Square Voltage of Rectified Envelope<strong>The</strong> Root-Mean-Square voltage of the rectified carrier envelope is:Root-Mean-Square voltage = e ilK j- I (l + a; 2 + 2x cos 8) dfl1*= eiV^L (1 + x 2 ) 8 + 2x sin 6Fourier-Series Analysis of Envelope= e,\/l + x 2 (35)<strong>The</strong> envelope of the earrier isgiven by:Envelope = ei Vl + x 2 + 2x cos 2iry.t where x ^1. (36)Consider the expression:Vl + x 2 + 2x cos (3 = (1 + xe^)i(l + xer^-U+l w « _ W x *e** mJSl xieM _ KD (3 ) (5 ) ^s, I"r + 2 :Ce 2(4) a;e + Xe +2(4)(6) 2(4) (6)-"\(8)X r + 2 W 2(4) X + 2(4)(6)^ 2(4) (6) (8)% & +'"Jby the usual binomial series expansion. 18 (37)where:Multiply these factors together, term by term, then:Vl + z 2 + 2x cos /3 = a + a i cos + a 2 cos 2/J + .. . (38)x 2 x 4 z 6 25za- 81 + 4- + 64+ 256+ 16384+ -'- ^(„ x 2 x i 5x 6 S5x s )ai = xv--i-6i-im-iMi- •• \(4018Edwin P. Adams, SMITHSONIAN MATHEMATICAL FORMULAEAND TABLES OF ELLIPTIC FUNCTIONS, Smithsonian Institution, Washington,D. C, 1939, p. 117.
' '_J__''COMMON- AND ADJACENT-CHANNEL INTERFERENCE 345~1 Ux 5x 4 7x 6 105z 105x8a ' " ~ 4 (4 ~ 128~ 512~ 16384~'J\(41)a> ~ 8" r~ 16 ~ 128~~1024 ~ 16384~ ')(42)2£. 4 5 1 —- 21a;4 _ ^L 6 429x8° 4 ~~ ~~64 1 20 ~ 320 ~ 1280 ~ 32768'a - 2 (- l)" l1(3)- (2wa " A M nl- D { £! i ^J_ ,J (43)\?!J 2- + X t*ra ft!2 2 * (n+1) (n + 2) ... (n+fc))( }This expression for a„ was previously obtained by Vigoureux 19 andMoullin 20In the limit as x — > 1:Envelope = V2 e i V1 + cos 2ir\d = 2e i | cos ir(j.(|= — h+|cos 0- i cos 207T { 3 15+ S cos39 -I cos49 -}= — Ji _ 2 2 (- 1 )" cos w6 ?7T i „ = 1 (2«) 2 - 1 \where = 2iry£. (45)Calculation of Average Value of Instantaneous FrequencyConsider the integral:'IT\L I X 2 + X COS £7T J 1 + X 2 + 2x COS £1 — t1ds (46)2dtMake the transformation: cos s = -, d £1 + t-' ' 1 + t*19F. M. Colebrook, "A Note on the Frequency Analysis of the HeterodyneEnvelope. Its Relation to Problems of Interference." Wireless Engineer & ExperimentalWireless, Vol. 9, p. 200, April, 1932.20E. B. Moullin, "<strong>The</strong> Detection by a Straight Line Rectifier of Modulatedand Heterodyne Signals," Wireless Engineer & Experimental Wireless, Vol. 9,pp. 378-383; July, 1932.
e346 FREQUENCY MODULATION, Volume I<strong>The</strong>n./•OOI J^± \ ( 1 + x) - (1 - x)t* jUt Jo (l + xY + (1 - x)2
--COMMON- AND ADJACENT-CHANNEL INTERFERENCE 347<strong>The</strong>refore / becomes:T2x(l + x)H 7T )x (4(1 + x) 3 (1 - x)\
348FREQUENCY MODULATION, Volume ILet 2ityd = (3 and tan ax sin /31 + x cos (3<strong>The</strong>n k sin a = x sin /3(59)k cos a = 1 + x cos /3(60)where: fc = vl + x + 2 2x cos /3(61)x sin£I +x cos /3Fig. 24—Determination of k.Multiply equation 59 by i and add equation 60.<strong>The</strong>n: 1 + x cos /3 + ix sin (3 = k (cos a + i sin a) (62)or: 1 + x e' p = A; e ia . Takelogarithms of both sides. <strong>The</strong>n:log (1 + x e fS ) = log k + ia.Since:X2 t-3 'v> 4log (1 + Z) = X _—+—--+ ... - Kx
COMMON- AND ADJACENT-CHANNEL INTERFERENCE 349<strong>The</strong> audio output is therefore proportional to:COOutput ex:- jx 2 (_ x) nn = lcos W/3 - 1< X gl (66)When /3 = 0, »Output cc - ;a 2 ( -x)" = —:-—n=l X + 1(67)When j3 = 7T, Output cc - [j. L"=Effect of Limited Band Width-^-(68)B=l X— 1To show the effect of a limited band width, consider the geometricalprogression:S = - ;j- 2nx" (69)n = lBy ordinary long division:so,p n - 1p- 1= 1 + p + p i + ... +P"-1(70)s =• ~ v-x X -~J W<strong>The</strong> ratio of the partial sum to the output at /3 -= tv equals 1 — x n .APPENDIX II.Common- and Adjacent-Channel InterferenceIn order to show the effect of common- and adjacent-channel interference,let the desired frequency-modulated signal be:ei = Ei sin (u>t + — sin 2^1) (72)and let the interference be an unmodulated radio-frequency carrier atangular frequency co + a, and phase angle 6, ore 8= £.sin {(w + a)t + 6} (73)
:350 FREQUENCY MODULATION, Volume I<strong>The</strong>n:ei + e 2= Ei\/ 1 + x* + 2x cos (3 sin jw< H sin 2uv.< - cpf-(74)where x = E,/Ei, /3 = — sin 2xti.< — atandtan cpx sin /31 + £ COS /3<strong>The</strong> instantaneous frequency becomes:w 1 d . x sin /3— + D cos 2ir(Ji< - ^- -r. tan 1— -2tt 27r eft 1+ x cosw „ „ x cos,+ x 2 a )s 5 ]D cos 27r[i2 - —\2w 1 + x + 2 2x cos /3 ( 2tt)= — + D cos 2-kuX - - :(0 ^ Z) COS 2irui — a/27r= — + D cos 2irui-;2x cos ? + */* + i r 75 )Envelope of Beatnote Patternis1cos p<strong>The</strong> beatnote produced in the output of a receiver with a perfect limitergiven by:+ xOutput = D cos 2Tr\j.tD cos 2ir\Lt — cv/2ir2»£+l£ + i ( 76)cos p + Xwhere: = — sin 2ir,it —at— 6. <strong>The</strong> two envelopes of the maxima andI*minima of the beat-note pattern are obtained by setting ft= 2mr or(2n + l)ir where n is an integer. This gives the two envelopes:D oc xEnvelope = cos 2w\xt + - —1 + x 2-k X + 1(77)and:cos 2iru.t +- - (78)- X 2ir X - 1Fourier-Series Analysis of Instantaneous FrequencyIn accordance with the analysis of Appendix I, equation 65:
ltiCOMMON- AND ADJACENT-CHANNEL INTERFERENCE 351d ^ ,x sin /Sv / * „ d8 .„„.^-r- = - L (- x)» cos n/3 -£ (79)- tan-1 —Y sin s_ 2 g -»(«
352 FREQUENCY MODULATION, Volume I+ J3 e «c- + —«+ »•)2 J- k (ny)ef^k= -co+ De -«.-»«,-„e)2 J_ 7c (WT )e"4 as —oo_ .£L 6- «£;j^n^e^- — e«»«
COMMON- AND ADJACENT-CHANNEL INTERFERENCE 353+ j S {-x)*\d S [J,.! (ny) +J r+l (nY)"|c«"-"", -» ,}4 B -=l l r = -«L J+ D^f ^ [ J r _x (ny)+J T+l (ny) ] e -«»-»—»»-- I J r («T)[6
}354 FREQUENCY MODULATION, Volume I+ 2[x 2 (2r - 1) C(2r - 1,-; x, 6) cos {(2r - 1) (2x^)1+ 2[x 2 (2r) S(2r, -; x, 8) sin {(2r) (2iryU)(88)where the C- and S- functions are denned as follows:C{m, n; x, 9) = 2 (~ ^' J„(ms) cos s6 (89)s-1 SS(m, n; x, 6) = 2 ^ ^- J„(ws) sin s6 (90)«-l SX 2 < 1.APPENDIX III.Common-Channel Interference, Both Signals ModulatedWhen two frequency-modulated signals with a common carrier frequencyproduce interference, the effect is similar to that which occurswhen one wave is not modulated. <strong>The</strong> exact relations can be obtained inthe following way:Let: ei = JE7i sin (w< H sin 2x[j.it) (91)and: e 2 = E, sin (co< H sin 2ir(Xi t) (92)be the two interfering waves.<strong>The</strong>n:ei + e 1 =V / Ei ! + E,* + 2EiE, cos tji sin (a>< H'sin 2ir[iit -
—x,COMMON- AND ADJACENT-CHANNEL INTERFERENCE 355<strong>The</strong> instantaneous frequency becomes:f =— + I>i cos 2iru.it2. coMM 1 Vx +1w _ „ Di cos 2wu.it — Dt cos 2iru.itcos
356 FREQUENCY MODULATION, Volume I+ e~ ( « 2 J r (y) e ir " 2 J_ s (5) e*»r — oo s*= — °°eo+ e ix 2 J_ r (T ) e ,r *2 J.(fi) e (sSr = — oooos«=— oo+ «-«« f J_ r (T ) e ir *2 J s (5) e'" 5 }= ~\ 2 |~J f (Y) ei(r+1) « + Jr ( T ) e
COMMON- AND ADJACENT-CHANNEL INTERFERENCE 357<strong>The</strong>se two results give the expression:2ir 2 2 ^—'-—2cos wb —- =•[ J T (y) J s (5) cos (ra — sj3)'CM r =-»s = -oo ( v y »COCO= — 2 2 (/y.i - s^) Jr (y) J s (5) cos (ra - s/3) (104)W r=— oos=— oo<strong>The</strong> audio output from a balanced discriminator thus becomes:Output a D, cos 2ir[iit2j 2j 2j (r;xi - S(a 2 ) J, I ) J s I ) cos {ra- sB)„ = 1 r =-oo s =_oo n \ [Ai / \ ^.2 /= Di cos 2tt[Ai< +2 2 (r[Ai - sja 2 ) C(r,—-; s, —: », 0)r = — 00 S = — 00 [J. 1 fJ.2cos {ra — sB) (105)where the generalized C-function is denned as follows:C(k, I; m, n: x, 6) = 2 — J k (s I) J m (sn) cos s6, (106)s = l sa — 2-k\x4 and /3 = 2irj.%t.
THE RATIO DETECTOR*!ByStuart Wm. Seeley and Jack AvinsIndustry Service Laboratory, RCA Laboratories Division,<strong>New</strong> York, N. Y.Summary— A new circuit for f-m% detection known as the ratio detectoris coming into wide use. In this circuit two frequency-sensitivevoltages are applied to diodes and the sum of the rectified voltages heldconstant. <strong>The</strong> difference voltage then constitutes the desired a-f% signal.This means of operation makes the output insensitive to amplitude variations.<strong>The</strong> basic principles governing the operation and design of the ratiodetector are described. <strong>The</strong> ratio between the primary and secondary componentsof the frequency-sensitive voltages in a phase-shift type of ratiodetector is a function of the instantaneous signal amplitude. <strong>The</strong> a-mfrejection properties, however, are shown to depend upon the mean ratiobetween these voltages. An expression which is developed for this ratio interms of the circuit parameters provides the basis for arriving at anoptimum design. <strong>The</strong> measurements necessary in the design of a ratiodetector and in checking its performance are described.General DescriptionTamplitudes are a function of frequency, together with meansy ]|^HE principle underlying most circuits for f-m detection hasbeen the peak rectification of two i-f% voltages whose relativefor combining the rectified voltages in reversed polarity.This introducesa difference voltage, proportional to the difference of the twoapplied i-f voltages, which is a function of the instantaneous appliedfrequency. A representative circuit of this type is shown in FigureKa).While this circuit represents a considerable improvement overunbalanced f-m detectors in that it is amplitude-insensitive at thecenter frequency, it has the disadvantage that changes in amplitudeat other than the center frequency will cause the audio output tofluctuate proportionally as shown in Figure 1(b). This has beenrecognized and has resulted in the use of limiter circuits to removeextraneous amplitude variations from the applied signal.In the ratio type of f-m detector, the problem of making the de-Decimal Classification:R362 X R361.111.t Reprinted from RCA REVIEW, June, 1947.t Throughout this paper the following abbreviations are used: f-m:frequency modulation or frequency-modulated; a-m: amplitude modulationor amplitude-modulated; a-f : audio frequency; i-f: intermediate frequency.S58
RATIO DETECTOR 359mdqJTAfPREQ DEVFig. 1—Basic circuit of a balanced discriminator. <strong>The</strong> output characteristicin (b) shows the dependence of the output on the input signal amplitude.tector insensitive to amplitude variations has been met by splittingthe rectified i-f voltages into two parts in such a way that the ratioof the rectified voltages is proportional to the ratio of the appliedfrequency-sensitive i-f voltages. It follows that if the sum of theserectified voltages is maintained constant by a suitable means, and iftheir ratio remains constant, the individual rectified voltages willalso remain constant. <strong>The</strong> output will therefore tend to be independentof amplitude variations in the input signal. A representative simplifiedratio-detector circuit is shown in Figure 2. <strong>The</strong> circuit connectionsare such that both diodes carry the same direct current. <strong>The</strong> rectifiedvoltages add to produce the sum voltage, which is held constant.<strong>The</strong> sum voltage may be stabilized by using a battery or by shunt-L /2Fig. 2—Basic circuit of a ratio detector using the same phase shift inputcircuit as in Figure 1. <strong>The</strong> rectified voltage is stabilized so that the outputcan be independent of the input amplitude.
360 FREQUENCY MODULATION, Volume Iing a large condenser across the load resistors. If a battery is used,operation is limited to a signal at least strong enough to overcome thefixed bias created by the battery. On the other hand, if a large condenseris used, the voltage across the condenser will vary in proportionto the average signal amplitude and thus automatically adjust itselfto the optimum operating level. In this way amplitude rejection canbe secured over a wide range of input signals, the lowest signal beingdetermined by deterioration of the rectifier characteristics at lowlevels.When a" condenser is used to stabilize the rectified output voltageits capacitance must be large enough so that the rectified outputASSis(b) AT RESONANCE {C> BELOW RESONANCE (d) ABOVE RESONANCEFig. 3—Basic phase shift circuit used in frequency discriminators and ratiodetectors. <strong>The</strong> phase relations between the primary and secondary voltagesare shown, as well as the resultant voltages which are applied to each diode.voltage does not vary at audio frequency. This calls for a time constanton the order of 0.2 second and for capacitance values on theorder of several microfarads.Elementary OperationAlthough the exact analysis of a practical ratio detector is complicatedby many factors, it is not difficult to obtain a qualitativeunderstanding of the method of operation. A more detailed investigationof the circuit is made later.
:RATIO DETECTOR 361Since the ratio detectors described here use the balanced phaseshift type of input circuit, the characteristics of this circuit arebriefly reviewed. Figure 3 shows the basic phase shift circuit andthe manner in which the two frequency-sensitive voltages are obtained.<strong>The</strong>se voltages are combined in the ratio detector as shown in Figure4(a). <strong>The</strong> variations in the open-circuit voltages e 1 and e 2 are convenientlydescribed by Figure 4(b). <strong>The</strong> rectified voltages E x and E 2are approximately proportional to OA and OB. <strong>The</strong> phase angle
362 FREQUENCY MODULATION, Volume 1Fig. 5—<strong>The</strong> voltages E u E*, Ei +Ei, E1-E2 which are present in Figure4(a) can be plotted as shown,with the aid of Figure 4(b).the stabilizing voltage to maintain E x + E 2constant has the effectof improving the linearity of the detector characteristic and extendingthe maximum deviation that can be handled for a given amount ofdistortion.<strong>The</strong> manner in which the ratio detector maintains a constant outputindependent of amplitude modulation may be seen by reference toFigure 6. If the amplitude of the input signal is constant as in (a),the stabilizing current is zero and the circuit has essentially the sameoutput characteristic as a balanced discriminator. On the other hand,if the input signal increases as in (b), the diodes are driven harder,the average diode current increases, and this increased direct currentflows into the stabilizing voltage source.Similarly, if the input signaldecreases, as in (c), the diode current decreases and the stabilizing(O) Conslon! normal input amplitude e p= e QStabilizing current i flDiode current iD =;E, + Ej^Tr^Effective diode load resistance = R + R((b) Increase in Input amplitude e p > eStabilizing current L B Rj+RjEffective diode lood resistance < R +(c) Decrease in input amplitude e P - E. + E,Diode current !„ < _! *R,+ R zEffective diode lood resistance >R +R,(Fig. 6—<strong>The</strong> effect of changes in input signal level on the diode current,the stabilizing current, and the effective load resistance presented to thediodes. <strong>The</strong> stabilizing voltage Ei + E2 is held constant at the voltage equalto the rectified output when e P = e».
RATIO DETECTOR 363voltage makes up the decrease in diode current in order to maintainthe sum voltage across the two diode load resistors constant. Stabilizingthe rectified voltage, therefore, results in the equivalent loadresistance varying in such a way that it decreases when the input signalrises and increases when the input signal falls.This action of the stabilizing voltage in varying the effective diodeload resistance provides a convenient method for analyzing the mechanismof amplitude rejection. A first approximation to the behavior ofthe ratio detector, then, is to consider how the output is affected whenthe load resistance is varied above and below its mean operatingvalue. Figure 7 shows the result of varying R, while all other parameters,including the input signal, are held constant.Pig. 7—Effect on the output of the ratio detector when the load resistanceis varied. <strong>The</strong> curves were taken with the circuit shown in Figure 8.If the rectified outputs E x + E 2 and E x— E 2are measured, it isreadily possible to determine whether the detector constants, theprimary-secondary inductance ratio,the primary and secondary Q's,the coupling, the diode perveance, and the operating load resistanceare such as to yield good amplitude rejection.If the circuit is designedproperly, it will be found that, as R is varied, E t— E 2 will increasedecrease) at the same rate as E 1 +E 2. In other words, (2?i— E 2 )/(Ei + E 2 ) must be independent of K and hence independent of therectified current. If (E 1— E 2)/(E 1 + E 2 ) is independent of the rectifiedcurrent, then it follows that the ratio EJE 2must also be independentof the rectified current.To take a specific example, suppose R is increased so that, for afixed deviation, (E x— E 2 )/2 increases to twice its original value.(or
364 FREQUENCY MODULATION, Volume I<strong>The</strong>n E x + E 2 will also double. <strong>The</strong> input signal may therefore bereduced to one half itsoriginal value and the a-f output will then bethe same as it was before the change in R and the reduction in inputsignal. In practice, when a battery or a large condenser is used acrossthe load resistors, any variation in the input signal automaticallycauses the equivalent load resistance to vary in such a way as to keepthe a-f output constant, provided of course that the detector circuitparameters are properly related.<strong>The</strong> amount of downward amplitude modulation which can berejected, that is, the extent to which the signal can fall below itsinitial value without causing the output to change, is an importantcharacteristic. <strong>The</strong> limiting factor here is that, if the input signaldrops to too low a value, the voltages across the primary and secondaryare not sufficient to cause the diodes to conduct.Effectively, the diodesare biased off by the stabilizing voltage and the detector becomesinoperative until the signal rises to a level sufficiently great to causethe diodes to conduct.It is desirable to design the ratio detector so that the signal canfall to as low a value as possible without the diodes being cut off.This is accomplished, in general, by using a high value of secondary Qand by using relatively low values of diode load resistance so that theoperating Q of the secondary is on the order of 25 per cent of itsunloaded Q. Other considerations are also involved, but the extent towhich the operating Q is smaller than the unloaded Q is the principalfactor in determining the maximum percentage of downward amplitudemodulation which can be rejected without the diodes being cut off.<strong>The</strong> limitation of the diodes being biased off by the stabilizedrectified voltage does not exist as far as upward modulation is concerned.In general, the ratio detector can reject higher percentages ofupward modulation than it can downward modulation.Ratio Detector ReceiversReceivers using the ratio detector have characteristics which differfrom limiter and locked-oscillator receivers in a number of respects.Since the rectified voltage across the long-time-constant load circuitof the ratio detector automatically adjusts itself to the input signallevel, there is no fixed threshold, and the a-f output and the stabilizingvoltage (which may be used for automatic-volume-control (a-v-c) ) areproportional to the input signal. Less i-f gain is required since theratio detector in typical designs will provide appreciable amplituderejection with as little as ten to fifty millivolts of input signal to thegrid of the ratio-detector driver tube. As a result, receivers using
RATIO DETECTOR 365this type of detector tend to be quiet between stations. When a-v-cis used, the selectivity of the receiver is maintained for strong aswell as weak signals.<strong>The</strong> tuning characteristic of a receiver using the ratio detector ischaracterized by comparatively low side responses. This results, inpart, because the high degree of amplitude modulation which an offresonantf-m signal acquires as it is modulated up and down the steepi-f selectivity curve produces relatively little output from the ratiodetector. <strong>The</strong> extent to which the side responses will fall below themain response depends upon the amount of a-v-c, the i-f selectivity,and the ratio-detector peak separation.Typical Ratio Detector<strong>The</strong> circuit and performance data for a ratio detector circuit oper-J_ 2000R 6~C 5— DEEMPHASIS CIRCUITPig. g—A ratio-detector circuit using a balanced phase shift transformerfeeding a 6AL5 double diode. <strong>The</strong> closely coupled tertiary winding Lt iswound over the B+ end of the primary to provide impedance matchingand improved sensitivity.ating at a center frequency of 10.7 megacycles is shown in Figure 8.In order to improve the sensitivity, a form of impedance matching isused between the high impedance of the driving pentode and the relativelylow impedance which the diodes reflect across the winding thatinjects the primary voltage into the diode circuit. This is, of course,the winding L twhich is wound over the cold end of the primarywinding L pand is tightly coupled to the primary. <strong>The</strong> phase of thevoltages across L pand L, is therefore substantially the same. <strong>The</strong>voltages across L tand L sare in quadrature (at the center frequency)and in accordance with the action which has been previously described,the demodulated f-m output is taken off through a connection to thesecondary winding.
366 FREQUENCY MODULATION, Volume I<strong>The</strong> construction of the transformer is evident from the photographin Figure 9.Slug tuning is used for both primary and secondarywindings. Since a bifilar construction is used for the secondary winding,the slug penetrates each half of the winding to essentially thesame degree, and hence variation in the position of the slug does notunbalance the two halves of the secondary winding.Even where theSecondary is capacitively tuned, this bifilar construction is desirablebecause it provides close coupling between the two halves of the secondaryand uniform coupling of each half of the secondary to theprimary winding.As shown in Figure 8, the major part of the rectified output voltageForm: 13/32" O.D. %" I.D. Bakelite XXXShield Can: 1%" Aluminum, SquareTuning Slugs: Stackpole G-2, SK-124Primary: 24 Turns #36E close woundTertiary: 4% Turns #36E close wound onlayer paper electrical tape (0.004) overB + end of primarySecondary: Bifilar, 18 Turns (total) #28.Form double grooved 20 TPI. Length ofwinding = 0.45"All windings counter clockwisestarting at far end* Measured adjacent to side rod Eis stabilized by means of the 8-microfarad condenser C 3. This, in con-tu>-Fig. 9—Details of construction of the ratio-detector transformer used inthe circuit of Figure 8. <strong>The</strong> bifilar secondary connections are brought outsymmetrically to the vertical rods to prevent unbalance.junction with the two diode load resistors R tand R 2 ,gives a dischargetime constant of approximately 0.1 second. <strong>The</strong> rectified voltage dropacross R 3 and R 4 is not stabilized against changes in diode current.This permits minimizing the residual balanced component of amplitudemodulation (See Figure 21) for this particular circuit design.<strong>The</strong> fact that the two resistors R s and R± are not equal in value makesit possible to produce a compensating unbalanced component whichcancels the unbalanced component which could otherwise appear in theoutput (see Figure 22). This unbalance is principally due to thevariation in the dynamic input reactance of the diodes and is not
RATIO DETECTOR 367necessarily an indication that the circuit itself is unbalanced in anyway. <strong>The</strong> 47-ohm resistor R 6modifies the peak diode currents andfurther reduces thesignal levels.unbalanced a-m component, particularly at high<strong>The</strong> condenser C 4 bypasses the secondary system to ground at theintermediate frequency. <strong>The</strong> conventional deemphasis circuit whichis conveniently placed at this point provides further filtering againsti-f getting into other circuits and causing feedback. A 39,000-ohmresistor and a 0.002-microfarad condenser are suitable values for thedeemphasis circuit.<strong>The</strong> alignment procedure for this detector consists of applying anunmodulated i-f signal to the ratio-detector driver tube and peakingPig. 10—Output characteristic and performance data for the ratio detectorshown in Figure 8. Input signal = 100 millivolts; Rectified voltage = 6volts; A-V-C voltage = 2.5 volts; A-P output (75-kilocycle deviation) =0.7volt root-mean-square; Distortion (100 per cent modulation) = 2.5 per centroot-mean-square; Distortion (30 per cent modulation) =0.7 per cent rootmean-square;Maximum downward amplitude modulation = 70 per cent.the primary so that maximum rectified voltage is obtained, as indicatedby a d-c voltmeter connected to the a-v-c takeoff point(Figure8). <strong>The</strong> secondary tuning is then adjusted for zero voltage as indicatedby a d-c voltmeter connected to measure the voltage at the audiotake-off point. It will be noted that the alignment procedure is essentiallythe same as for a balanced discriminator.Because the primaryand secondary windings are below critical coupling, there is negligibleinteraction between the adjustments.<strong>The</strong> output characteristic of this detector is shown in Figure 10,along with the data giving the audio recovery and rectified voltagefor 100 millivolts input to the last i-f tube, i.e., to the ratio-detector
368 FREQUENCY MODULATION, Volume Idriver tube.Both the rectified output voltage and the a-f voltage areclosely proportional to the average signal input.One way of showing the amplitude-rejecting properties of thisdetector is by means of the output characteristic curves shown inFigure 11. <strong>The</strong>se are taken with a battery across the stabilizing condenserto hold its voltage constant at the normal value which waspresent just before the battery was applied. <strong>The</strong> input signal is thenreduced in strength until the diodes are cut off.Note that the outputremains essentially constant over a band of more than 150 kilocycleswhile the signal is reduced to one-third of its initial value. <strong>The</strong> peakseparation, however, is reduced as the input signal is reduced.Another more convenient way of showing the amplitude rejectionis to use an f-m signal which is simultaneously amplitude modulated.Pig. 11—Effect of reduction in the input signal. <strong>The</strong> stabilizing voltage isheld constant at a level corresponding to the 0.3-volt input signal. Note thereduction in peak separation for decreasing input signal.When this type of signal is applied, no stabilizing battery is requiredsince the stabilizing condenser will maintain the rectified voltageconstant for a-m frequencies above about 100 cycles. As explained indetail later, the extent to which the characteristics in Figure 12 differfrom a line, indicates the relative amount of residual amplitude modulationin the f-m output.In arriving at the design of this detector(Figure 8), a number ofcircuit parameters, in addition to those previously mentioned, areinvolved. <strong>The</strong>se include the unloaded and loaded values of primaryand secondary Q, the per cent of critical coupling between primary andsecondary, and the grid to plate gain under various conditions. <strong>The</strong>yare tabulated below:Primary: Unloaded Q = 70Operating Q (with diode loading) = 40Secondary : Unloaded Q = 89.Operating Q (with diode loading) = 21
RATIO DETECTOR 369Half-secondary/tertiary voltage ratio: 0.65Coupling: 0.50 of critical. (This includes the effect of the capacitanceunbalance due to the difference between the inputcapacitances of the two diodes.)Grid-to-plate gain : <strong>The</strong> normal gain is 100. (Under the conditionsyielding maximum gain, i.e., with downwardamplitude modulation off the center frequency,the grid-plate gain rises to 130.)Circuit Analysis<strong>The</strong> analysis of the ratio detector is more difficult than that of the100O MV INPUTFig. 12—<strong>The</strong> demodulated output when an f-m signal, 75 kilocycles deviation,having simultaneous a-m modulation, is applied to the ratio detectorin Figure 8. <strong>The</strong> f-m modulation is at 400 cycles; the a-m modulation is at250 cycles. <strong>The</strong> width of the detector characteristic indicates the residuala-m output.balanced discriminator primarily because of the variation in equivalentload resistance during the a-m cycle as well as during the f-mcycle. In addition, the problem is complicated by the complex impedancecharacteristics of the frequency-sensitive driving circuit, thenon-linearity of the diode characteristics, and the input reactancevariations of the diodes which tend to modify the frequency characteristicof the driving circuit. A productive method of attack is toconsider firstthe equivalent circuit and to develop an expression forthe ratio of primary and secondary voltage. This expression is impor-
370 FREQUENCY MODULATION, Volume Itant because the degree of a-m rejection and the peak separation areclosely related to this ratio.Equivalent Circuit<strong>The</strong> effect of the diodes on the ratio detector circuit can be simulated,as shown in Figure 13, by placing a resistance R/A-q across theprimary and a resistance R/rj across the secondary- This is the samerelationship which applies to the balanced discriminator circuit.From Figure 13 (b) it is clear why some form of impedance matchingis of great importance if good sensitivity is to be obtained. It isnot uncommon for R to have values of the order of 10,000 ohms or less,since R must be low enough to reduce the secondary Q to about one-5EC0HDARILOSO'NGSECONDS G>Unloaded primary Oiniooded secondor*S.'.S C »iT o DETECTORPig. 13—<strong>The</strong> equivalent circuit for a basic phase shift ratio detector show tthat the diodes reflect an equivalent shunt resistance jR/4i? across the primaryand a resistance R/v across the secondary.fourth of its unloaded value. This would result in a load impedanceof 2500 ohms which is too low to provide good energy transfer froma pentode.A typical circuit using a tapped primary to obtain impedancematching has already been described. <strong>The</strong> equivalent circuit for thisarrangement is shown in Figures 14 and 15. This circuit differs fromFigure 13 in that the diode loading isacross the primary as a resistance w 2 times as great.across the tertiary and appearsReferring to Figures 14 and 15, it is shown in the Appendix thatSP1+- w2 Q s(l)
RATIO DETECTOR 871(a) "TAPPED" PRIMARY RATIO DETECTORJ L s
372 FREQUENCY MODULATION, Volume Iating Q of the secondary (Q, 1 ) is small in comparison with theunloaded Q (Q s°). This assumption is usually justified and accountsfor the factor R/rj not appearing in the equation. Q p° appears in theequation because it cannot usually be assumed that the loaded primaryQ will be small in comparison with the unloaded primary Q.It is shown in the Appendix that the half-secondary voltage S isgiven byS = gm *L tQ*n ====( 2 )n 2 Q/ 1 + « 24 A/ 1+ 4aQB°orgm a,L,Q,1 n / PS = ~ (3)4 \ S ) 1 + a<strong>The</strong> expression for S is put in this form because in general S/Pwill not be an independent variable but will be fixed by considerationswhich determine the amplitude rejection and the peak separation.Effect of Varying S/PBefore discussing the significance of these equations, it is desirableto show the dependence of peak separation and a-m rejection on thevalue of S/P. For convenience, constant primary voltage is assumed;this simplifies the analysis and provides a basis for obtaining a solutionwhen the primary voltage is not constant. In this connection,whether the primary voltage variation is due to external amplitudemodulation, or whether it is due to the primary selectivity makes noappreciable difference in the analysis.<strong>The</strong> curves in Figure 16 were taken with constant primary voltage.As indicated, the a-f output characteristic is plotted for several valuesof S/P, P being held constant at the same value for all curves. <strong>The</strong>output characteristics are shown with and without the rectified voltagebeing stabilized. In addition, the variation in the rectified voltage isshown for each value of S/P. <strong>The</strong> same voltage scale is used throughoutfor the a-f output and the rectified voltage variation.From Figure 16 it is clear that as S/P is increased, the peak separationincreases. This is true whether the rectified voltage is stabilizedor not; that is, it is equally true for the balanced discriminator orfor the ratio detector. When the rectified voltage is stabilized, how-
iRATIO DETECTOR 373ever, the effect of the stabilization is much more pronounced whenS/P is large than when S/P is small. <strong>The</strong> reason for this effect isapparent from a consideration of the rectified voltage variation. Asshown in Figure 16 this variation is much greater when S/P is largethan when S/P is small. It follows that the effect of stabilizing therectified voltage and removing the variations referred to above will begreater when S/P is large. Furthermore, since E x— E 2 and E^ + E 2(Figure 16) tend to fall as the deviation increases, the effect ofstabilizing the rectified voltage isseparation.to produce an increase in the peakl2C voutputJ \ t\iV
374 FREQUENCY MODULATION, Volume 1Fig. 17—<strong>The</strong> fraction of the total rectifiedvoltage which must be stabilized toreduce the residual balanced amplitudemodulation is a function of S/P. Forvalues of S/P greater than about unity,the a-m in the output increases if lessthan the full rectified voltage is stabilized.<strong>The</strong> a-m rejection is a matter of primary interest. To determinethe effect of S/P on the a-m rejection, amplitude modulation wasapplied for each of the conditions shown in Figure 16. As shown inFigure 17, a threshold value of S/P exists, and for values of S/Pgreater than this it is not possible to obtain good a-m rejection. Atthis critical value, which is approximately unity, the full rectifiedvoltage must be stabilized. As the value of S/P is decreased belowthis value, good a-m rejection will be obtained provided a particularfraction of the full rectified voltage is stabilized. <strong>The</strong> lower the valueof S/P, the smaller the fraction of the rectified voltage which mustbe held constant. <strong>The</strong> ratio of unloaded to loaded secondary Q is fourto one for the curve shown in Figure 17. A 6AL5 double diode was used.Stabilizing the Rectified VoltageTwo general methods for controlling the desired percentage of therectified voltage which is stabilized are shown in Figure 18. In (a),a resistor is added in series with the stabilizing condenser. In (b),the same effect is obtained by adding resistors R a and R bin serieswith the load resistance which is shunted by the stabilizing condenser.If these circuits are to be equivalent, then a change A / in the d-crectified current must result in the same change in rectified voltagefor each of the two circuits.Fig. 18—Two methods of stabilizing any desired fraction of the rectifiedoutput voltage.In each case the fraction of the output voltage stabilizedisapproximately equal to 2R/(2R + Ri).
RATIO DETECTOR 3752RFor circuit (a) , A E = A I•#12R + R 1For circuit (b) , AE = A / (R a + R b ) = A I R 22 = AI2R + Rt.'.At•R2Ror R 1— R 2== R 2provided R 2 < < 2R2R — R 2Both circuits provide equal diode loading since the total load resistanceis the same. When the desired variation in the rectified outputvoltage is small, then i^ = R 2as shown above.Factors Affecting S/PConsider the expression for S/P given by Equation (1). If Q/ islarge enough so that the primary Q is determined solely by the diodeloading, it is clear that« 1n 2 Q,» SandP4a QJ>This gives the useful result that for this condition the ratio S/P isindependent of the ratio between the primary and secondary inductance,and also independent of the number of turns in the tertiarywinding. For this condition, then, S/P is dependent only on the percent of critical coupling and is equal to a.When the diode damping of the primary is comparable to theprimary losses, S/P is greater than a as indicated by Equation 1.<strong>The</strong> extent to which the primary is damped by the diode rectifiers isof interest since the amount of downward amplitude modulation thatcan be handled depends, among other factors, on the primary diodedamping. <strong>The</strong> greater the amount of damping, the greater will be therejection of downward amplitude modulation because downward amplitudemodulation is accompanied by an increase in the effective loadresistance and hence an increase in the effective primary Q.increases the gain and helps to offset the drop in signal level.This actionReferring again to Equation (1), it is desirable to determine theextent to which the damping on the primary can be increased withoutdecreasing the value of S/P which must be maintained at approxi-
376 FREQUENCY MODULATION, Volume Imately unity.Since a will be fixed within relatively narrow limits byconsiderations which will be discussed later,the only variable part inthe expression for S/P is w 2 Q s V4a Q P°, Assuming that Q s x is as largeas practicable, consistent with the unloaded secondary Q being severaltimes the loaded secondary Q, this leaves the factor w 2 /4a °.Q pThisfactor must have a particular value, depending on a, in order to makeS/P approximately unity. <strong>The</strong> question arises as to whether there isany advantage in making n 2 large and a Q p° proportionately large, orin keeping n? small and making a "Q p proportionately small.To determine the manner in which the primary damping varies forparticular values of w 2 and corresponding values of a Q p°, consider theratio of the shunt damping resistance introduced by the diodes andthe equivalent shunt resistance of the undamped primary.iseqUalt0n*R4Q, *, 0,'cZ, aQ v°This ratiosince X s is not a variable here. Comparing this expression with Equation(1), it follows that the relative amount of diode damping on theprimary does not change with any change in n, Q °, por a, provided thesechanges are made in such a way as to keep constant both the ratioS/P and the percent of critical coupling. Of course, the sensitivitywill change, increasing with increases in n, a, and Q p°. <strong>The</strong> grid-plategain of the driver tube will also increase as n is increased.It has just been demonstrated that the primary damping cannotbe controlled by varying L p/L s , the unloaded primary Q, or the relativenumber of tertiary turns, if the ratio S/P is to be maintained. FromEquation (1) it is clear that if the primary damping is to be increased,it must be accompanied by an increase in a, in order to maintain theratio S/P constant. This increase in a is frequently undesirable, asdiscussed below.Consider Equation (2) which gives the value of S. Again if P/Sis held constant at approximately unity for optimum a-m rejection,the gain to the secondary increases with increasing values of Q 8 , nand a. For values of a between 0.4 and 1.0, £ increases rapidly witha, as shown in Figure 19. <strong>The</strong> implication of this, so far as design forhandling maximum downward amplitude modulation is concerned, isthat other things being equal, the initial per cent of criticalcouplingshould be approximately 50. This means that as Q pand Q„ increasewith downward modulation, the resultant increase inthe per cent ofcritical coupling will cause the greatest changes in the gain to thesecondary.
;Pig. 19—Relative amplification from thedriver grid to the secondary as a functionof the per cent of critical coupling, wherethe change in the per cent of criticalcoupling takes place as a result ofchanges in the primary or secondary Q.RATIO DETECTOR 377Circuit Impedance Ratio<strong>The</strong> ratio detector circuit may be put in the form shown in Figure20. Normally the input signal voltages e xand e 2 will follow theapproximate variation shown in Figure 5. <strong>The</strong>se voltages may bederived from a phase-shift circuit, from side-tuned circuits, or fromother suitable means. A large number of circuit variations arepossible.If the circuit is analyzed from an impedance standpoint, it is foundthat the rectified voltages are in the same ratio as the input voltages,provided the circuit impedances z 1 and z 2 are in the same ratio as theinput voltages e ± and e 2.This can be demonstrated as follows. <strong>The</strong> diode currents flow inshort pulses, assuming ideal diodes, and therefore the fundamentala-c component of each diode current is nearly equal to twice the d-ccomponent. Since the d-c components are equal, it follows that thefundamental frequency a-c components will also be equal.i t = i 2iE x= k (e 1— izx ) and E 2= k (e 2— iz2 )EiE 2 e-> — iz2 e, / z 21-i —^_oe.Fig. 20—<strong>The</strong> ratio-detector circuit in a more general form. <strong>The</strong> voltagesei and e 2 may be produced in various ways, including the phase-shift circuitand side-tuned circuits.
378 FREQUENCY MODULATION, Volume IE xe x
RATIO DETECTOR 379at a particular signal level. Above and below this level, a balanceda-m component is present. As indicated in Figure 12, the magnitudeof the residual amplitude modulation isnot large except at low levelswhere the diode perveance is low. <strong>The</strong> level at which optimum a-mrejection isobtained may be varied by altering the circuit constants,particularly the fraction of the total rectified voltage which is stabilized,or the ratio of secondary and tertiary voltages.Secondary InductanceIt is desirable to make the secondary inductance-capacitance(L/C)ratio as high as possible, consistent with keeping the secondary tuningcapacitance high enough so that stray capacitances and variations intube capacitances do not have an excessive effect on the tuning.Usinga high L/C ratio has the advantage of increasing the sensitivity andat the same time tends to reduce the peak diode currents. At a frequencyon the order of ten megacycles these considerations pointtoward the use of a secondary tuning capacitance on the order of 25to 75 micromicrofarads. Higher values result in lower sensitivity forthe same amount of a-m rejection without any significant advantageas far as stability of tuning and independence of tube replacementare concerned.<strong>The</strong> advantage of making the secondary a bifilar winding has beendescribed. If a single center-tapped winding is used instead of abifilar winding, it is desirable to use a fixed slug to obtain the samecoupling between the two halves of the secondary and the primary.Another circuit variation involves the use of two equal fixed condensersacross the secondary to obtain an i-f center-tap.<strong>The</strong> secondary Q should, in general, be as high as possible, consistentwith the desired peak separation. At frequencies on the orderof ten megacycles, this will mean a Q on the order of 75 to 150. Useof the higher values of Q will result in improved sensitivity for agiven a-m rejection. <strong>The</strong> peak separation, however, will be lower thanif smaller values of secondary Q were used.Load Resistors<strong>The</strong> value R of the diode load resistors will depend on the amountof downward amplitude modulation to be handled which in turn dependsupon the i-f selectivity characteristic, the amount of multipath transmissionanticipated, and the importance of obtaining the maximumsensitivity.In general, R will be selected so as to reduce the operatingsecondary Q to a value approximately one-fourth or less of its unloadedvalue.
380 FREQUENCY MODULATION, Volume I<strong>The</strong> lower the value of R, the greater will be the ratio betweenthe unloaded and loaded values of the secondary Q. This means thatwhen the diode current decreases during downward amplitude modulation,the Q of the secondary is able to rise considerably and to compensatefor the decrease in input signal by effectively raising thesensitivity of the detector. <strong>The</strong> greater the extent to which the Qcan rise when the input signal drops, the greater will be the downwardmodulation capability of the detector. In addition, the value of Raffects not only the operating Q of the secondary, but alsothe operatingQ of the primary. As a result of both of these factors, usinglower values of load resistance increases the extent to which the signalcan drop below its average value without the diodes being biased tocutoff by the stabilizing voltage.If the i-f passband preceding the ratio-detector driver tube is notflat over a range equal to the maximum frequency swing, the amplitudemodulation introduced by this selectivity must be removed by theratio detector. As a result of this, the more the i-f selectivity characteristicdeviates from a relatively flat top, the lower are the loadresistance values which must be used.If itis expected that a receiver using a ratio detector will be usedunder conditions of multipath reception, it follows that the detectormust be capable of removing the amplitude modulation which resultsfrom the partial cancellation of the direct signal by the delayed signalwhich reaches the receiver over a longer path.Experience with multipathreception indicates that it is desirable for the detector to be ableto reject more than 50 per cent downward amplitude modulation toreduce distortion as much as possible. Where very severe multipathisencountered, the phase modulation distortion which accompanies itbecomes appreciable even if all of the a-m distortion is removed.Sensitivity is also involved in the choice of load resistors. <strong>The</strong>greater the value of load resistance R, the greater will be the sensitivityand the less the downward modulation-rejecting capability.Primary L/C Ratio and Q<strong>The</strong> primary L/C ratio should be as large as possible in order toobtain the greatest sensitivity. <strong>The</strong> limiting factor is the maximumstable gain between the grid and plate of the ratio detector drivertube. When determining this maximum gain, it should be kept inmind that the gain may increase during downward amplitude modulation,particularly on either side of the center frequency.If the primary Q is high enough so that the operating Q of theprimary is determined essentially by the diode loading, the grid-plate
RATIO DETECTOR 381gain will rise to a higher value during the a-m cycle. This increasein grid-plate gain is desirable from the viewpoint of increasing theability of the detector to reject downward amplitude modulation, sothat in practice the primary Q is made as high as possible, consistentwith obtaining the required peak separation and not exceeding themaximum allowable grid-plate gain during downward amplitude modulation.Primary Impedance VariationDuring the a-m cycle two opposing effects take place which alterthe primary impedance and hence affect the gain between grid andplate of the driver tube. When the input signal falls, for example,the impedance coupled into the primary by the secondary increasesbecause the Q of the secondary rises. This tends to lower the gainfrom the grid to the plate of the driver tube. On the other hand, thediode loading across the primary decreases and this effect tends toraise the gain from the grid to the plate. From the viewpoint ofrejecting the maximum downward amplitude modulation, it. is desirablethat the circuit parameters be so related that the net change ingainbe such as not to result in a decrease in gain to the primary when thesignal level falls.Coupling<strong>The</strong> value of coupling used, along with the relative number ofturns used in the tertiary winding, is the principal factor in determiningthe ratio S/P. <strong>The</strong> importance of maintaining this ratio in thevicinity of unity, and the effect of varying the ratio by changing thecoupling, or by any other means, has been described. In general, thecoupling should be adjusted to be approximately one-half critical.Since the absolute coefficient of coupling which corresponds to criticalcoupling is itself dependent upon the load resistance and on the tertiaryinductance, the final coupling adjustment must be made after the otherparameters are fixed because the per cent of critical coupling is affectedby changes in these.Tertiary InductanceIn the notation used here, the tertiary inductance is specified interms of the parameter n where the tertiary voltage is equal to 1/ntimes the primary voltage. With a specified value of coupling in mind,usually about 0.5 critical, the number of turns on the tertiary isadjusted so that the required S/P ratio is obtained. If the requiredS/P ratio is obtained with too few turns on the tertiary so that the
382 FREQUENCY MODULATION, Volume Igrid-plate gain is high, this condition can be remedied by reducingthe primary inductance.Residual Amplitude Modulation in OutputIn general the ratio detector will not completely reject all of theapplied amplitude modulation. Where the effect of the applied amplitudemodulation is to cause the slope of the detector characteristic tovary, the output of the detector will appear as shown in Figure 21.<strong>The</strong> output amplitude modulation may be either in phase with theapplied modulation, or out of phase, i.e., the slope of the detectorcharacteristic may either increase or decrease slightly with increasingvalues of input signal, depending upon the circuit constants and thesignal level. Where the output characteristic appears as shown inFigure 21, when simultaneous amplitude and frequency modulationare applied, the output is said to be balanced in that, just as in thePig. 21—Effect of amplitude modulationon the output of a balanceddetector. If 100M = % amplitudemodulation of the input signal, thenAy = yM, and Ay/y = M. This isreferred to as a balanced a-m component.Fig. 22—Effect on the output of abalanced detector when amplitudemodulation causes a detuning ofthe secondary. This is referred toas an unbalanced a-m component.balanced discriminator, there isa center frequency at which the outputis insensitive to applied amplitude modulation. With properdesign, the amplitude modulation in the output, as indicated by theslope variation in Figure 21, will be very much less than the amplitudemodulation in the input signal. This is indicated by the oscillogramsin Figure 12.<strong>The</strong> output of a ratio detector will not appear completely balancedas shown in Figure 21, unless the circuit is compensated to removeamplitude variations which result from the fact that the effectiveinput capacitance of the diodes varies with the average diode currentand therefore varies during the a-m cycle. <strong>The</strong> detector output characteristicin Figure 22 shows the output characteristic which isobtained when an unbalance is present in the circuit; this may bedue not only to variations in the input capacitance of the diodes, but
RATIO DETECTOR 383Fig. 23—When unbalance is present, theeffect is to cause the crossover or point ofzero a-m response to be at other than thecenter frequency. This type of characteristichas both a balanced component ofa-m (Figure 21) and an unbalanced component(Figure 22).may also be due to unbalance in the transformer, diodes, or circuitconstants.Where the output of a detector contains both balanced and unbalancedcomponents, it will appear in general as shown in Figure 23.As would be expected, the effect of the unbalance is to shift the crossoverfrom the center frequency.Reducing Residual Amplitude ModulationIt is convenient to consider separately the means for reducing theresidual balanced component and the residual unbalanced componentof amplitude modulation in the output. Basically, the magnitude ofthe balanced component depends upon the ratio S/P at the mean carrierlevel. This may be visualized if the effect of a change in thesecondary Q on the ratio E x/E 2 in Figure 4 is considered; not onlydoes the secondary Q and hence the phase angle of the secondary currentchange with diode loading during the a-m cycle, but the relativeamplitudes of the primary and secondary voltages also change. <strong>The</strong>reis thus a complex relationship which governs the extent to which E 1/E 2is independent of diode loading, and this relationship is clearly afunction of S/P. Thus, it is to be expected, as shown in Figure 24,that there should exist an optimum value of S/P for which E x /E 2isFig. 24—On either side of the optimum value of S/P for which the balancedcomponent of a-m is zero, there is a reversal in the phase of the a-m in theoutput. Since, for a given transformer, the value of S/P changes withcoupling, the figure shows that for a loose coupling the output is 180 degreesout of phase with the input a-m, while the two are in phase for close coupling.
384 FREQUENCY MODULATION, Volume Iindependent ofdiode loading and hence for which the balanced componentof amplitude modulation in the output is a minimum. It willbe noted in Figure 24 that the phase of the output amplitude modulationwith respect to the input amplitude modulation undergoes a 180-degree reversal at the critical value of S/P.Since the principal effectof varying the coupling is to change the ratio S/P, Figure 24 alsoshows that for a given set of circuit constants, there exists a particularvalue of coupling for which the balanced component of amplitude modulationis zero.Reducing Unbalanced A-M Component<strong>The</strong> residual unbalanced component in the output may be reducedby several different means. <strong>The</strong> ratio detector circuit shown in Figure8 contains two methods for reducing the unbalanced component. Oneof these consists of making the two resistors R 3 and i? 4 unequal. Bythis means, it is possible to cancel the existing unbalance. This cancellationtakes place because the differential drop across these resistors,which varies with a-m modulation, feeds into the a-f output. Inpractice, R & and R± are adjusted so that the unbalanced component asobserved when frequency and amplitude modulation are applied simultaneously,goes to zero. During this adjustment the sum of R s and R 4remains essentially constant since this sum depends upon the ratioS/P rather than upon any unbalance which may be present. In addition,a resistor R 5 is used in series with the tertiary winding commonto both diode circuits. This modifies the peak diode currents and,particularly at high signal levels, has the effect of appreciably reducingthe unbalanced a-m component.Another method which may be used to reduce the unbalanced componentis to use diode load condensers which have appreciable reactanceat the intermediate frequency. At 10 megacycles, the values of loadcapacitance which are effective will range from about 50 micromicrofaradsto several hundred micromicrofarads. In general, the greaterthe perveance of the diodes used in the ratio detector, the smaller willbe the value of diode load capacitance which is required to eliminatethe unbalanced component.Still another method for reducing the unbalanced component is tovary the effective center-tap on the secondary winding slightly fromthe nominal center position.Single-ended or Unbalanced CircuitAll of the circuits which have been described thus far have beenof the balanced type, with the a-f take-off point at ground potential
.RATIO DETECTOR 385when the input signal is applied at the center frequeney.It is possible,however, to ground one side of the rectified output, as shown in Figure25. In this case, the voltage available for a-v-c purposes is twice asgreat as in the balanced circuit case. <strong>The</strong>re is no change in the a-foutput.Where only one diode load condenser isused, as in Figure 25(b),its capacitance should be twice as large as that used in Figure 25 (a)This follows because in (a) the two condensers are effectively inparallel at the intermediate frequency, while in (b) since there isonly one condenser its value must be twice as great.This relationshipis of particular interest where the unbalanced a-m component is reducedby using a critical value for the diode load capacitance, as previouslydescribed.In connection with unbalanced circuits, it may be noted for thecircuit shown in Figure 8, it is not necessary that the center of theFig. 25—Either one or two diode load condensers may be used in the ratiedetectorload circuit. To obtain the same effective diode load capacitancein (b) as in (a), Cz must be equal to the sum of Ci and C2 .load resistor be grounded; the a-m rejection will be essentially thesame if any point along the load resistor bypassed by the stabilizingcondenser is grounded. This statement is not true, however, at frequencieswhich are so low that the stabilizing condenser does noteffectively hold the voltage across its terminals constant.Time Constant of Stabilizing VoltageAt low audio frequencies, the a-m rejection of the ratio detector<strong>The</strong>depends upon the time constant of the stabilized rectified voltage.same considerations which determine the time constant in an a-v-ccircuit can also be applied to the determination of the time constantof the stabilizing voltage.In general, the discharge time constant ofthe stabilizing voltage, formed by the load resistance and the stabilizingcapacitance should be about 0.2 second. Time constants larger thanthis have an undesirable effecton the tuning characteristic which issimilar to the effect of too long a time constant in the a-v-c circuit ofa receiver.
386 FREQUENCY MODULATION, Volume I<strong>The</strong> manner in which the a-m rejection of a ratio detector varieswith the frequency of the amplitude modulation is shown in Figure 26.This detector (see Figure 8) has a time constant of 0.1 second. <strong>The</strong>characteristics apply (a) to a balanced detector with the center of theload resistor grounded and (b) to the unbalanced form of thecircuit which is the same as Figure 8, but with one end of thestabilizing condenser grounded. It should be noted that for the sametime constant, the balanced circuit gives much better rejection of lowaudio frequencies. This is to be expected because in the case of thebalanced circuit, fluctuations in the stabilizing voltage do not causeany disturbance in the output, whereas in the case of the unbalanced(0) BALANCED CIRCUIT-0-r-©4ID)UNBALANCED CWCUirFig. 26—A comparison of balanced and unbalanced circuits with respectto their effectiveness in rejecting low-frequency amplitude modulation.<strong>The</strong> time constant of the load circuit is the same for both.circuit they do contribute to the output. For a given value of timeconstant in the stabilizing voltage, then, it follows that the balancedcircuit will give better rejection of low-frequency amplitude fluctuations.TolerancesIn general, the ratio detector circuit will require more attentionto tolerances than is necessary for a balanced discriminator. <strong>The</strong>principal factor which must be controlled closely is the effectivecoupling between the primary and secondary winding, since this controlsthe ratio between the secondary and tertiary voltages, which inturn affects the a-m rejection. This coupling is determined not only
RATIO DETECTOR 387by the separation between the primary and secondary, but also by thecapacitance unbalance from either end of the secondary to ground.<strong>The</strong> ratio detector is essentially a balanced circuit and from itsmethod of operation it is evident that the degree of a-m rejection willdepend upon the two diodes having substantially the same characteristics.If the diodes differ materially from each other, the principa\effect will be the production of an unbalanced a-m component in theoutput. <strong>The</strong> effect on the peak separation and f-m sensitivity is usuallynegligible. If the detector is tested with an f-m signal which is alsoamplitude modulated, so that oscillograms similar to those inFigure12 are obtained, unbalanced diodes will have the effect of broadeningthe output characteristic which is indicative of an unbalanced a-mcomponent in the output.Measurements<strong>The</strong> measurements necessary in the design of a ratio detector andin checking its performance are described in this section. <strong>The</strong>seinclude the unloaded and loaded values of primary and secondary Q,the per cent critical coupling, the ratio of the secondary and tertiaryvoltages, and amplitude modulation rejection.Primary and Secondary Q'sTo measure the unloaded primary Q, the double diode is removedfrom its socket and the secondary is detuned. <strong>The</strong> primary Q is thendetermined from the selectivity of the primary tuned circuit. <strong>The</strong>loaded primary Q is measured in the same way but with the diodes inthe circuit so that the normal diode loading is reflected across theprimary through the tertiary winding.To measure the secondary Q, the primary winding is heavily loadedby shunting a resistance across it. <strong>The</strong> secondary Q is then determinedfrom the -selectivity of the secondary winding as indicated by the rectifiedvoltage variation with frequency. When measuring the unloadedsecondary Q, the diode load resistance should be replaced with highvalues of resistance, on the order of a megohm. When measuring theloaded secondary Q, the normal load resistors should be used. Forthese measurements the centertap of the secondary should be disconnectedfrom the high side of the tertiary winding, so as to prevent thetertiary voltage from contributing to the rectified voltage.Coupling<strong>The</strong> per cent of critical coupling can be measured by noting the
388 FREQUENCY MODULATION, Volume Ichange in primary voltage as the secondary is varied from a tuned toa detuned condition. With all circuit conditions normal, and the signalapplied at the center frequency, the primary voltage is noted. Withthe same input signal level, the secondary is detuned so that theprimary voltage rises. <strong>The</strong> per cent critical coupling can then beexpressed in terms of the ratio between the primary voltage with thesecondary tuned and detuned. For example, if the signal at the platerises 25 per cent when the secondary is detuned, the coupling is 50per cent of critical.Ratio S/P<strong>The</strong> ratio between the secondary and tertiary voltages can be measuredindirectly in terms of the rectified output voltage which isobtained (a) with the secondary tuned and (b) with the secondarydetuned. In both cases the input signal is adjusted so that the primaryvoltage remains constant. If the ratio between the voltages read in(a) and (b) is r, that is, ifRectified voltage (secondary tuned) V P 2 + S— = 2= rRectified voltage (secondary detuned) PSthen — = V r 2 — 1PSignal GeneratorIn checking the performance of ratio detectors it is convenient tohave available a signal generator which is capable of being simultaneouslyfrequency and amplitude modulated. <strong>The</strong> advantage of using thistype of modulation is that it provides graphically a complete picture(Figure 12, for example)of the f-m response of the detector and atthe same time shows the a-m rejection under dynamic conditions atevery frequency within the range of the detector.It is important that the signal generator used to check ratio detectorsbe free of spurious modulation. In particular, it is essential thatwhen the signal generator is amplitude modulated, no frequency modulationbe produced as a result of the amplitude modulation.If frequencymodulation takes place when the generator is amplitude modulated,the resultant output will be construed as being due to faulty a-mrejection whereas it is actually the normal f-m response of the detector.
Alignment ProcedureRATIO DETECTOR 389<strong>The</strong> ratio detector may be aligned by using either an unmodulatedsignal at the center frequency and a d-c vacuum-tube voltmeter, orby using an f-m signal generator and an oscilloscope.If an unmodulated signal generator isused, the procedure is to setthe signal generator to the center frequency. With the d-c vacuumtubevoltmeter connected to measure the rectified output voltage(thisis usually at the a-v-c take-off point) , the primary tuning is adjusted formaximum voltage.<strong>The</strong> procedure used for adjusting the secondary tuning dependsupon whether the center-tap of the stabilizing voltage is grounded orwhether one end is grounded. If the center-tap is grounded, the secondarytuning is adjusted so that the d-c voltage at the audio take-offpoint is equal to zero; the d-c vacuum-tube voltmeter is shifted to theaudio take-off point for this measurement. If the stabilizing voltageis grounded at one end (see Figure 25) rather than at the center, thesecondary tuning is adjusted so that the d-c voltage at the audio takeoffpoint is equal to half the rectified voltage.If sweep alignment isused, the primary can be accurately alignedby using a comparatively low deviation and adjusting itamplitude on the screen.for maximum<strong>The</strong> secondary may be adjusted by using adeviation such that the total frequency swing (twice the deviation)is equal to the peak separation. This procedure makes it possible toadjust the secondary tuning so that a symmetrical detector characteristicis obtained.Peak Separation<strong>The</strong> separation between the peaks on the f-m output characteristicsof a ratio detector may be measured most simply by applying an f-msignal and increasing the deviation until the response is just observedto flatten at the peaks. When this is done, the peak separation is equalto twice the deviation.If an attempt is made to measure the peak separation by plottingthe output characteristic point by point, the peak separation obtainedwill usually be considerably less than is obtained under dynamic conditionswith the output voltage stabilized. <strong>The</strong> f-m detector characteristicmay be plotted point by point provided a battery of the propervoltage is connected across the stabilizing condenser. <strong>The</strong> voltage ofthis battery must be equal to the rectified voltage which exists at thecenter frequency.In practice it is convenient to use a 7.5-volt C-batteryand to adjust the signal input so that the condenser-stabilized voltageat the center frequency is equal to the battery voltage.
390 FREQUENCY MODULATION, Volume IMeasurement of A-M Rejection<strong>The</strong> measurement of a-m rejection can be carried out by means ofa signal generator which can be simultaneously frequency and amplitudemodulated. <strong>The</strong> type of pattern obtained when there are residualbalanced and unbalanced components of amplitude modulation inoutput has been described in connection with Figure 23. Typicaloscillograms are shown in Figure 12.<strong>The</strong> measurement of the a-m rejection of a ratio detector can bedescribed in terms of the pattern obtained for a given frequencydeviation, i.e., for a given per cent of frequency modulation, and for agiven per cent of amplitude modulation.theIdeally the pattern obtainedshould remain a diagonal line regardless of the presence of the amplitudemodulation. <strong>The</strong> extent to which this pattern departs from astraight line indicates to what extent the detector fails to rejectamplitude modulation.While it would be desirable to be able to quotea single figure of merit to indicate the a-m rejection, it is essentialto check the performance at various levels and to interpret the wedgeshapedpatterns which are obtained so as to determine the extent ofthe residual balanced and unbalanced components of amplitude modulationin the output.In addition to the method of using a signal which is simultaneouslyfrequency and amplitude modulated, it is possible to make a-m rejectionmeasurements by using a generator which is only frequency modulated;To measure a-m rejection using this method, an f-m signal isapplied at full deviation corresponding to 100 per cent modulation,and a battery equal in value to the rectified output isshunted acrossthe stabilizing condenser. This battery will have negligible effect onthe f-m output. Now the input signal is reduced in value until thef-m output becomes distorted as a result of the diodes being biasedby the stabilizing voltage, and the f-m output drops to zero. <strong>The</strong> ratiobetween the initial input signal and the minimum input signal forwhich the f-m output becomes distorted is then a measure of theamount of downward modulation that the detector can reject. Forexample, if this ratio is r, then the per cent downward modulationwhich can be handled is 100 (r — l)/r. <strong>The</strong> performance of a typicalratio detector as measured by this method has been shown in Figure 11.To determine the rejection of the detector for upward amplitude modulation,the same setup is used, and the change in the output is notedas the input signal is increased.Since the amplitude of the input signal is not varied dynamically,this method will not indicate any unbalanced component which may
RATIO DETECTOR 391be present in the output. <strong>The</strong> latter is more conveniently measured byusing simultaneous frequency and amplitude modulation as previouslydescribed.Formulas for S/P and SAppendix<strong>The</strong> fundamental circuit under consideration is shown below in (a).Ht^-i-By <strong>The</strong>venin's theorem it is equivalent to (b), whereej = iX p= gm X pAt the center frequency,
——392 FREQUENCY MODULATION, Volume IX vI,Qm Q vQ, 1 Q. 1 i + « 2p 1e. = W, 1 e,1 + a 2^o — ^» -"- p —"fl'm y» -*»1 + a 2e s / X s Q s— = aTo find Qp 1 , the operating Q of the primary, refer to Figure 14.Q,. 1^vPR4n 2 R4Q„ x = •w 2 .R 1 X—vwhere a =X e n*R X,4a 1 +a X,4a Q Bo —t_ n*Q t l4a w 2 Q, 11+e»
RATIO DETECTOR 3931+P V 4aQ„°To find S, substitute in the expression for e,S =-9naX„ X,w 2 Q s4a1+- n*Q s4a Q»% a- 1 +« 29m X 8 Q, 1 n1+- w2 Q s1+a 2But— = aP1 +-4aQ,«.-.S:gmXsQ^n I P
394 FREQUENCY MODULATION, Volume ITHE DEVELOPMENT OF A FREQUENCY-MODULATED POLICE RECEIVER FOR ULTRA-HIGH-FREQUENCY USE*tByH. E. Thomas!RCA Manufacturing Co., Inc., Camden, N. J.SummaryThis paper first describes the general considerations bearing upondesign of a frequency-modulated mobile police receiver for use in the SO- toiO-megacycle band where the channel width is restricted to UO Kilocycles.<strong>The</strong> details of developing the various circuits around these considerationsare dealt with, and the paper then proceeds with a discussion of over-allperformance and field testing. Comparative and quantitative results showvery favorable performance using a double-superheterodyne circuit withautomatic-frequency control of the second oscillator.(12 pages; 7 figures; 2 tables)* Decimal Classification: R630.3.f RCA REVIEW, October, 1941.t Now with Engineering Products Department, RCA VictorCamden, N. J.Division,DEVELOPMENT OF AN ULTRA LOW LOSS TRANS-MISSION LINE FOR TELEVISION*!ByE. 0. JohnsonEngineering Products Department, RCA Victor Division,Camden, N. J.Summary<strong>The</strong> development of a low loss 300-ohm parallel wire polyethylenedielectric transmission line is described. Loss curves, as well as a photographof a production run sample of the line, are included. <strong>The</strong> disadvantagesof twisted pair and coaxial lines are discussed and the developmentalspecifications for a line to eliminate these disadvantages are setforth. <strong>The</strong> remainder of the paper deals with actual development of the lineand treats with the dielectric, line conductors, and line impedance. Resultsof field test are included. This line is also used for FM reception.(9 pages; k figures)* Decimal Classification : R320.41.t RCA REVIEW, June, 1946.
SUMMARIES — RECEPTION 395INPUT CIRCUIT NOISE CALCULATIONS FOR F-MAND TELEVISION RECEIVERS*!ByWilliam J.StolzeIndustry Service Laboratory, RCA Laboratories Division,<strong>New</strong> York, N. Y.SummaryEfficient design of input stages, a critical requisite in FM and television,involves a careful consideration of three important factors: totalnoise, sensitivity and signal-to-noise ratio. This paper discusses thesefactors and offers a physical concept of the three noise components withformulae and data necessary for input-circuit calculations.(5 pages; 10 figures)* Decimal Classification: R361.211 x R630.1.f Communications, February, 1947.
DUPLEX TRANSMISSION OF FREQUENCY-MODULATED SOUND AND FACSIMILE*!ByMaurice ArtztRCA Manufacturing Company, Inc., Camden, N. J.and Dudley E. FosterRCA License Laboratory, <strong>New</strong> YorkSummary— Laboratory and field tests of multiplexing aural and facsimileprograms on a frequency-modulated wave have been made. <strong>The</strong>results obtained show that while technically possible, difficulties are encounteredthat will probably make such operation undesirable. Enough ofthe theory of multitone modulation is discussed to show that circuitlinearity requirements are severe, and that the side bands can easily exceedthe 200-kilocycle channel width if the aural deviation is not reduced.Quantitative data are given on the types and percentages of cross-talkobtained."S 3.228 Facsimile Broadcasting and Multiplex Transmis-<strong>The</strong> Commission may grant authority to a high-frequency broad-Tsion.1. Introductiony }f ^HE F.C.C. rule defining requirements of high-frequency, auraland facsimile broadcasting stations is as follows:cast station for the multiplex transmission of facsimile and auralbroadcast programs provided the facsimile transmission isincidentalto the aural broadcast and does not reduce the quality of or the frequencyswing required for the transmission of the aural program.frequency swing for the modulation of the<strong>The</strong>aural program should beNomaintained at 75 kilocycles and the facsimile signal added thereto.transmission outside the authorized band of 200 kilocycles shall resultfrom such multiplex operation nor shall interference be caused to otherstations operating on adjacent channels."Little practical experience has yet been obtained with multiplexoperation of the kind called for in this regulation. For this reason ithas seemed worthwhile to report the resultsof some laboratory andfield tests carried out by KCA in Camden and <strong>New</strong> York. <strong>The</strong>se testswere made with the object of determining first, if any limitations andpracticaldifficulties were likely to be encountered, and second, to whatextent the introduction of multiplex facsimile signals might effectdesign of receivers for aural service only.It is generally conceded that in such a multiplex system the signalto-noiselevelthein the aural program should be favored as much as possible.In order to maintain and protect adequately the high signalto-noiseratio of the aural service, the facsimile signal must use a much* Decimal Classification : R581X R630f Reprinted from RCA REVIEW, July, 1941.396
DUPLEX SOUND AND FACSIMILE 397lower deviation. <strong>The</strong> ability of the facsimile equipment to operate ona much less favorable signal-to-noise ratio then becomes increasinglyimportant. <strong>The</strong> facsimile equipment used in these tests was designedto operate under conditions heretofore considered too severe for goodreproduction, and the finalresults obtained in the multiplex operationshould therefore be considered on the basis that all possible favoringhas been given to the aural channel. When used with a facsimile systemrequiring a higher signal-to-noise ratio, the facsimile would ingeneral become lessreliable and reproduction poorer.Practical difficulties were encountered in the field tests describedlater that limited the frequency deviations used for the aural portionof the multiplexing to 60 kilocycles. <strong>The</strong> facsimile service was addedat 15 kilocycles deviation, thus sharing the maximum deviation of 75kilocycles between the two services. Many things contributed to thislimitation of aural deviation and each will be described in turn.Before going to the tests and their results a description of the facsimilesignals used in these tests will be given. A general discussionof the frequency-modulation theory for multitone use is also in orderif the proper interpretation of the results is to be made.2. <strong>The</strong> Facsimile SignalsIn the usual broadcast facsimile services contemplated or now inuse, copy areas of from four to twenty square inches per minute aretransmitted. A good average at present would be 10 square inches perminute, the figure chosen for these tests. This was transmitted at 120scanning lines per inch, using a picture signal frequency range of fromzero to 1200 cycles. This signal can be transmitted in a variety ofways, the usual one being to carry the signals as an amplitude modulationof an audio tone. However, previous facsimile work has shownthat the use of a frequency-modulated sub-carrier for the facsimilesignals has many advantages over the amplitude-modulated subcarrier.1 <strong>The</strong> sub-carrier chosen in this case was 18 to 24 kilocycles,the picture signals occupying the band of 20 to 24 kilocycles and thefrequency being shifted down to 18 kilocycles for a short time onceper scanning line to indicate phasing. <strong>The</strong> spectrum then is as follows:18 kilocycles—phase signal20 kilocycles—white picture signal22 kilocycles—50/50 gray picture signal24 kilocycles—black picture signal<strong>The</strong> use of a phase signal to hold synchronism of the recorder isusually insufficient if very fine detail of recording is expected, and a1Mathes and Whitaker, "<strong>Radio</strong> Facsimile by Sub-Carrier FrequencyModulation," RCA Review, Oct. 1939.
I398 FREQUENCY MODULATION, Volume Isecondary synchronizing signal to control motor speed between phasepulses is desirable. A simple method of accomplishing this is to transmita control tone (60 cycles in this case) as an amplitude modulationsuper-imposed on the already frequency-modulated sub-carrier. Anamplitude-modulation of 30 per cent was used in this case, and theGO-cycle wave ischannel and attendant filteringthus transmitted without requiring a third multiplexThis complex wave of 18- toproblems.24-kilocycle frequency variation and30 per cent amplitude modulation then carries the picture, phasing,and synchronizing signals. When used in a simplex service and withthe proper limiters and filters, these signals have been found to bepractically immune to any normal signal fluctuations, and to reject all_ .aural _CHANNELIGUARD JBANDFACSIMILE^CHANNELI30/v 18000 20000J240OOPHASEYtMTEBLACKUPPER SIPEBAND LIMIT—OF FAX. KEYIHS 2520O~Fig. 1—Audio spectrum for multiplexed aural and facsimile.noise 6 decibels or more below the signal itself.Occasional interferencesequal to or even greater than the signal usually cause littlemarring of the copy.This composite signal was then used to deviate the r-f carrier 15kilocycles, the aural channel being added at 60 cycles deviation. <strong>The</strong>overall audio spectrum transmitted is then represented in Figure 1.3. Multiplex <strong>The</strong>oryIn tone multiplexing on an amplitude modulated system, the additionof the second tone produces an additional pair of side bands displacedfrom the central carrier by the tone frequency itself. All sidebands are proportional to the carrier amplitude and depth of modulation.In multitone frequency modulation the relationship of sidebands is not as simple as this, for each tone in itself produces aninfinite series of side frequencies. <strong>The</strong> case for two tones involvestwo such series of side frequencies, and their cross beat products.derivation of the side bands produced in such a two-tone system isgiven by Crosby 2 and can be readily applied to this type of multiplexing.2Murray G. Crosby, "Carrier and Side Frequency Relations with MultitoneFrequency or Phase Modulation," RCA Review, July 1938.A
''DUPLEX SOUND AND FACSIMILE 399Applying the Bessel function expression to the facsimile signalonly, with no aural signal, gives the plot in Figure 2 of the relativeamplitudes of carrier and side bands to transmit this signal withdeviations up to 25 kilocycles.It can be seen that for deviations below15 kilocycles the second-harmonic side band (J 2 ) is small and canprobably be neglected without seriously affecting the facsimile signalitself.<strong>The</strong> radio-frequency spectrum for the facsimile signal when operatingsimplex is shown in Figure 3. Suppose now that an aural toneis introduced and with such a low-frequency period that any smallsection of the wave may be considered as constant infrequency com-+*. -' -_-^- "J&&- —l«BSC5Sg- = ::rJ "~ DEVIATION-—*P*" " —i;r"8 10Fig. 2—Facsimile sideband amplitudesIS ' ' 26 • • - - j5KC(No aural).pared to the rapid deviation caused by the facsimile signal. Figure 4will then represent the wave. This is strictly true only when the auraltone introduced has zero frequency, for frequency modulations cannotbe added directly; but for frequencies in the aural band up to severalhundred cycles there is very little error. If only the first-harmonicside bands of the facsimile signal (±20 kilocycles) are considered,the band width under this condition will be ± 60 ± 20 or ± 80 kilocycles.If the second-harmonic side bands of ± 40 cycles are included,the width is ± 100 kilocycles.With an audio frequency of 3125 cycles having a frequency deviationof 75 kilocycles applied alone to the frequency modulator thespectrum appears as in Figure 5 for frequencies on one side of thecarrier, the side bands for frequencies on the opposite side of thecarrier being similar.
1400 FREQUENCY MODULATION, Volume IAt an audio frequency of 2500 cycles the resultant argument(Deviation divided by modulating frequency) comes within the rangeof the usual Bessel tabulations, and the sidebands of the multiplexmodulation can be determined. Thus with a 2500-cycle tone at 60kilocycles deviation and the 20,000-cyele tone at 15 kilocycles deviationthe amplitudes can be plotted as in Figure 6. <strong>The</strong> first chart gives theside bands of the audio tone only, and the second the side bands for thecombination of both tones. In both cases all side bands and side frequenciesare plotted as positive quantities, but due account of sign ofthe coefficients has been taken where several terms of the expansionare involved for a particular frequency. In these charts any coefficientgreater than 0.1 per cent was included.It can be seen that the bandwidth in Figure 6 is somewhat greaterthan in Figure 5, but that the side bands outside the 200-kilocyclechannel have less than 1 per cent amplitude.JoJ.0.86J2SOKC 40 30T 120 j10 - Fc + 10T0.35_LJz20 SO 40Fig. 3—Sideband chart of 20-kc signal at 15-kc deviation.By comparing Figure 4 with Figures 5 and 6, it may be seen thatthe low aural frequencies cause a greater side band extension than thehigher aural frequencies. For the higher frequencies, the product ofthe Bessel coefficientsbands toreduces the amplitude of the higher order sidea degree where the bandwidth of consequence becomes lessthan for a single modulating tone.<strong>The</strong> 60-kilocycle deviation for aural signals was used in the multiplexcalculations rather than 75 kilocycles, in order to keep the signalwithin the 200-kilocycle band width. As can be readily seen fromFigure 5, maintaining the aural deviation at 75 kilocycles and usingthe 15-kilocycle facsimile deviation would produce side bands outsidethe 200-kilocycle channel. Reducing the facsimile deviation to 10 kilocycleswould lower the amplitude of the out-of-channel side bands to64 per cent of their former value. This reduction would be insufficientto clear up the out-of-channel radiation, and furthermore would handicapthe facsimile in signal-to-noise ratio. Thus Figure 5 shows the firstpractical reason for reducing the aural deviation to 60 kilocycles whenmultiplexing with facsimile.
DUPLEX SOUND AND FACSIMILE 401Before going to the experimental results it would be in order topoint out the types of cross-talk that can occur ifto pass this entire band as represented in Figure 6.the equipment failsIf the bandwidthof the single-tone transmission is restricted at the extreme ends, onlyharmonic distortion of the resulting detected tone will be present, anda few per cent of distortion of this type will be little noticed. This sameamount of restriction on the two-tone transmission will result quiteDEVIATION100 KG 80 60 40 20 - F, + 20 AO 60 8.0 100 KCVERV LOW AUDIO FRE8.AT 60-KC DEVIATIONFIRSTSIDEBAND, - ZOKC SI6NAL AT>v \15-KC DEVIATION120 KC—•SECOND SIDEBAND*40 KCFig. 4—Facsimile signal of Figure 3 added to verylow frequency signal at 60-kc deviation.differently, for such band limiting will act as a preliminary frequencydiscrimination and change various side-band frequency modulations toamplitude modulations. This will introduce cross-talk in a mannersimilar to the action of a non-linear tube in amplitude multiplexing.It should be pointed out that a small percentage of cross-talk is farmore objectionable than the same percentage of harmonic distortion.<strong>The</strong> process of detecting a frequency-modulated wave requires dif-
402 FREQUENCY MODULATION, Volume Ii'erentiating 3 the wave to change the frequency variations into anamplitude-modulated wave. Amplitude detection follows this differentiation(or discrimination) to obtain the amplitude envelope. If thewaves represented by Figures 4 and 6 are differentiated, the originalmodulation frequencies are obtained intact. However, if one or moreof the terms in these side frequencies are eliminated before differentiating,the differentiated (or discriminated wave) tone will containterms proportional to the derivative of these missing terms. Any twoof these waves can then beat together inthe amplitude detector thatfollows this discriminator to give cross talk.Bandwidth limitation could occur in the transmitter itself, but themore likely place will be in the receiver intermediate-frequency amplifieror discriminator circuits. This is especially true in receivers hav-2075 KC DEV-3T2S-~>oI 40 SO 60 70 IKILOCYTLESFig. 5—Sideband amplitude.lij-L.90 100ing good adjacent channel selectivity and consequent narrow band-passaction in the i-ftransformers.After detecting, the requirements of linearity in any tube that bothaural and facsimile signals pass through together are the same as foramplitude multiplexing.In the case of two modulating frequencies which differ in characteras greatly as do those of sound and facsimile programs the linearityrequirements imposed on the system are much more severe than in thecase of single program modulation. With a single program, any nonlinearityof the modulator, the detector, or the audio-frequency portionof the receiver causes harmonic distortion. Distortion may also becaused by too narrow a receiver passband. This latter distortion willbe decreased appreciably, but not entirely eliminated by a limiter.of these causea of distortion may be classed as non-linearity.<strong>The</strong> distortion which results from non-linearity in the case of asingle program, if not too great, is not readily distinguished by theear. For example, there are many radio receivers having 3 per centor even 5 per cent distortion which are not objectionable to the major-3Carson and Fry, "Variable Frequency Electric Circuit <strong>The</strong>ory WithApplication to the <strong>The</strong>ory of Frequency Modulation," Bell System Tech.Jour., Oct. 1937.All
DUPLEX SOUND AND FACSIMILE 403ity of listeners. In the case of modulation by two different types ofprogram, however, non-linearity anywhere in the system results incombination tones or cross modulation. <strong>The</strong> cross modulation of oneprogram by the other has the characteristics of interference which isreadily noticed by the listener. An interfering program 30 db belowthe desired program is easily apparent, whereas distortion of a singleprogram 30 db below (approximately 3 per cent of) the fundamental,is seldom noticed.Consequently, duplex frequency-modulation transmission of soundand facsimile requires a somewhat greater bandwidth than a sound.zo60-KC DEV.2500 rvJLl50 8060-KC. DEY. SSOO^y PLUS15-KC. DEV. 20,00O~20 50 60 70KILOCYCLESFig. 6—Sideband amplitude.80I I Iprogram alone of comparable deviation, particularly for low modulatingfrequencies, and imposes much more stringent requirements on systemlinearity.4. Duplex Eeceiver<strong>The</strong> receiver for duplex transmission of sound and facsimile, inaddition to the requirement of exceedingly linear circuits, must beprovided with filters for separating the two programs following thedetector.A block diagram of a receiver constructed for tests of duplex transmissionis shown in Figure 7. Two selective circuits were used aheadof the converter and an i.f. of 8.25 Mc was employed to minimize likelihoodof spurious responses. <strong>The</strong> i-f passband was made somewhatwider than normal to guard against non-linearity from that source.
404 FREQUENCY MODULATION, Volume IIt had a response characteristic down 14 db at 100 kc each side of thecenter and down 37 db at 200 kc each side of the center.<strong>The</strong> detector characteristic was more linear than is usually thecase, having very small departure from a straight line up to 100 kcon each side of the center.It was found necessary to separate the sound and facsimile programsimmediately following the detector, as passing both througha single common amplifier stage, even a fully degenerated stage,resulted in excessive cross modulation. <strong>The</strong> de-emphasis filter in theoutput of the detector attenuated the facsimile frequencies sufficientlyso that cross-modulation did not occur in the succeeding stage. Anadditional low-pass filter was used following the first audio-frequencywFM RECEIVERAND DISCRIMINATOR
DUPLEX SOUND AND FACSIMILE 4055. Laboratory Tests of Duplex Transmission<strong>The</strong> first laboratory tests were of a preliminary nature and useda special receiver (with audio circuits similar to those in Figure 7)and a signal generator set at 43.5 megacycles. <strong>The</strong> facsimile signalwas as previously described, and the aural channel was fed by a beatoscillator or from a phonograph pickup. In these tests the receiverbandwidth was slightly higher than 200 kilocycles and good resultswere expected with the full aural deviation of 75 kilocycles and afacsimile deviation of 15 kilocycles. A tabulation of the results obtainedfollows:Audio
406 FREQUENCY MODULATION, Volume Imission of sound and facsimile. In this case a 4000-cycle tone wasused for the audio frequency and a 17,000-cycle tone for the facsimilefrequency.Simultaneous application of two tones to a system having any nonlinearityresults in combination tones that are the sum and differenceof multiples of the individual tones.For example, if two tones havingfrequencies a and 6 are applied to a non-linear element, the result willbe frequencies 2a, 26, 3a, 3b, 2a — b, 2a + b, 3a — b, 3a + b, 26 — a,2b + a, 36 — a, 36 + a, etc. In general, in a non-linear system the coefficientsof the higher-order terms are much smaller than those of thelower-order terms so that the greatest amplitude of resultant combinationtones is likely to occur with a high audio frequency and a lowfacsimile frequency.However, audio frequencies much above 4000 or5000 cycles seldom have sufficient energy, even when pre-emphasis isused, to modulate the transmitter fully. Consequently interferencebetween sound and facsimile is most likely for audio frequencies in the2000 to 5000-cycle range.<strong>The</strong> test was performed by modulating a laboratory frequencymodulationsignal generator by 4000 cycles and 17,000 cycles simultaneouslyand measuring the resultant frequencies in a dummy loadreplacing the voice coil in the output of the receiver by means of awave analyzer. Throughout the series of tests the input to the receiverwas 50 microvolts and the output was held constant by means of thevolume control at 0.5 watt. In all cases, except where otherwise noted,tuning was performed by applying approximately 150-kc deviation andthe receiver tuned to symmetrical distortion of the top and bottom ofthe wave as observed on an output oscilloscope.As an initial test, the 4000-cycle tone alone was applied and theharmonics read as the deviation was varied.4000-cycleTable ImodulationDeviation
DUPLEX SOUND AND FACSIMILE 407the order of 1000 or 2000 cycles.as a and the 17,000-cycle tone as b,If we designate the 4000-cycle tonethe resultant tones up to the fifthorder, would be b — a, b — 2a, b — 3a, b — 4a, or 13,000 cycles, 9000cycles, 5000 cycles and 1000 cycles respectively. <strong>The</strong> amplitude ofthese resultant frequencies was measured in the output of the receiverwith the two tones modulating the signal generator.In the second test, shown in Table II, the 4000-cycle tone had aconstant deviation of 60 kc and the deviation of the 17,000-cycle tonewas varied from 5 to 15 kc. <strong>The</strong> amplitude of 4000-cycle output wastaken as 100 per cent.Table II4000 cycles; constant deviation, 60 kc17,000-cycleDeviation
408 FREQUENCY MODULATION, Volume Iresultant components, especially 1000 cycles, which was the most prominentin listening. Even with the receiver so tuned, the output to theear was readily evident as being different from pure 4000 cycles.<strong>The</strong> results of these laboratory tests confirm the theoretical considerationsthat two tones applied to a system having any non-linearitywhatsoever will result in combination frequencies exceeding in amplitudethe harmonics which occur with a single modulating tone.Whenthese two tones differ widely in frequency, the low modulating frequencies,while producing greatest side-band extent, produce combinationtones outside the audible range, hence are lessdisturbing to thesound program. <strong>The</strong> higher-frequency audio tones, combining withthe facsimile frequencies, however, do produce serious interference inthe sound channel.6. Field TestsA series of tests was run on the system of duplex sound and facsimileon W2XWG (W51NY) frequency-modulation transmitter locatedon the Empire State Building in <strong>New</strong> York City during January1941. <strong>The</strong> receiver used in the tests was the one described above andwas tried at three different locations in <strong>Radio</strong> City, about one milefrom the transmitter.<strong>The</strong> facsimile and sound programs were applied in parallel to thegrid of the reactance tube modulator of the f-m transmitter and wereindependently monitored as to deviation. <strong>The</strong> response of the facsimilesystem was flat from scanner to transmitter within 0.5 db up to 24 kc.With careful tuning of the receiver and limitation of the deviationto 60 kc for the sound and 15 kc for the facsimile, substantial freedomfrom interference between the two was possible.Even with these conditions, a sound program with prominentsibilants produced a short skip (white space) in the facsimile copyfor each "s" sound, and during pauses in sound programs the facsimilecould be heard in the background.If the receiver was not precisely tuned, little increase in interferencewith facsimile was apparent, but the facsimile backgroundbecame markedly evident in the sound reproduction.During the progress of the test one practical operating factor wasnoticed that illustrated the interdependence of sound and facsimile induplex transmission.<strong>The</strong>re was a tendency for unwarned individualsto tune to a different sound program for check purposes while receivingfacsimile. This caused the facsimile to drop out of synchronism whichinchhad to be regained upon returning to W2XWG, so that about y±of copy was lost for even momentary tuning to a different station.7. Conclusions<strong>The</strong> laboratory and field tests indicated that the frequency-shiftfacsimile method was capable of producing good copy and could be
DUPLEX SOUND AND FACSIMILE 409synchronized by a simultaneous amplitude modulation of the picturefrequency modulation. This resultant signal could also be used tofrequency-modulate a transmitter at the same time as a sound programto give duplex transmission. <strong>The</strong> required spectrum space forduplex operation is greatest for very low modulating frequencies, andfor such frequencies, is likely to exceed the channel width.<strong>The</strong> test indicated several practical difficulties which may be expectedin duplex sound and facsimile operation.1. Necessity for adequate filtering to separate signals beforepassing through any audio amplifier.This could be done on receiversdesigned for duplex operation, but would be necessary on all f-mreceivers whether designed for facsimile reproduction or not, if crossmodulation of the sound by the facsimile is to be avoided.Thus, receiversdesigned for sound reproduction only would require design provisionsnot now needed.2. Necessity for continuous uninterrupted reception of an undesiredsound program to obtain a desired facsimile program and viceversa.3. Necessity for tuning accuracy beyond the capabilities of theaverage user for acceptable freedom from cross-talk.4. Necessity for unusually high degree of oscillator frequencystability to maintain this tuning accuracy.5. Necessity for unusually high degree of linearity in any circuitcarrying both sound and facsimile signals.<strong>The</strong>se considerations result in the opinion that duplex operation off-m sound and f-m facsimile is technically possible, but has certaindifficulties both technical and commercial which would appear to makeitundesirable.<strong>The</strong> two services have too many conflicting requirements in receiverdesignand sale,in program design and in user's desire to change one,but not the other, to be tied together thus intimately. It would appearmore desirable to operate with independent modulation of sound andfacsimile on a time division basis,the facsimile being transmitted ata period when the station is not in use for sound transmission.<strong>The</strong> authors are indebted to W. A. R. Brown and T. J. Buzalski ofthe National Broadcasting Company for furnishing and operating thetransmitter facilities for the field tests, and to W. L. Carlson, V. D.Landon, and H. Kihn of the RCA Manufacturing Company for a partof the laboratory tests described. Credit is also due J. A. Rankin ofthe RCA License Laboratories for able assistance in the field andlaboratory tests, and to M. G. Crosby of R.C.A. Communications forhis helpful discussions of the theoretical aspects of the problem.
USE OF SUBCARRIER FREQUENCY MODULATIONIN COMMUNICATION SYSTEMS*!ByWarren H. Bliss!RCA Communications, Inc., Terminal Facilities Research Group,<strong>New</strong> York, N. Y.Summary— When subcarrier frequency modulation having a frequencyrange of 1600 to 2000 cycles was used for transoceanic facsimile transmission,pictures were obtained with finer detail and better half-tone qualitythan those transmitted by previous systems; the speed of transmission couldalso be increased. An extension of the system to a two-way multiplechannelradio-relay circuit providing teletype service between <strong>New</strong> Yorkand Philadelphia gave improved stability of operation when variations insignal strength occurred.GeneralA S THE art of frequency modulation has developed, ithas natu-/=\ rally produced many by-products and has found applicationsA- -^- and uses not at first apparent to radio engineers. One of theseis in the field of point-to-point communication where an applicationknown as subcarrier frequency modulation has been investigated andfound to have important advantages. When a subcarrier wave is frequency-modulatedby signal material and is then used to modulate aprimary carrier, the system is referred to as subcarrier frequencymodulation.Two applications of subcarrier frequency modulation which arehighly successful or show definite promise are (a) the transmission offacsimile material over long radio circuits and (b) the transmissionof telegraph characters (printer-type signals in particular) over shortwaveradio-relay circuits. <strong>The</strong> former has been used by RCA Communications,Inc., for over two years with results far surpassing thoseof any other method. 1Experimental tests recently conducted with thelatter prove there is a definite advantage in stabilizing teletype signallevels when the different tones from multiple-channel operation arecombined together tofrequency modulate a common subcarrier wave.In both of these cases the major advantage is due to the great reduction* Decimal Classification : R581 X R630.f Reprinted from Proc. I.R.E., August, 1943.| Now with the Research Department, RCA Laboratories Division,Princeton, N. J.1R. E. Mathes and J. N. Whitaker, "<strong>Radio</strong> Facsimile by SubcarrierFrequency Modulation", RGA REVIEW, Vol. 4, pp. 131-154; October, 1939.410
SUBCARRIER IN COMMUNICATIONS 411in signal-amplitude variation rather than to any increase in signal-tonoiseratio resulting from the frequency-modulation method.<strong>Radio</strong>photo PracticeAll facsimile systems use a scanning device at the sending terminalfor converting graphic material intovoltage.a variable amplitude current orIn the subcarrier-frequency-modulation process this variablequantity representing the point-by-point density of the copy is used toswing or shift a subcarrier tone over a definite predetermined range.This constant-amplitude, frequency-modulated tone is then sent out bymeans of a standard amplitude-modulation radiotelephone transmitter.At the distant terminal all amplitude variations resulting from fadingand multipath effects are removed by means of a limiter, and a simplefrequency-discriminator circuit converts the received signals back tothe conventional varying amplitude wave. <strong>The</strong> copy is then recordedphotographically, or by other means.Since May, 1939, when subcarrier frequency modulation firstwentinto public service between London and <strong>New</strong> York, additional terminalsof this type have been put into commercial use.Berlin did and BuenosAires does provide this service now and just recently transmittingfacilities have been put into operation in Moscow.Figure 1 shows oneof the first photographs sent by radio from Moscow over a 5000-milecircuit.<strong>The</strong> two outstanding advantages of subcarrier frequency modulationover dot-pattern and other systems are better quality of receivedcopy and increased speed. Much finer picture detail can be reproducedand contrast in the darker half tones is better. Eight- and ten-pointtype are now transmitted successfully whereas fourteen-point type formerlywas the lower limit in size. Streaks and irregularities due tonoise are not so noticeable in the radiophotos.Because of this betterquality and freedom from a screen, the radio pictures can be handledthe same as conventional photographs by publishers. An eight- by teninchpicture can be transmitter in twenty minutes under radio-circuitconditions which three years ago would require a period of one hour.Improved operating technique and advancements in radio communicationindicate that the speed may be increased still more.<strong>The</strong> primary reason for this great improvement is due to the factthat subcarrier frequency modulation offers the equivalent of a linearamplitude-variation system which functions independently of signallevelfluctuations caused by fading and multipath phenomena whichalways occur on long-distance radio circuits.Since the picture intelligenceis conveyed by frequency modulation of the subcarrier tone,
412 FREQUENCY MODULATION, Volume Ivariations in amplitude can be completely removed by means of a limitingdevice. Since changes in amplitude as great as 70 decibels can beeliminated, signal fading can have very little influence on the reproducedcopy. Only rarely does the signal drop below the usable level.Although frequency modulation is capable of giving a definite gainin signal-to-noise ratio, this advantage increases with increasing deviationratio. In the present picture-transmission system this advantageis not fully used because a comparatively low deviation is utilized;actually, the bandwidth is no greater than that for amplitude modulation.Some time ago a series of tests was made in one of the research* •T-Fig. 1—One of the first test radiophotos sent from Moscow to<strong>New</strong> York, via RCA Communications, Inc.laboratories of RCA Communications, Inc., to determine the bandwidthrequirement for picture transmission by subcarrier frequencymodulation.Various depths of modulation and bandwidths were triedand oscillograms and transmitted copy were compared and elosely examined.<strong>The</strong> comparative importance of various sideband components wasalso investigated.<strong>The</strong> results proved that if the index of modulation m, which is theratio of frequency deviation of the carrier to the modulating frequency,
SUBCARR1ER IN COMMUNICATIONS 413did not exceed 0.47 for the highest important frequency fm from thepicture material, then the total bandwidth needed is equal to 2 fm.Thisrange (fc — fm ) to (fc + fm ) , where fc is the carrier frequency, is thesame as that for amplitude modulation and reproduces good copy. <strong>The</strong>highest important frequency fm is determined by the speed of scanningand by the "definition" of the graphic material to be reproducedaccording to the I.R.E. standard method. With this bandwidth of 2/monly the first-order sidebands of fm are transmitted, the higher-ordersidebands being sufficiently unimportant to be neglected.Under this condition of bandwidth and M = 0.47 for the top importantfrequency, itcan be shown that for any other lower signal frequencyno sideband components having amplitudes greater than 10 percent of that of the unmodulated carrier are lost although the frequencyswing or deviation is held constant. For example, with /„ = 1800 cyclesper second, fm — 600 cycles per second, and m = 0.47, the first-ordersidebands have amplitudes of 15 per cent of that of the unmodulatedcarrier and the second-order sidebands have amplitudes of 2 per cent.<strong>The</strong> former will lie just within the 2fm band width while the latter willbe lost. For a lower signal frequency of 300 cycles per second, mwould be 0.94 for the same deviation and the first-order sidebands havingamplitudes of 42 per cent lie well within the transmission band.<strong>The</strong> second-order sidebands in this case have amplitudes of 10 per centbut they are also inside the 2fm band. Hence no components havingamplitudes greater than 10 per cent are lost. Picture quality is justas good as that obtained with subcarrier amplitude modulation employingthe same bandwidth.Although a subcarrier frequency range 1600 to 2000 cycles has beenused for most of the transoceanic picture traffic,be equally satisfactory.other ranges wouldIt is good practice to have the mid- or carrierfrequencyseveral times the highest signal frequency but good resultscan be obtained with a wide variety of values of frequency swing. Onecommunications system uses the frequency deviation range 2600 to3400 cycles. In a higher-speed, experimental, wire-line test the range7.5 to 10.5 kilocycles gave satisfactory results. From the standpoint ofsuccessful radio transmission the phenomena of selective fading wouldindicate that a comparatively low value of the subcarrier would bedesirable since this would keep the radio-frequency bandwidth relativelynarrow. However, there was no noticeable difference betweenresults with fc— 1800 cycles per second and fc= 3000 cycles per second.Another advantage of subcarrier frequency modulation over the oldconstant-frequency, variable-dot-length method is a more simplified,less critical operating technique. When a picture is to be sent, a band
414 FREQUENCY MODULATION, Volume Ion the transmitting drum containing alternate black and white sectionsis first scanned. <strong>The</strong> scanner and modulator are then adjusted to produce2000 cycles and 1600 cycles for black and white, respectively. Atthe radio transmitter the percentage amplitude modulation is set at thedesired value and this remains constant since there is no amplitudevariation in the subcarrier frequency-modulated picture wave. At thereceiving terminal the recording galvanometer light valve or a similardevice isadjusted to the proper settings for the incoming black-andwhitecontrolled signals. Several pictures may then be transmittedwithout readjustment at either terminal.<strong>The</strong> value and success of the present system of transmitting picturesover long distances by radio is indicated by the large number ofsuch pictures which appear in our newspapers. <strong>The</strong> quality of thetransmitted photos isfrequently so good that they are indistinguishablefrom the regular news pictures.A means for partially overcoming some of the effectsof selectivefading has been outlined. 1 This consisted in using the second harmonicof the subcarrier frequency which was developed in the receivers whenthe radio-frequency carrier completely dropped out. <strong>The</strong> harmonicwave which also contains the picture modulation was switched into usewhenever the level of the normal frequencies fell below the usable point.Telegraph Channeling with SubcarrierFrequency ModulationFor several years there has been in operation between <strong>New</strong> Yorkand Philadelphia a two-way, multiple-channel, telegraph radio-relaycircuit consisting of three links. 2 <strong>The</strong>re are eight narrow-band, voicefrequency,teletype channels and also some wide-band, higher-frequencychannels for facsimile. Each teletype channel is 100 cycles wide andthe channels are spaced 170 cycles apart beginning with 425 cycles forthe lowest frequency. <strong>The</strong> signal of each channel consists of its frequencykeyed on and off according to the message material and theoutputs of all eight channels are combined directly together throughfilters. <strong>The</strong> composite signal is then used to amplitude modulate theradio-frequency carrier, but in order to prevent overmodulation frompeaks due to random combination the signal levels in the individualchannels must be kept comparatively low.Although this system has been successful in operation, difficulty isexperienced from time to time because in this system of operation theteletype printers in narrow-band channels are sensitive to variations8 J. Ernest Smith, Fred H. Kroger, and R. W. George, "PracticalApplication of an Ultra-High-Frequency <strong>Radio</strong>-relay Circuit", Proc. I.R.E.,Vol. 26, pp. 1311-1327, November, 1938.
Iis»sIj| /9SS]'SUBCARRIER IN COMMUNICATIONS 415in incoming signal level. This requires a very careful adjustment oflevels at both terminals and at the relay points. If for any reason thereis a signal-level variation of a few decibels, then printer failures occur.Because of the great success of subcarrier frequency modulation inpicture transmission, it seemed reasonable to expect an improvement ifit were applied to subcarrier telegraph operation. Tests were accordinglymade and a marked improvement was noted. Figure 2 is a blockdiagram showing how a subcarrier frequency-modulation unit was usedbetween the group of outgoing channels and the radio-frequency transmitterand a combined limiter and frequency discriminator were includedbetween the receiver and^^incoming channeling niters. By directcomparison it was found that where a 4-decibel drop in equivalentS9Sh;PHiLAHlLPHIAT£P.WMALTRANSM/TTER93S//OS1 /S7SSCfMmodulatorlowF/LTfASZOO'-H/GNFILT£ftt2.S KCLOWFtLTCRf*CSJ&/i.£ *X/J.S/CCH/GHFiLT£RFig. 2—Diagram of test circuit showing subcarrier frequency modulationapplied to multichannel teletype operation.signal level caused failure in the amplitude-modulation method, a 22-decibel drop was required to cause failure when subcarrier frequencymodulation was used.This shows an appreciable advantage.In both cases the signal-to-noise ratio was of secondary importance.<strong>The</strong> advantageous gain in allowable signal-level fluctuation beforeprinter dropouts occur is due primarily to elimination of most of theeffect of this fluctuation before it gets to the actual printer machine.As in the case of pictures, amplitude variations encountered in transmissionare reduced to nil by the limiter device included at the receivingterminal.
416 FREQUENCY MODULATION, Volume IAnother suggested means for overcoming the variation in signallevel in the present telegraph channeling system is the use of automaticvolume control in each channel. However, the use of subcarrier frequencymodulation is preferable because of its inherent nature of conveyingintelligence irrespective of amplitude fluctuations.Still another means of accomplishing the same desired result isuse subcarrier frequency modulation in each of the individual channels.This, in reality, would be a case of frequency-shift keying.Although it provides for satisfactory operation, frequency-shift keyersand limiters and discriminators are needed for each channel.If either amplitude or frequency modulation of a subcarrier is used,the matter of a low ratio of subcarrier frequency to maximum signalfrequency is of importance. If this subcarrier is to modulate a higherfrequencyprimary carrier it is desirable to use as low a value of subcarrieras possible so as to conserve bandwidth or to use a given bandwidthmost efficiently. Results for the subcarrier amplitude-modulationto°"-f—vMJ£/-vw-f-vJ2£g£/r—fB +'Hr-'
SUBCARRIER IN COMMUNICATIONSAllfilter, with coils having a comparatively low value of Q.<strong>The</strong> frequencyresponse is given by curve A of Figure 4 and shows discriminationsuch as that used in the radiophoto terminal equipment. <strong>The</strong> range oflinearity of this filter unit was not as great as desired for anotherapplication so two sections of a resistance-capacitance-type low-passfilter, having the characteristic of curve B, were added. Isolatingvacuum tubes are used for coupling and impedance matching. Curve Cshows the over-all frequency response of the complete unit which hasan exceedingly wide range of linearity.Such a characteristic isnecessary when the ratio of subcarrier tosignal frequency is low, but in some of the applications of subcarrierfrequency modulation, this mode of operation is highly advantageousin the conservation of frequency bandwidth. An actual saving is made2 3 + S 6 7PROPORTIONAL TC FRCQUENCYPig. 4—Frequency-response curves of wide-range frequency discriminator.because if a high value of subcarrier is used in the modulation of ahigher primary carrier then there will be a "waste" space of frequenciesbetween the primary carrier and its nearest sidebands.ConclusionsIn summing up the results and observations with subcarrier frequencymodulation, the outstanding advantage of this system in pointto-pointcommunications is in overcoming the ill effects of unwantedamplitude variations which are always present to some extent in alltransmission circuits. In any system in which the intelligence is conveyedby amplitude variation, any noise wave introduced into the path
418 FREQUENCY MODULATION, Volume Iof transmission will add directly to the signal and produce distortion,masking, or other undesirable effects. In frequency modulation, allamplitude irregularities are removed by limiting or clipping. <strong>The</strong>inherent gain in signal-to-noise ratio obtained with this type of modulationis also utilized to an extent although the index of modulationis usually less than unity. In general the same advantages of frequencymodulation are obtained in subcarrier frequency modulation asin the more common applicationa radio-frequency carrier.of straight frequency modulation of
THE TRANSMISSION OF A FREQUENCY-MODULATED WAVE THROUGHA NETWORKSByWalter J. FrantzResearch Department, RCA Laboratories Division,Princeton, N. J.Summary— A practical method for calculating the effect of a fourterminalnetwork upon a frequency-modulated wave being transmittedthrough it is developed and demonstrated. <strong>The</strong> form of the solution is simpleenough to be applied by anyone familiar with electric circuits. No knowledgeof calculus or higher mathematics is required; nor is the solution restrictedin any way, being equally accurate and practical for large and small valuesof modulation index, and for any physical network.In order to determine whether or not a particlular network probleminvolving a frequency-modulated input wave may be analyzed from the"instantaneous frequency" viewpoint, a test, or validity condition, has beendeveloped. This test quickly classifies the problem either as one for whichonly a complete, straightforward analysis determines the response, or as onefor which a quasi-steady state exists. <strong>The</strong> quasi-steady state is a conditionunder which the amplitude— instantaneous-input-frequency envelope andthe phase-shift— instantaneous-input-frequency envelope of the output wai>eapproach closely enough to the steady-state-amplification— frequency andphase-shift— frequency characteristics of the network.WITHIntroductionTHE increasing use of a frequency-modulated wave forcircuit alignment and test, spectrum analysis, altitude ortime-delay measurement, and the transmission of intelligence,there arises the need for a practical and dependable method ofcalculating the response of a network to a frequency-modulated inputwave.Suppose that it is desired to picture accurately the steady-stateamplification—frequency characteristic of a tuned one-megacycle amplifierwith an effective Q of tOO. <strong>The</strong> layout of Figure 1 is often usedfor visual circuit test and alignment in the communications industry.Since the modulating voltage is applied also to the horizontal plates ofthe oscilloscope, the horizontal axis is linear in instantaneous frequencyof the input frequency-modulated wave. In Figure 2, (a) is the oscillogramobtained when the frequency-modulated signal generator is oper-* Decimal classification : R630.f Reprinted from Proc. I.R.E., March, 1946.419
i420 FREQUENCY MODULATION, Volume 1ir3UBS£C r"1 /v
:TRANSMISSION THROUGH A NETWORK 421ating at a center frequency of one megacycle, a total sweep width of 50kilocycles, and a modulating frequency of 100 cycles per second; theamplification— -frequency characteristic of the amplifier has been fairlywell pictured. If the modulating frequency is increased to 1000 cyclesper second, the pattern (b) departs considerably from the steady-stateamplification—frequency characteristic of the network. <strong>The</strong> two tracesare the frequency upsweep and the downsweep. <strong>The</strong> upsweep traceleans to the right and the downsweep trace leans to the left.In Figure2, (c) is the oscillogram obtained for a total sweep width of 150 kilocyclesand a modulating frequency of 333 cycles per second, whileis the oscillogram obtained for a total sweep width of 150 kilocyclesand a modulating frequency of 1000 cycles per second.<strong>The</strong>se oscillograms will be referred to quantitatively later in thearticle. <strong>The</strong>y are presented here only to persuade those unfamiliarwith the problem that it is real, important, and frequently encountered.<strong>The</strong> problem is probably given the most attention by the designers ofhigh-quality frequency-modulated transmitters and receivers.It is the purpose of this paper to devise a simple test by which onemay determine whether or not the effects of a network upon a frequency-modulatedwave being transmitted through it differ appreciablyfrom the steady-state amplification—frequency and phase-shift—frequencycharacteristics of the network, and, if so, to offer a general andpractical method of calculating these effects as a function of eithertime or instantaneous input frequency.(d)<strong>The</strong> Response-Envelope Equation<strong>The</strong> following procedure is a rigorous and general method of obtainingthe output-voltage envelope for a network driven by a frequencymodulatedwave1. Measure or calculate the steady-state amplification—frequencyand phase-shift—frequency characteristics of the network in question.2. Express the frequency-modulated input wave in terms of itssteady-state spectrum of sinusoidal side frequencies.3. Pass the individual side frequencies through the network, alteringthe amplitude and phase of each according to the steady-stateamplification and phase characteristics of the network at the particularfrequency of the side frequency.4. Plot the sum of the altered side frequencies point by point toobtain the output wave as a function of time.5. Draw a smooth curve through the carrier-voltage peaks to obtainthe response envelope of the output voltage.Such a procedure, however, is not a solution to the frequency-
422 FREQUENCY MODULATION, Volume Imodulated transmission problem. <strong>The</strong> method is rigorous and general,but not practical. Calculating the response pattern of (a) in Figure 2by the method just outlined, for example, would require the labor ofa staff of clerks for several years, because it would be necessary to calculateabout 100,000 points for a smooth curve of the radio-frequencyvoltage oscillations during one modulation cycle, each point being thesum of the instantaneous values of more than 500 side-frequencyvoltages.It is fortunate that the operations outlined by steps 2, S, 4, and 5can be done analytically, initiating a practical equation for the outputor response-voltage envelope in terms of the network parameters andthe frequency-modulated input-wave parameters. This equation will bederived with time as the independent variable and transformed to afunction of instantaneous input frequency to correspond with theabscissae of Figure 2. <strong>The</strong> method used in this report for bridgingsteps 2, 3, 4, and 5 is very similar to the pattern followed by Cherryand Eivlin. 1 <strong>The</strong> problem has also been considered by Kulp, who developeda solution which is practical when the modulation index of thefrequency-modulated input wave is small. 2First a unit frequency-modulated wave is defined. <strong>The</strong> equationsderived in this paper are based upon unit magnitude of the inputsignal.o) = 2tt X the center frequency (1)K = 2tt X the frequency deviation (2)v = 2tt X the modulating frequency (3)Km f= — = the modulation index (4)vS, = wq + K cos vt = 2-7T X the instantaneous input frequency. (5)It has been shown that 3e ln= sin (a t + m t sin vt)1E. C. Cherry and R. S. Rivlin, "Nonlinear Distortion, with ParticularReference to the <strong>The</strong>ory of Frequency-modulated Waves," Part II, Phil.Mag., vol. 33, pp. 272-293 ; April, 1942.2M. Kulp, "Spektra und Klirrfaktoren Frequenz- und AmplitudenmodulierterSchwingungen," Part II, Elek. Nach. Tech., vol. 19, pp. 96-109; June,1942.8John R. Carson, "Notes on the <strong>The</strong>ory of Modulation," Proc. I.R.E.,vol. 10, pp. 57-64; February, 1922.
.TRANSMISSION THROUGH A NETWORK 423= / (lUf) sin o> t+002 ( J -2ni ('»/) (sin |« + (2n— 1) vl £— sin [o> — (2m — 1) v] £}+ J 2n (mf) {sin [a) + 2nv~\ t + sin [u — 2m; ] £})(6)<strong>The</strong> series (6) is absolutely convergent, allowing the convenience of apartial summation with any desired accuracy.e in*» / (m f ) sin o— (2w — 1) v] £}+ J 2 » (m f) {sin [
.424 FREQUENCY MODULATION, Volume I<strong>The</strong> /(«>) is a dimensionless transfer-voltage ratio. If 7 0utwereused instead of E ont , f (u>) would be the transfer admittance.<strong>The</strong> next step is to approximate /(«) by a finite Fourier seriesabout a)in a period O equal to or greater than the interval containingthe side-frequency voltage of (7). From (7) it is obvious that thisinterval extends from O — 2Nv) to (co + 2Nv) , a total width of 4Nv.M/() « 2 (A m cos»n=0'2irmSI(&) — u> )+ B m sin'2-77-mn(ft) — o) )(11)<strong>The</strong> notation «=> used in (11) means "approximately equals only inthe interval (w — 2Nv) g»g (o> + 2Nv) ." It is sufficient that thepartial sum represent the function only in the interval (o> 2— 2Nv) Sito Si ()<strong>The</strong> reason for expressing /(
:jTRANSMISSION THROUGH A NETWORK 4251nrico -42/2/ (ft)) &ft)(12)A,„>o=— / /() cos"27TWIO(ft) — ) sin27rmO(ft) —
.426 FREQUENCY MODULATION, Volume I-AnU) =cos [~VK2 (& -
:2TRANSMISSION THROUGH A NETWORK 427—frequency characteristics of the network. At any instant of timethe frequency-modulated output wave deviates from the frequencymodulatedinput wave in amplitude and phase in a manner no differentfrom that of a steady-state output wave whose constant frequency isequal to the instantaneous frequency of the frequency-modulated wave.Letting the quasi-steady-state response envelope E 0UJ(&) approach/(to), equation (11),whereME mitlU) -»/(») ~ 2 (A m cos f „,* + B m sin ^)^m U)2-RmQU(21)0) — (0 ).(20)Equation (20) is equivalent to (15) if D m —>1 and \[/„— >$m % . <strong>The</strong> discrepancybetween the angles ^m and xj/^ is given by2-n-m 5> — o> 2-n-mvV^m 1 — i>m ?= U —
428 FREQUENCY MODULATION, Volume Ij V-K 2 — (5 —
.TRANSMISSION THROUGH A NETWORK 429creating extrinsic discontinuities at the ends of the period of theapproximation will be discussed in the example in the next section.Thirdly, the phase displacement of this Mth term of the approximationis investigated by (27). A quasi-steady state is assumed toexist if the discrepancy is less than one third radian or about 20degrees. This sort of procedure is quite similar to common videofrequency-amplifierdesign practice. Amplifiers for non-sinusoidalwaves are commonly designed to be down less than three decibels, thatis, to have less than 45 degrees phase shift, at the frequency of thelast significant harmonic of the signal to be amplified. That designcriterion is somewhat less conservative than the allowable 20 degreesphase shift assumed here for the last significant harmonic of thenetwork characteristic.<strong>The</strong> procedure outlined above is, of course, not foolproof. It iscertainly feasible to imagine a Fourier approximation of functionsfor which the above procedure would not insure the desired fidelityof the output envelope. Such functions, however, are seldom, if ever,encountered in physical networks.Step-by-Step Procedure for Testing the Validity of the"Instantaneous-Frequency" Method of Analysis<strong>The</strong> steps necessary for determining whether or not a quasi-steadystate exists are organized and demonstrated in this section. <strong>The</strong> testis applied to the problems which, when tried experimentally, yielded(a) and (b) in Figure 2.A. Investigate the spectrum of the frequency-modulated waveapplied to the network, deciding how wide a frequency band need beconsidered in order to include all the non-negligible side frequenciesof the wave.Example:<strong>The</strong> frequency-modulated wave applied to a tuned amplifierto produce (b) in Figure 2 experimentally is described by thefollowing parameters, which are repeated here for convenience:o) = 2tt X 10 6 (2-rr X the center frequency)K = 2tt X 25,000 (2tt X the frequency deviation)v = 2tt X 1000Km f= — = 25v(2tt X the modulating frequency)(the modulation index)<strong>The</strong> steady-state spectrum of the frequency-modulated wave is given
430 FREQUENCY MODULATION, Volume Iby (6). <strong>The</strong> Bessel amplitude coefficients J n (m f) of the side frequenciesare as follows: 6Jo (25) =J 1 (25) =J 2 (25) =J 3 (25) =J t (25) =J ā (25) =J e (25) =J 7 (25) =/ 8 (25) =/ 9 (25) =/ 10 (25) =Ai(25) =/ 12 (25) =Jib (25) =Ju(25) =Ju (25) =J 16 (25) =At (25) =J 18 (25) =J 19 (25) =/20 (25) =0.0963-0.1254-0.10630.10830.1323-0.0660-0.1587-0.01020.15300.1081-0.0752-0.1682-0.07290.09830.17510.0978-0.0577-0.1717-0.1758-0.08140.0520J 2i (25)^22 (25)^28 (25)J 24 (25)/ 2B (25)^26 (25)J 2i (25)/ 28 (25)^20 (25)^80 (25)^si (25)/ 32 (25)^33 (25)^34 (25)^85 (25)/ 36 (25)^37 (25)^38 (25)^39 (25)/w (25)/«(25): 0.1646: 0.2246: 0.2306: 0.1998= 0.1529: 0.1061:0.06778: 0.04028:0.02245: 0.01181:0.005889: 0.002795: 0.001267: 0.000550: 0.000229:0.000092: 0.000036: 0.000013: 0.000005: 0.000002:0.000001<strong>The</strong> amplitudes of the side frequencies are certainly negligible beyondthe 35th side frequency for any practical application. <strong>The</strong>refore, theinterval 2rr X 0.965 X 10 6 g «i g 2ir X 1.035 X 10 6 contains all the nonnegligibleside frequencies.B. Measure or calculate the steady-state complex-network characteristic/(»).Example: <strong>The</strong> amplification—frequency and phase-shift—frequencycharacteristics of a network can be measured. <strong>The</strong> real part of f{u>)isthen obtained by multiplying the amplification by the cosine of thephase-shift angle. <strong>The</strong> imaginary part of /(») is obtained by multiplyingthe amplification by the sine of the phase-shift angle.For several networks, however, it is practical to calculate the networkcharacteristic from its circuit. Figure 3 is the simplifiedschematic of a tuned amplifier, for whichX L = — X = jX at a> (28)6Eugene Jahnke and Fritz Emde, "TABLE OF FUNCTIONS WITHFORMULAE AND CURVES," Dover Publications, <strong>New</strong> York, N. Y., 1943,p. 179.
=:-»TRANSMISSION THROUGH A NETWORKp =11 XQ L R„power factor of plate circuit431(29)9 m"-/.(30)Z--1V 1— +j-X j-XFig. 3—Simplified schematic of a tuned amplifier.O) 0)a(D 2 0)2P 2 +
432 FREQUENCY MODULATION, Volume 1
.TRANSMISSION THROUGH A NETWORK 433and imaginary parts is the amplification—frequency characteristic<strong>The</strong> arc tangent of the quotient of the imaginary and real parts offM/gmX is the phase-shift—frequency characteristic (d).C. Approximate the network characteristic by a finite Fourierseries over an interval equal to or greater than the essential(c)intervaldetermined in step A.Example : Unless the network-characteristic function and its derivatives at one end point of the essential interval chosen in step A happento be equal to the function and its derivatives, respectively, at theopposite end point of the interval, it is necessary to take the followingsteps to avoid extrinsic discontinuities which would needlessly burdenand reduce the accuracy of the Fourier approximation. First, theperiod for the Fourier approximation should be chosen slightly largerthan the interval over which the approximation must accurately representthe network characteristic.Second, the function should be alteredin the two margins where the chosen period overlaps the essentialinterval of approximation in such a way that the new function has nodiscontinuities either within the chosen period or at its end points.<strong>The</strong> artificial function constructed within the margins should be -assmooth as possible to avoid its contributing to the higher-order termsof the Fourier approximation.Recall that the essential interval of approximation was 2tt X 0.965X 10 6 g w ^ 2tt X 1.035 X 10 e ; let CI, the period of approximation, beslightly greater, say, 2tt X 0.960 X 10 G § «) ^ 2tt X 1.040 X 10 6 . <strong>The</strong>nconstruct an artificial function in the margins of overlap of theintervals (2tt X 0.960 X 10 6 g o> s 2tt X 0.965 X 10 6 and 2-n X 1.035X 10 e ^ a ^ 2tt X 1.040 X 10 6 ) that smoothly joins the ends of theperiod. This artificial function has been dotted into (b) of Figure 4.In Figure 4, (a) is so nearly continuous at the end points that no alterationis necessary. <strong>The</strong> essential interval of approximation and theperiod of approximation are also indicated-A 24-point numerical analysis 4 of this improved function in the indicatedperiod yields its Fourier coefficients. When using numericalmethods to obtain these coefficients, one must be careful that the signsof the coefficients are correct to place the approximation above o> asrequired by (11).^0
434 FREQUENCY MODULATION, Volume Ifil
•.—TRANSMISSION THROUGH A NETWORK 435/),., - 1 ~2tt X 25,000 X 2tt X 100 / 2tt X 6 \ 22tt X 80,000~ 0.28 radian or 16 degrees.Since the phase discrepancy for this Mth term is less than 20 degrees,a quasi-steady state (such as postulated) may be assumed to exist. InFigure 2, (a) bears out this conclusion nicely; the discrepancy between(a) and the static-network response characteristic is obviously everywhereless than 15 per cent of the peak.Step-by-Step Procedure for Calculating the Kesponse of aNetwork to a Frequency-Modulated Wave<strong>The</strong> necessary steps for evaluating (15) as a function of either tor S> are organized and demonstrated in this section. <strong>The</strong> amplitudeinstantaneous-input-frequency response and phase-shift—instantaneous-input-frequencyresponse of a tuned amplifier will be calculatedusing the same parameters that were used experimentally to obtain(b) of Figure 2.I. Perform steps A, B, and C of the validity-test procedure.II (w). Prepare work sheets similar to Table I for several equallyspaced values of (S> —
436 FREQUENCY MODULATION, Volume Isheet; the value assigned to Table I is («5 —
TRANSMISSION THROUGH A NETWORK 437V (t) .Into column V enter the value ofK2Trmv57.3 X — cos vt sin degrees.v Q,V. Enter the A m's obtained in step C into column VI.Example: From step C, A 2= 17.8 + jO. This column is the samefor all the work sheets.VII. Multiply the A m's, column VI, by the cosine of the angle in columnV and enter the result into column VII.Example: For m = 2,(17.8 +j'0) cos 53.8 degrees = 10.5 + jO.VIII. Multiply column VII by the cosine of the angle in column IV andenter the result into column VIII.Example : For m = 2,(10.5 + y0) cos 17.1 degrees = 10.0 + jO.IX. Multiply column VII by j sine of the angle in column IV and enterthe result into column IX.Example: For m — 2,j (10.5 + y0) sin 17.1 degrees = + /3.1.X. Enter the B m 's obtained in step C into column X.Example : From step C, B 2= — yi4.3. This column is the samefor all the work sheets.XL Multiply the B m's, column X, by the sine of the angle in column Vand enter the result into column XI.Example: For m = 2,(0 - yi4.3) sin 53.8 degrees = - ill.5.XII. Multiply column XI by the cosine of the angle in column IV andenter the result into column XII.Example: Form = 2,(0 — j'11.5) cos 17.1 degrees = — j'11.1.
.438 FREQUENCY MODULATION, Volume IXIII. Multiply column XI by j sine of the angle in column IV andenter the result into column XIII.Example : For m = 2,j (0 - yil.5) sin 17.1 degrees = 3.4 + j?0.XIV. Total columns VIII, IX, XII, and XIII on each work sheet. (SeeTable I.)XV. Calculate the following quantities for each work sheet and expressthe result in polar form.Q = VIII + IX + XII + XIIIR = VIII - IX + XII - XIIIS = VIII + IX - XII - XIIIT = VIII - IX - XII + XIIIwhere VIII, IX, XII, and XIII are the totals obtained in step XIV.(See Table I.)XVI (5) . For each of the work sheets prepared for different assignedvalues of (£ — q> ), plot on the response graphs,Q = the upsweep response at
TRANSMISSION THROUGH A NETWORK439T = 89.5/22.8 degrees = the downsweep response at& = 2tt X 0.994 X 10 6Plotting the points obtained on work sheets for (5 — m ) = 2-n X 2000,2tt X 4000, 2tt X 6000, • • • , 2tt X 24,000 determines curves (a) and (b)
440 FREQUENCY MODULATION, Volume I5, the calculated amplitude—instantaneous-input-frequency response,agrees very closely with (b) of Figure 2, the experimental amplitude—instantaneous-input-frequency response. <strong>The</strong> reader may be interestedin comparing the results of the calculation with the resultsobtained by Roder on a very similar problem, which he solved by theaid of a differential analyzer. His response curve was plotted as afunction of time. 7XVI (t) . For each of the work sheets prepared for different assignedvalues of vt, plot on the response graphs.Q = the response at 2-n- — vtR = the response at vtS = the response at -n-+ vtT = the response at it — vt.<strong>The</strong> magnitudes of Q, R, S, and T for each work sheet give four pointson the desired amplitude—time response curve. <strong>The</strong> phases of Q, R,S, and T give four points on the desired phase-shift—time-responsecurve.AppendixIf a steady-state driving voltage e' at is applied to the input terminalsof a linear network, it can be shown that the steady-state solutionfor the voltage at the output terminals 8 is of the form -R(m)£ j[o)H-0] # r ( ra ) is the ratio of the peak amplitudes of the output andinput voltages, and 6(a>) is the phase difference. Abbreviating e^ (as E lv+ and R(a>) e K*+ei°>n as E mt +, it follows thatE oat +=E ln+RM *M«K (34)Furthermore, if a steady-state driving voltage £-*>* is applied to theinput terminals of the same linear network, itcan be shown that thevoltage at the output terminals is of the form R (-whereR and 6 are equal to R and of (34). Setting e~> at as E in~ andRM £ -;[«*+«.(35)7Hans Roder, "Effects of Tuned Circuits upon a Frequency-modulatedSignal," Proc. I.R.E., vol. 25, pp. 1617-1648; December, 1937.«H. Pender and S. Warren, ELECTRIC CIRCUITS AND FIELDS,McGraw-Hill Book Company, <strong>New</strong> York, N. Y., 1943, pp. 161-163.
j/(«,)!=.TRANSMISSION THROUGH A NETWORK 441<strong>The</strong>refore, if a steady-state driving voltage sin mt is applied to theinput terminals of the network, the output voltage can be determinedas follows:e /w£ — £ jutE in= sin o,t =•2j(36)By (34) and (35),.E oat= = R( a ) sin M + (*>)]. (37)2/R(oy) e^ (co) is now denned as the complex network characteristic,/(«). It can be seen from (36) and (37) thatwhereand where#out { = }#!»/(») (8)amplitude of E mt(9)amplitude of E iaimaginary [/(«>)]arc tan = angular phase [E ont ]real [/(«,)]— angular phase [Sjn] . (10)<strong>The</strong> notation { = } in (8) means "equals by convention," because theright- and left-hand members of the equation are not mathematicallyequivalent except when 8 () (39)where /* (
:.442 FREQUENCY MODULATION, Volume 1Ne in = Jo(m f) sin m t + 2 (^2n-i (*»/) ( sin [o> + (2w — 1) v ] ] £}). (7)Since = *]. (42)I7=—2W<strong>The</strong> steady-state output oscillation corresponding to each steadystateoscillation of the frequency-modulated input spectrum is givenby (38) and (39).andE mt + [for E ta+ = cn%+v»r\ = £JK+^)' /(] = £-/K+9«)* /* (
(wTRANSMISSION THROUGH A NETWORK 443M 2N2 i eout= S 2 Jr, 1 -]) [t +1 i(Ci: ° >v)t(A m cos km,r]v + B m sin km-qv)711=0 -q=— 2N— e-i^+vv) *(Am * cos km-qv + B m* sin km-qv) ].(48)Changing cos km-qv and sin km-qv to exponential form,M 22Vm=0 i?=—22V(V'[(u + + >n'> t kmr/v] _|_ £ i[(u +!)«) *— S:mi7»])+ _i( £ j'r(u + ijti) f ftmiju] £i[(u +))))) f— ftmijv])2/4 *2B *(49)2/<strong>The</strong> Bessel coefficients are combined with the exponentials by the useof the relation,22V2 J v im-f) i" e sin~ tm *>l)=—2Nwhich is accurate because the J n(m ) 'a fbelow -q = — 22V and aboveq — 27V are negligible by the definition of N.M2ie„ut= S ( £i[K„' + mf sin (»f + tfflt)]L 2B.-(- e + /[]) — ( e yt f + »»/ sin (— «* + fcm«)]+ e J 'e i[— w2//[— o) t + m/ sin (£— ^(-fcrnu)] \ (50)
444 FREQUENCY MODULATION, Volume IExpanding sin (vt ± kmv) and factoring the exponentials,2;e out = 2 m—oL 2( € 3(oi t-\-mf sin vt cos kmv)} ( €Jmf cos vt sin fcmv_{_f—jmf cos i)f sin kmv\ J5 W( e jmf cos uf sin ftfflu e—jmf cos i; f sin kmv\2;( €ifw i + m./ sin vt cos fcrnt;)^A *( e —j{u + t mf sin v£ cos fcmv)) ( ejmf cos u£ sin feme_}_ f—jmf cos ?;* sin fcm]?]B *2}( e — -i( sln " t(cos *«»-i' £i— Bm * sin (my cos vt sin tan)£->""" sin w((cos fc"- 1 * £-j
: ;:i=and whereTRANSMISSION THROUGH A NETWORK 445tm (t)K— — cos vt smv2TrmvO(17)It is easy to derive D m {S>) and ^m ( and t.0) + K cos vt (5)cos vt =-(i)— e>oK(54)sin «£ =-±VK ! - U-a. )2K(55)Substituting for sin vt in (16),#,»(«) =cosVK "- 2 2(
..446 FREQUENCY MODULATION, Volume Ithen2je t= £ i
.TRANSMISSION THROUGH A NETWORK 447lem, when the network characteristics are expressed by means of apower series, or by means of a trigonometric series, the reader isreferred to a paper by Block. 2 )In the application of Frantz's methodit is necessary that the network response be expressed as a Fourierseries or, as was also indicated, by other series approximations. However,it is possible to obtain the amplitude and phase of the outputsignal by using point-by-point data from the network response curve;contrary to Frantz's statement, this can be accomplished without plottingthe output r.f. signal point by point as a function of time. <strong>The</strong>additional work of obtaining a series expression, as wellas questionsas to the proper convergence of this expression, are thus avoided.It isbelieved that the method of calculation to be described is, therefore,simpler and more straightforward, and in any event may be of interestas an alternate method of solution.To rephrase the problem: a network having a gain-versus-frequencycharacteristic given by R («)and a phase-versus-frequency characteristicgiven by 0( — v) t]+ J 2 (nif) [sin (w + 2v) t + sin (u> — 2v) t]+ ^3 ( m /) [sin (a> + 3v) t — sin (w — Sv) t~\ -\ .(2)To better visualize the action that is taking place, it is convenientto assume that the frame of reference rotates counterclockwise withan angular frequency u so that the carrier vector J (m f) remains stationary.If this is done, then the vectors with the higher angular fre-2A. Block, "Modulation theory," Jour. I.E.E. (London), Pt. Ill, vol91, pp. 31-42; March, 1944.
448 FREQUENCY MODULATION, Volume Iquencies willrotate counterclockwise with angular frequencies of nv,and the vectors with the lower angular frequencies willrotate clockwisewith the same angular frequencies nv. This is pictured in Figure1 (a) for the case where m f= 1.0 and vt = 30°. It is readily seen fromthis figure (as well as from (2) by subtracting m from each angularfrequency) that the even-order sidebands pair off to give a vector suminphase with the carrier vector and the odd-order sidebands pair offto give a vector sum in phase-quadrature with the carrier vector.Thus it is seen either from Figure 1 (a) or from (2) thatJ„ ( I ) = . 7fc5 (a)e-sJj(i)(b)Fig. 1—Vector summation of (a) input signal, and (b) output signal foran arbitrary network (assuming modulation index = 1.0, vt = 30°).e,„ —lJ (m f ) + 2J 2 (m f ) cos 2vt + 2/ 4 (m / ) cos 4vt +•• •+ [2J 1 (ra r ) sin vt + 2J 3 (m f ) sin 3vt + •] 2 (3)] 2and(3 — phase of e lnwith respect to signal of phase oi t = m fsin vt = arc tan[2/j (m f) sin vt + 2/ 3(m f ) sin 3vt +•••][/ (m / ) + 2J 2 (m f ) cos 2vt + 2J i(m f ) cos 4vt + ]<strong>The</strong> network output voltage is obtained, as indicated by Frantz, bytreating each of the sideband terms as an individual signal and alteringits amplitude by R n (a>) and its phase by 8 n (o>). Thus, the outputvoltage derived from (2)is(4)
_TRANSMISSION THROUGH A NETWORK 449 — v)t + 6>_i}] + J 2 (m>) [R 2 sin {(a> + 2v) t + 9 2 )+ JB_ 2 sin{(a> -2i;)t + fl_ 2 }] +••. (5)If (5) is pictured on the counterclockwise rotating reference frame, itis seen (as indicated in Figure 1(b) for same conditions as 1(a) withhypothetical network characteristics) that{R J (m f ) cos 8 + Jiiwif) [R 1cos (vt + 8 X ) — i2_ xcos (vt — dx ) ]+ J 2 (m t ) [R 2 cos (2vt + 6. 2 ) + #_ 2 cos (v — d_ )'\ 2 H }-+ {R J (m f ) sin 8 + J 1(m f ) [R tsin (vt + 6-s) + R_ tsin (vt — 0^ ]+ J 2 (m f ) [R 2 sin (2v£ + 6 2 )- R_ 2 sin (2vt - 0_ 2 ) ]•+• •Yand(6)jBphase of e out with respect to signal of phase a t = arc tanR J (m f ) sin 6 + J 1(m f ) [R lsm (vt + 6^ +R_ 1sm (vt — 8_ 1 )] -^ 1R J Q(m f) cosd + J 1(m f ) [J^cos (vt + 6-s)— -B_ 1cos (vt — 8_ 1 ) ] +•i„-j(7)Using (6) and (7) the point-by-point amplitude and phase of theoutput voltage as a function of vt can be obtained either by algebraicor graphical calculation. Sufficient terms are retained to give, thedesired accuracy with more terms being necessary when m fis large.If the series indicated in (6) can be summed up analytically, then aclosed analytic expression for the output is possible.If the network-gain characteristic is symmetrical so that R_ n= R n ,and the network phase characteristic is skew symmetrical so thatB_ n= — 6 n (which is the case treated in detail by Frantz) then (6)and (7) simplify to{R J (m f ) + 2R 2J 2(m f) cos (2vt + 6 2 ) + 2RJ 4 (m f) cos (Avt + 4 )+••Y+ {2R 1J 1(m f) sin (vt + 9 X ) + 2R RJ 3(m f) sin (3vt + 3 ) H } 2and (8)/? = arc tan[2R 1 J 1(m f) sin (vt + 6 X ) + 2R ?>J. i(m f) sin (Svt + 6 3 )•+]"R J (m f ) +2R,J.,(m f) cos (2vt + &
eis450 FREQUENCY MODULATION, Volume IIf vt = 180° + y it is seen that|out|the same as for vt = y, andthat /? is negative the value for vt = y, so that for (8) and (9) onlythe region of vt = 6 to vt = lS0° need be investigated. In order tocompare (8) and (9) with similar results by Frantz, one should keepin mind that the phase angle of e out used by Frantz is the phase ofe out with respect to the pase of the FM wave. ThusTable IShown inComputation of Points on CurvesFigure 5 in Article by Frantz 1 for vt = 60°
esineandTRANSMISSION THROUGH A NETWORK 4518 = phase of e outwith respect to the phase of the inputFM wave = /? — m fsin vt. (10)A sample calculation of e out is shown in Table I for v£ = 60° for thesame e iaused by Frantz, and using values of R(u>) and 0(u>), interpolatedfrom curves given by him.It is perhaps worth noting that the complete value of e out is known,since its amplitude is given byjm fsin vt + 9, i.e., e out=|outjout]its phase is o> t + f3or m t +(« i + /?) . In the event one is interestedonly in the frequency distortion caused by transmission througha network (as, for instance, when limiters remove all amplitude variation),the angular frequency distortion term is given by the timederivative of 6 with respect to time.
—PUSH-PULL FREQUENCY MODULATED CIRCUITAND ITS APPLICATION TO VIBRATORY SYSTEMS*!ByAlexis BadmaieffRCA Victor Division, Hollywood, Calif.Summary— <strong>The</strong> purpose of this paper is to describe a new push-pullfrequency modulated circuit in which the push-pull action is accomplishedby varying the resonant frequencies of both the oscillator and the discriminatorin opposite phase relation to each other. Modulation of the oscillatorand discriminator is achieved through the use of 2 capacitors with a commonplate and arranged in a push-pull circuit. Thus, if the common plate is themoving element of a vibratory system, this circuit can be used for measuringvibrations or for monitoring purposes.One of the applications of the push-pull FM circuit is to calibraterecording heads while cutting phonograph records. Using this calibrator,it is possible to measure, without mechanical or inductive coupling, theactual frequency response of the cutting head under normal load, and toobserve the input-output characteristics as well as the amount of distortion.It is also possible to use it for monitoring while recording.1Basic Push-Pull Frequency Modulated CircuitCONSIDERABLE interest isbeing shown in the development offrequency modulated circuits in which the oscillator and thediscriminator are combined in one unit. This type of circuitcan be used to convert mechanical vibrations to electrical voltage variationsand is applicable to measuring instruments, pickup devices, andother forms of transducers. 1 <strong>The</strong> purpose of this paper is to discuss anew type of FM circuit in which the advantages of push-pull action areutilized.In a single-ended FM circuit, 1 when used in conjunction with avery small capacitor as the frequency controlling element, a nonlinearrelation exists between the condenser plates spacing and the frequencywhich the condenser controls. <strong>The</strong> magnitude of nonlinearity dependson the ratio between the spacing of the plates and the amount of variationof that spacing when the plates are vibrated mechanically. Toillustrate, consider an LC circuit, in which one condenser plate ismoved away from the other plate during tuning. Progressively increasedseparation has less effect on the resonant frequency because* Decimal Classification : R148.2 X R621.375.622f Reprinted from Jour. Soc. Mot. Pic. Eng., January, 1946.452
PUSH-PULL CIRCUIT 453the latter varies approximately as the square root of the distance ofseparation.This means that a nonlinear relation between the frequencyand the displacement results in even harmonic distortion. It is wellknown that by combining the voltages from 2 similar nonlinear componentsin any push-pull system, the distortion can be greatly reduced,since the even harmonic components are practically eliminated.POWDERED IRON COREXiffivC J 1-3— T-1 000}-If—r-^Wi
454 FREQUENCY MODULATION, Volume Iment, and to produce the swing in frequency necessary to attain anappreciable amount of output, comparatively large plate area must beused. If, however, the plates are made small in comparison and theirmovement is large (in the order of 30 per cent) to secure a usableoutput, the second harmonic distortion produced is then quite large,and was measured to be about 17 per cent in one instance. This largeamount of second harmonic content is too great to be canceled by thecomplementary nonlinear discriminator curve, except very close to theresonance point, where the range is limited and adjustment iscritical,£.
PUSH-PULL CIRCUIT 455designing a translating device having a minimum mass and thereforecontributing to a minimum mechanical impedance.A typical single-ended FM circuit in its elementary form is illustratedin Figure 1A. A pentode (7^ with its cathode (K), grid (Gi),and screen (G 2 ) is combined with the tuned circuit (L t ) and a variablecondenser (Cj) to form an oscillatory circuit electron-coupled 2 to theplate (P) and electrostatically shielded by grid (G 3 ) (which is normallythe suppressor element of the tube). <strong>The</strong> oscillatory energyfrom the plate is applied to a circuit which consists of another tunedcoil (L 2 ) and condenser (C 2 ). This circuit is slightly off resonanceot£O
456 FREQUENCY MODULATION, Volume ISuppose the circuit just described were again used, but instead ofmodulating the oscillator, the discriminator were modulated by shuntinga variable condenser across the resonant coil (L 2 ). As illustratedin Figure IB, the frequency of the resonant peak of the discriminatorwould move back and forth along the frequency axis. <strong>The</strong> outputvoltage of the discriminator would be identical to that produced inthe case in which the oscillator frequency was modulated. <strong>The</strong>oscillator frequency will stillcover the same part of the discriminatorpeak as before. This is graphically illustrated in Figure 3 in whichtt
.PUSH-PULL CIRCUIT 457the push-pull FM circuit is particularly adapted to the use of 2 capacitorsarranged for push-pull action.<strong>The</strong> combining of 2 frequency modulations is accomplished by employinga small condenser, one side of which is connected across theoscillator coil and the other across the discriminator coil. <strong>The</strong> commoncenter plate is grounded. If the center grounded plate is moved ineither one of 2 directions, the frequency shifts of the oscillator andthe discriminator circuits will be in opposite directions to each other resultingin push-pull action. Such a circuit is shown in Figure 5. In thiscircuit, coil (L x ) and one half of the push-pull condenser (Cj), togetherc 26SF7POWDERED IRON COREUwJ/£?
458 FREQUENCY MODULATION, Volume Iwill not be realized unless the 2 parts of the system are closely balancedwith respect to each other. To realize this, inductances of the coilsmust be alike and the mechanical construction of both sides of the pushpullcapacities must be alike so to give substantially equal capacity,equally varied inopposite phase.<strong>The</strong> balance between the 2 modulated tuned circuits was checked bymodulating the oscillator and the discriminator separately, and notingthe outputs in each case.This was done by substituting an equivalentfixed capacitor for the discriminator side of the push-pull capacitor andwith a constant modulation applied mechanically to the oscillator partof the push-pull capacitor, the output was then noted. When substitutinga fixed condenser of equal value in the oscillator circuit andmodulating the discriminator, the output was found to be of the sameCOPPERPLATES,COMMON—STEEL WIRE—mmVIBRATORY MEMBER^PCROSS-SECTION A-ABAKELITEFig.6—One form of push-pull FM transducer.amplitude as in the case when the oscillator was modulated. In otherwords, both circuits were designed to produce equal output voltagevariations.In each case, however, the exact oscillator center frequency positionon the discriminator curve was noted, and the fixed substituted capacityadjusted so that the position was the same. This is important, sinceif the position were to change, a different amount of diode voltagewould be developed for a given modulation, depending on the slope ofthe discriminator curve in the section used for discrimination. Thisposition was noted by observing a microammeter connected betweenground and the diode load resistor. <strong>The</strong> reading then was highest atthe peak and proportional to the position of the oscillator center frequencyon the discriminator curve. By thus observing the reading, theposition and the side of the discriminator curve can be duplicated ineach case.
—PUSH-PULL CIRCUIT 459Since the output voltage of the 2 sides of a push-pull system areadditive, only half the voltage is required from each side of the systemand, therefore, only half the frequency change to produce it. It is,therefore, evident that the vibratory member is capable of producing alarge voltage amplitude with a relatively small capacity, resulting in avery small unit.2Operation<strong>The</strong> push-pull FM circuit, built and tested, included a push-pullcondenser as its controlling element. This condenser consisted of a50if)
460 FREQUENCY MODULATION, Volume IThis curve is shown in Figure 7. It should be noted that throughoutmost of its length this curve is practically linear. <strong>The</strong> total harmoniccontent represented by the curvature between the two dotted lines,and B, amounts to less than one per cent. <strong>The</strong> curvature above that iscaused by the nonlinearity of the discriminator resonance slope.AWhenthe Q of the discriminator coil is in the order of 200 (which is easy toattain at frequencies of 40 megacycles), and the mechanical vibrationapplied to the tip of the wire is ± 1 mil, the output from the diode
loss and therefore the limiting Q factor.PUSH-PULL CIRCUIT 461K stands for the ratio of theoscillator frequency to the resonant frequency of the discriminator(K = f/fr ) . When the distortion is thus computed, the following tablerepresents the per cent of second harmonic distortion as compared tothe frequency swing, relative gain, and the mean frequency of the pointon the resonance curve against which the carrier issweeping.Second Harmonic in Per Cent ofRelativeK Fundamental, ±45 KC Gain0.98025.328.031.536.041.948.860.077.5123.0144.5156.0160.0180.0<strong>The</strong> curve is practically straight from K = 0.9972 to 0.9988. Thusa discriminator will cause negligible distortion if the total range ofmodulation is restricted to 80 kc for a 40-megacycle carrier. This isalso the portion of the characteristic which provides maximum output.<strong>The</strong> range actually used covered 30 kc in each push-pull component,thereby effectively covering 60 kc on the discriminator curve.<strong>The</strong> push-pull FM circuit presents a new tool which can be appliedto any mechanical translating or measuring device. As an example, intranslating the mechanical vibration of a reed it is possible to place thetwo outside plates of the push-pull condenser on each side of the reed,having the reed act as the center grounded plate.In that case largeamplitudes can be translated with minimum distortion without addinganything to the reed itself.3— Push-Pull FM Cutter CalibratorDuring recent years as the art of disk recording has become refined,a number of improvements were made in the recording head. Severalways were devised to measure the ability of the cutting head to repro-
462 FREQUENCY MODULATION, Volume Iduce faithfully the sounds engraved on a disk. 4 <strong>The</strong> most importantof these measurements is the frequency response of the head aftercompensation. This type of measurement is made in several ways. Oneof the best-known and widely used direct methods is by the lightDISCRIMINATOR COILS STYLUS(frT GROUND POTENTIAL)Pig. 9—Arrangement of the FM calibrator adapted to a recorder head.pattern. As is generally known, this method consists of recordingseveral frequencies on a disk and comparing their amplitudes with theaid of reflection of light. This method is fairly accurate when certainprecautions are taken and is really a true indication of the performance"*-»?Fig. 10—Push-pull FM plate assembly.of the head, since the head is actually engaged in cutting a disk thatrepresents the normal load on the stylus.Another method which has been widely used consists in measuringthe amplitude of the stylus vibrating freely in air by means of a microscopewhich has been precalibrated to measure small distances. In this
PUSH-PULL CIRCUIT 463method it is very difficult, however, to obtain accurate results, since insome cases the. amplitude of the vibrations is extremely small. Bysubstituting a photoelectric cell for the human eye it is possible toimprove the accuracy to a large extent.Such optical cutter calibratorshave been in use for years. Since the measurements are taken in air,it is assumed that the difference in the measurements is small whencompared to such made while the head is<strong>The</strong> problem of being able toactually cutting a record.calibrate the recorder under actualcutting conditions still remained, however, and it was not until thepush-pull FM circuit was developed that a solution to the problem wasFig. 11—Component parts of a complete FM calibrator for recording heads.realized. A device was needed which could be attached to the recorderwithout requiring much space or adding any mass to the movingsystem, as well as one which would not couple electrically to the drivingcoil of the recording head, and of course one which would not interferewith the cutting action of the stylus.<strong>The</strong> push-pull FM system meets these requirements very nicely.However, it is practically essential to use the push-pull circuit, becausethe distortion would be too high if only one side of the stylus were usedas one of the plates of a condenser, owing to the low ratio of thecapacitor plate spacing and the large variation of the spacing. Asillustrated in Figure 9, two small plates, one on each side of the stylusshank, insulated from each other and from the recorder, are spaced afew thousandths of an inch from the stylus. Since neither mass norrigidity is added to the moving system, no change in its action can
464 FREQUENCY MODULATION, Volume Ioccur.Two flexible leads from these plates and another lead from thecutter mechanism are connected to the oscillator discriminator unitmounted on the carriage and located as close to the cutter head asfeasible. <strong>The</strong> oscillator-discriminator unit is of the same type as describedin Section 1. <strong>The</strong> variation of the capacitance, between the twoplates and the stylus, because of its motion, changes the oscillatorfrequency and varies the tuning of the discriminator in accordancewith the method of operation described in Section 2. <strong>The</strong> audio outputof the oscillator-discriminator unit, since it also contains a diode, istransferred to another unit containing an amplifier and a power supply.<strong>The</strong> output from this amplifier is then either measured with the aid ofFig. 12—<strong>The</strong> PM calibrator in operation.a tube voltmeter, or is further amplified for listening or other purposesby using a suitable transformer located between the amplifier tube,which has a high-impedance output, and a conventional amplifier of500 ohms input impedance.<strong>The</strong> push-pull FM plates are mounted on the bottom side of thecutter in such a way that incombination with the cutting stylus theyform a small push-pull condenser. As shown in Figure 10, this assembledbakelite plate on which the two FM plates are mounted fitsthe under side of the cutter and replaces the cover plate.onThis assemblyis again shown separately in Figure 11. <strong>The</strong> FM plates are, of course,adjustable so as to provide any width of gap to accommodate anycutting styli or for unusual circumstances where a wide gap is necessary.Normally, however, the FM plates are spaced 0.01 in. away fromthe stylus for frequency response measurements and 0.015 in. fordistortion measurements at the lower frequencies. This spacing isample for any modulation and yet provides more than ample output.
PUSH-PULL CIRCUIT 465For calibration during the cutting of a record, the cutter is mountedin the usual way. <strong>The</strong> oscillator-discriminator unit is mounted immediatelybeside the cutter (see Figure 12). <strong>The</strong> FM plates are connectedto the oscillator and discriminator circuitsdiameter steel wires covered with vinylite insulation.by means of two 0.004-in.<strong>The</strong> ground wirebetween the two units is of the same material. <strong>The</strong> complete schematicdiagram of the calibrator is shown in Figure 13.<strong>The</strong> output of the oscillator-discriminator unit is fed to an amplifier,which is on the same chassis with the power supply. It consists of aconventional circuit using the 6SJ7 triode connected. From there theFig. 13—Schematic of the push-pull FM calibrator.signal passes through a 3-position switch which selects the "flat compensator,"the "orthacoustic," or the "no compensation" circuits. <strong>The</strong>sepositions can be used for different purposes as follows : "No compensation"is used for measurements with a vacuum tube voltmeter, forfrequency response tests, and input versus output curves. "Flat"response can be used for monitoring on disks requiring that type ofresponse; however, the important function of this position is for intermodulationtests. "Orthacoustic" can also be used for monitoring whilethe record is being cut, and is designed for that purpose.To obtain consistent readings, it is important to have the oscillatortuned to the same frequency relative to the optimum point of operation
466 FREQUENCY MODULATION, Volume Iof the discriminator circuit. To accomplish this, a meter is providedin the diode circuit.<strong>The</strong> oscillator circuit is tuned for maximum diodecurrent and isthen backed down, in the same direction each time, to70 per cent of the peak current.<strong>The</strong> use of this instrument and results of measurements are completelycovered in the paper by H. E. Roys entitledan FM Calibrator for Disk Recording Heads." 5"Experience withAcknowledgment<strong>The</strong> author wishes to acknowledge the helpful suggestions andadvice of E. W. Kellogg, H. E. Roys, C. M. Sinnett, and A. C. Blaneyin thiswork.References1G. L. Beers and C. M. Sinnett, "Some Recent Developments in RecordReproducing Systems," Jour. Soc. Mot. Pic. Eng., XL, 4 (April, 1943), p. 222.2F. E. Terman, "<strong>Radio</strong> Engineering," McGraw-Hill (<strong>New</strong> York), 1937,p. 360; J. B. Dow, "A Recent Development in Vacuum Tube Oscillator Circuits,"Proc. I.R.E., 19 (December, 1931), p. 2095.3V. D. Landon and K. Mcllwain, "Pender's and Mcllwain's ElectricalEngineers' Handbook (Electric Communication and Electronics)," JohnWiley and Sons (<strong>New</strong> York), 3d Ed., p. 7.4D. G. Fink, "Electronic's Engineering Manual," McGraw-Hill (<strong>New</strong>York) , p. 240.5H. E. Roys, "Experience with an FM Calibrator for Disk RecordingHeads," Jour. Soc. Mot. Pic. Eng., 44, 6 (June, 1945), p. 461.
FREQUENCY MODULATION AND CONTROLBY ELECTRON BEAMS*tByLloyd P. Smith$ and Carl I.ShulmanResearch Department, RCA Laboratories Division,Princeton, N. J.Summary— General formulas for the effect of electron beams on resonantsystems in terms of frequency shift and change in Q are derived from thepoint of view of lumped circuits and from a general electromagnetic fieldstandpoint. A way of introducing the electrons has been found which materiallyenhances their effectiveness in producing a shift of frequency in aresonant system. Measurements of the frequency shift produced by such anelectron beam in a typical geometry were made which check well with valuescalculated from the general theory. Possible amplitude and phase distortionsare calculated when such a beam is used to frequency-modulate a system,and these are found to be negligibly small, even for very high modulatingfrequencies.It is shown that this method of frequency control is ideally suited forfrequency modulation or automatic frequency stabilization of continuouswavemagnetron oscillators using negative-grid-controlled electron beamsfor controlling the frequency of oscillations.MI. Introduction'ANY occasions arise when it is desirable to control the frequencyof a high-frequency oscillating system so rapidlythat only electronic means can be used. <strong>The</strong> theory of reactiveelectron beams and the computation of the change in frequencyand loading they produce in an oscillating system is presented herefrom two points of view; the first of which is a treatment essentiallybased on lumped-constant concepts, and the second is a general fieldtheoryapproach especially applicable to cavity systems or systems withdistributed constants. <strong>The</strong> change of frequency and loading can befinally expressed in terms of rather simple formulas.A part of the problem of obtaining the largest frequency shiftpossible for a given number of electrons entering the oscillating electromagneticfield region per second is that of introducing the electronsinto that combination of oscillating electromagnetic field and steadyelectric and magnetic fields for which the largest reactive current isproduced. For many applications it is necessary to obtain this maximumreactive current consistent with the auxiliary condition that* Decimal Classification: R138 X R355.912.1.f Reprinted from Proc. I.R.E., July, 1947.j Now Research Consultant, RCA Laboratories Division.467
468 FREQUENCY MODULATION, Volume Ithere be no resistive component. A complete answer to this problemis not attempted here, but a particular combination of fields has beenfound which yields a much larger reactive current than many otherusual field combinations. It also has the advantage that the loadingcan be made negligibly small.II.Lumped-Circuit TreatmentWhen free electrons are introduced into a rapidly oscillating electromagneticfield, there is in general an exchange of energy between theelectrons and the field. <strong>The</strong> electrons oscillate and induce oscillatingimage currents on the surfaces of the field boundaries. <strong>The</strong>se surfacecurrents are proportional to the field amplitude and in generalare not in phase with the oscillating field. Since these currents areproportional to the field, a linear admittance function relating thecurrents to the field can be written. This electronic admittance canbe handled as a conventional circuit element in conjunction with aproper equivalent circuit to represent the over-all system. <strong>The</strong> realpart of the electronic admittance represents an energy transfer betweenthe oscillating electrons and the electromagnetic field, and the imaginarypart represents a change in the resonant frequency of the system.<strong>The</strong> first section of the paper treats the problems of estimatingthe change in admittance across a pair of parallel-plane electrodes dueto the introduction of an electron beam moving between the parallelplanes and in the direction of a constant magnetic field. From thischange in electronic admittance one can calculate the change in theresonant frequency of the oscillating system coupled to the parallelplaneelectrodes.Calculation of Electronic AdmittanceL. Malter 1 has studied certain phases of the problem, but his resultsare not readily applicable to the problem considered here.Consider a pair of parallel plates a distance d apart, infinitely longin the y direction, and of length L in the z direction, as indicated inFigure 1. In the z direction is a constant magnetic field H. Let arectangular electron beam enter the region between the plates atz = x — 0, with velocity v in the z direction. Between the plates is anoscillating electric field E x in the x direction which is constant overthe length and width of the plates. (Assume no fringe field. This1L. Malter, "Deflection and Impedance of Electron Beams at High Frequenciesin the Presence of a Magnetic Field," RCA REVIEW, vol. 5, pp.439-454; April, 1941.
eiseMODULATION BY ELECTRON BEAMS 469point is considered in the Appendix.) <strong>The</strong> equations of motion for theelectrons in the space between the plates aremx = — E x \e\—H\e\ymy — + H|mz =|x(1)(2)(3)where||the absolute value of the electronic charge.For a field E x = E e iu:t , the solution of these equations for the xcomponent of velocity v x, subject to the initial conditions at t = tis1 = 2 = 0, x = v x = y — Q, z = v n (4)Pig. 1—Schematic diagram of beam and electrode arrangement.v:i:= - Elb)m a' — c—
470 FREQUENCY MODULATION, Volume I<strong>The</strong> current to the parallel-plane electrodes due to an oscillating chargedq between them isdqdie 1"' =— v x— -d(7)
eewhereMODULATION BY ELECTRON BEAMS 471V =-1 m2 IeY eversus 8 is shown in Figure 2.It is apparent from (10) that the electronic admittance can be madepurely reactive when 8 is 2n or — 2ir. This can be clearly understoodphysically by considering an electron's contribution to the total currentat various points of its trajectory between the parallel plates. Mathematically,of course, this contribution is proportional to the currentFig. 2—Electronic admittance as a function of 0.differential given by (8). <strong>The</strong> physical situation is as follows: Whenan electron has a velocity in a direction at right angles to a uniformmagnetic field H, it will describe a circular path. <strong>The</strong> time T requiredto traverse a complete circle is T = 2-n-m/H m is the mass of\ |the electron,|This period of rotation is|is its charge, and H is the magnetic field intensity.independent of the electron's velocity or theradius of its circular path. <strong>The</strong> angular frequency of rotation is thenH Ie
.let472 FREQUENCY MODULATION, Volume IConsider a pair of parallel plates across which an alternatingpotential difference is applied, resulting in an electric field of amplitudeE and angular frequency a between the capacitor plates shown inFigure 3(a). <strong>The</strong> uniform magnetic field is in the direction shown.An electron is projected into the field between the plates along the lineab parallel to the magnetic field. Its velocity in this direction willremain constant so that at time t = the electron will be at position 1,and at time At seconds later it will be at position 2, etc. At position 1the electron has no velocity in the direction of E, but on encounteringthe electric field E between positions 1 and 2, it will be accelerated inthis instantaneous direction.If the frequency of the oscillating electricfield „ the electron would remainin phase with the electric fieldand would be continuously acceleratedso that it would receive more and more energy from the oscillating fieldand its motion would be a spiral of ever-increasing radius. This conditionwould produce an electron current in phase with E at allpositions1, 2, • • • andof current.would constitute a loading or resistive componentIf the capacitor plates were to form a part of a resonantcircuit, this "in-phase component" would have no effect on the frequencybut would reduce the Q of the circuit.<strong>The</strong> transit time of the electron through the capacitor platesthe relative values of « and a> ccurrent isandcan be chosen so that the net electronnot in the direction of E but in quadrature with E, so thatit constitutes a purely reactive current. To see how this comes about,o> cbe somewhat less than
iMODULATION BY ELECTRON BEAMS 473circular motion and its amplitude of oscillation about the medianplane is shown by the vector r 2in Figure 3(b). Since
474 FREQUENCY MODULATION, Volume IE and the total current would lead E by 90 degrees, giving rise todecrease in the resonant frequency of the parallel circuit.If the electrons had emerged from the plates at position 6, thenthe total current would be I' as shown by the dashed vector in Figure3(c). In this case, the total current will have a resistive and reactivecomponent as indicated by (9).Calculation of Frequency ChangeIf a beam of electrons is to be used in the manner described aboveto control the resonant frequency of an oscillating system, the frequencyof the over-all system can be estimated by applying the Y ecalculated above to the equivalent circuit for the system, and calculatingthe frequency from conventional circuit theory.aLet the L C circuitshown in Figure 4 represent the equivalent circuit of the systembefore the beam is introduced. C is denned as the total equivalentcapacitance of the system, or more exactly,BEAML. U C, EZZZ2 VacFig. 4—Equivalent lumped circuit of resonant system.C V aEWvwhere E is the dielectric constant of the space, V ac is the radio-frequencyvoltage across the parallel planes between which the beammoves, and the integral is taken over the entire volume of the oscillatingsystem. C is then determined by the stored energy of the systemand the point at which the beam is introduced, for V ao depends, ingeneral, on the geometry of the system.To calculate the resonant frequency, writewhereB e + B c= (11)B e= electronic susceptance
(o>1MODULATION BY ELECTRON BEAMS 475and B c= circuit susceptance =— (w2— o>Co2) (12)where w 2 = 1/L C — resonant frequency of the system before theelectron beam is introduced. Let to = a> + A« where A
476 FREQUENCY MODULATION, Volume IwhileA« (± 2tt)U- \hAid (± tt)Sd V 2 2ttC 2(14b)G e(±2tt) =0.(15b)It is clear from the above that it is possible to frequency-modulatean oscillating system by introducing into the resonant circuit anelectron beam moving in the direction of a constant magnetic field.Furthermore, this is possible without absorption of power by the electronbeam.If, instead of being collected after traversing the length of theparallel planes, the electrons are reflected and caused to make a return
MODULATION BY ELECTRON BEAMS 477using a twelve-vane magnetron oscillator shown schematically inFigures 6 and 7, which show a multivane magnetron with two rectangularbeams introduced between the vane structures. On one sideof the resonant cavity block is the beam gun structure, which includesa cathode, control grid, and acceleration aperture or grid; on the otherside of the block is a collector (or reflector for multiple transit). <strong>The</strong>beam is focused by the magnetic field. Measured values of the changein frequency per milliampere of beam current are shown in Figure5(b) plotted as a function of *> c/u for two different transit times.<strong>The</strong>se curves have the same form as the theoreticalcurves shown inFigure 5(a). <strong>The</strong> L/d ratio for the cavity was 3, and the effectivecapacitance C was estimated to be about 2 X 10 -12 farads. At a beamitfMEASURED FREQUENCY PER MA BEAM CURRENT
478 FREQUENCY MODULATION, Volume ICOLLECTORCONTROL GRIDCATHODEBEAM-ACCELERATORPig. 6—Schematic view of multivane magnetron withauxiliary beams.at grazing incidence. In order to obtain the maximum frequency shiftconsistent with electron orbits just grazing the plates, it is necessaryto look at the displacement of the spiraling electron which does dependon the electric field intensity.MAGNETRONVANESBEAMFig. 7—Cross-sectional view of multivane magnetron withauxiliary beams.
xe«MODULATION BY ELECTRON BEAMS 479Integration of (6)gives|e|fafX = -E WD _ [ e i(a)c- t 1] (16)m 2 (oj — u> c ) (i)l*Ux = ;^0IITm a c 6(o>^o> c ). (17)As long as|intensity.|mnx S= (d/2), A«> and G eare independent of the fieldIt is of interest to estimate, in a rough way, the largest possiblefrequency change consistent with space-charge limitations and grazingincidence that can be effected with the introduction of a resonantbeam of the type herein described. Consider a beam of thickness tand width W moving between a pair of parallel-plane electrodes alsoof width W, of length L, and a distance d apart. We shall assume thatall the stored energy in the system is contained between the parallelplaneelectrodes and select a case of particular interest, namely(«>,, --
480 FREQUENCY MODULATION, Volume IFUA«> (21)9ird 2 tIt is clear from (21) that A» may be increased further by reducing d.However, d may not be reduced beyond the point where electrons arecaught by the electrodes. <strong>The</strong> minimum d is determined by the requirementthat the maximum orbit diameter be just equal to d/2 for a beamof negligible thickness, orXmax — & 'dm o> 2tt 2Recalling that V uc= E d, we haved* V an lei
f(1:''MODULATION BY ELECTRON BEAMS 481rane space is the sum of the magnitudes of the current away fromand toward the cathode.Effect of Modulation Rate on Electronic AdmittanceIf a resonant beam of the type herein described is to be used tomodulate or control oscillating systems, it is important to know howthe electronic admittance Y edepends on the modulation rate. Assume,for instance, that the beam current is not constant but is of the formIj+ v cos „, is the modulation frequency and p is the modulation coefficient.<strong>The</strong>n (8) becomesdlm — iE n-- (1 + p cos a> mt ) [e'm 2( c ) v J/ cos o>J [e«««-"> - */« 1] dz. (27)and recall that (I _ e «9+0) 1 — ei?4> J(28)Combining I xand L 2 , one can write the over-all modulated admittanceY em in expanded trigonometric terms as followsL 2 | 7|Y em = H [1 + pS t (9, ) cos («,,„,* + R (J), $) ) 11 - cos 64d 2 V I # 2— sin (9+ i ___ __ \l+pS 9 (9,
. 2•482FREQUENCY MODULATION, Volume IwhereSi 2 (9,0)r-1 - cos (6 -0) 1 — cos (0 + 4>)-\ 2+4(1 - cos 9)26- +sin (0 — 0) sin (0 + 0)"-)=-4(0 - sin 0)2tan 0(0, 0)I"2sin A sin (9 — 0) sin (0 + 0) ~|(t, 9 — 4> e + + '1 — cos (9 — 0) 1 — cos (9 + 0) 1 — cos0'+ 2-0 +sin (9 + 0,respect to 9. <strong>The</strong>nS 1 (^,0)=1 9»00(0,0) =0 0»0can be neglected with(34)(35)S 2 (0,0)M1— 9 // sin sinCOS6 - sin 6 V \ /(36)1 — costan a (9, 0)sin4>sin(37)
—MODULATION BY ELECTRON BEAMS483It isof interest to look at the case where 8 =^2tt»$:V2S 2 (2-7T, ) =-».(40)So that, when 6 — 2n»cj>,Yem (2tt,)L 2 |7„4d 2 y 2ttV21 + p VI — cos 4> cos o> mI t H* \ 2andAo) (2-7T,
ii484FREQUENCY MODULATION, Volume I(tt 2 — 22) cos 4> — 1T-(tt 2 — 2(£2) sin ) = tansothatY em (TT, )_ v- 7\j_ j 24d- F L k*-1 +p-2(tt 2 2-
MODULATION BY ELECTRON BEAMS485so thatS 2(2-,
486 FREQUENCY MODULATION, Volume IIII.General Field-<strong>The</strong>ory TreatmentWhen electrons are injected into cavities or systems with distributedconstants, it is convenient to be able to calculate the resultingchanges in frequency in terms of the electromagnetic field quantitiesand the forced electron convection current, rather than in termsof currents induced in a circuit containing lumped constants as wasdone in Section I.This can be done quite simply with adequate accuracyby means of a perturbation method.<strong>The</strong> electromagnetic field in a region of space entirely enclosed bya perfectly conducting surface will be given by a solution of Maxwell'sequations for which the tangential component of electric field at thesurface vanishes. When the field quantities are expressed in the meterkilogram-second3 system of units, these equations are:Curl H = J + zEDiv H =Curl E = -tiHDiv E = P /e.(54a)(54b)(54c)(54d)In obtaining solutions of (54), it is convenient to reduce the numberof equations by expressing^ and H in terms of the scalar potentialand the vector potential A by means of the relationsE = — A — grad whereWhen so expressed, E and H automatically satisfy (54b) and (54c)and we are left with the problem of solving the equationsV•V A — e/iA = — pj + fie grad + grad div AV 2
MODULATION BY ELECTRON BEAMS 487additional condition that div A = 0, whereafter the above equationsreduce toV•VA — e/xA = — p.J + fie grad(56a)V 2
:488 FREQUENCY MODULATION, Volume Ivector potential of the nt\i mode, i.e., A 0n, corresponding to the frequencya> .0n If a uniform beam of electrons is introduced into thecavity, then we may calculate a first approximation to the currentinside the cavity by calculating the electron trajectories that would beproduced by the unperturbed or zeroth-order fieldexisting before theelectrons were introduced. Let the first-order approximation to thecurrent density inside the cavity be denoted by SJ 1(r,t). S is aparameter introduced to indicate the order of smallness of the current.<strong>The</strong> corresponding first approximation to the charge distribution inthe cavity can be denoted by 8p 1 (r, t) . <strong>The</strong> first-order current andcharge can be substituted in (56a) and (56b) and these equationssolved to obtain a first approximation for the vector and scalar potentialswhich may be denoted by A ln and ln. In principle this procedurecan be repeated and would be expected to yield a convergent series(when J 1 is not too large) which would give a solution of the problemwith any desired accuracy.Carrying out this procedure, the first-order approximation for thevector and scalar potentials will be found by solving the followingequationsV•VA ln (r,t) —t!iA u ,(r,t) =- /iS/ lre (r, t) + p.c grad ln (r, t) (60)8pi„(r, t)V 2
' (."uh)MODULATION BY ELECTRON BEAMS 489equated.This gives the following infinite set of equations:V•VA° lM= - /xSJV (64a)V vAi„ 111 + ]n= - /xS/(1)]n + i>eM grad ln a) (64b)V 2 0,„" =€(65a)V 2^i„ (1) =S„ (1)(65b)eEquations (64a) and (65a) have no bearing on the problem ofdetermining the resonant frequencies, since the quantities involvedare independent of the time.Since S/,,/ 11 is small, we may make use of a standard perturbationmethod for determining A ln and a. To do this we writeA ln{l}= A 0H + 85 lB (o, „, r) + -{—Jltt»> (
490 FREQUENCY MODULATION, Volume IEquation (69) is already satisfied by A 0n-Since it is known that thevector potentials form an orthogonal set of functions, i.e.,/0, m# ni 0m A 0n *dr = (71)constant, m = nwhere A 0r* is the complex conjugate of A 0n and the integral is takenover the volume of the cavity, we may expand B a) ln in terms of thefunctions A 0n. Thus*i„ (1) = 2 C lnh^A 0h (72)Substituting this into (70) and rearranging and making use of (69),we obtain2 W [ w 2 2O« — ">0fc ] Clnk U) A 0k= — 2tixm0n o>0n A ' 0n— [i.J lH a) (
A:MODULATION BY ELECTRON BEAMS 491determined from the unperturbed vector potential, so that it is notnecessary to calculate the field as modified by the electrons in orderto determine the change in frequency caused by the electron stream,provided the change is small.<strong>The</strong> quantity u> / computed from (74) will, in general, be complex,so that the frequency change is actually the real part of (74), theimaginary terms giving rise to a net energy transfer from field to electrons.If the electrons gain energy and the wall losses in the cavityare small, this losscavity, so that (74)of energy to the electrons determines the Q of thefurnishes the basis for the following two formulasAm = — Rp-2eo) 0n /| A 0n|2dr(75)°>0n2Q— Im-/•fl» (1) («>oJ • A2eo) „/ |0n|0n *dr2dr(76)An£nfJnOPTIMUM FREQUENCYDECREASE01 OPTIMUM FREQUENCYINCREASE(a) (b) (c)Fig. 10— -Phase diagrams for A, E, and J.where A« is the change in frequency, Q 0n is the Q of the cavity withinjected electrons, and the cavity is oscillating in the wth mode.Before calculating the electron currents in some special cases, it willbe of interest to discuss the implications of (75) and (76) with regardto the nature of the currents necessary to produce optimum frequencyshifts, etc, If the unperturbed electric field in the cavity is representedbyE n (r)e*""**,then from the relation (55) the vector potential may be written asiE n (r)^•on (r ) e' uo"' = E n (r) e ,M0"' = e in/2 e°"">*.°>0n"On(77)Consequently the vector potential leads the electric field intensity intime phase by 90 degrees. <strong>The</strong> vector diagram in Figure 10 (a) showsthe time-phase relationship of E 0n, A 0)t , and A * 0n taking the phaseangle of E n as zero,
492 FREQUENCY MODULATION, Volume ISince the denominators of (75) and (76) are real, the real andimaginary parts are determined by the scalar productJ ln (r):A„*(r)in the integrals in the numerators.terms of E n (r), which is real, isThis scalar product, expressed inJ 0n^ K„, r) • AttKir)* (r) = /„„«' ( Mon , r) e-w*.(78)Consequently, for the optimum real part of this expression and thereforethe optimum frequency shift,lag the electric field intensity by 90 degrees.the electron current should lead orFor maximum decrease infrequency (75) shows that the electron current must lead E n by 90degrees, while for maximum increase in frequency the electron currentshould lag E n by 90 degrees. This is analogous to the situation incircuit theory.Figures 10(b)<strong>The</strong> vector diagrams for these two cases are shown inand 10(c), respectively.Formulas (76) and (78) show that optimum loading takes placewhen the current is in phase with E n. This is the case when energy istransferred from the electro-magnetic field to the electrons. If thecurrent were 180 degrees out of phase with E,„ energy would betransferred from the electrons to the field. In this case one wouldhave a generator and a negative Q.If the time phase of the current is a function of position in thecavity, as it usually will be, the net frequency shift is, of course, givenby the integral.In addition to the optimum time-phase relationships, (75) and (76)show that the greatest frequency change or loading for a given currentoccurs when that current is parallel to the electric field and located inthat region of the cavity where the electric field is the largest. Thisis the region of largest interaction of field and electi'ons.Calculation of Current<strong>The</strong> frequency shift and loading will be computed for a rectangularcavity for a special way of introducing the electrons. We shall assumethat before the electrons are introduced the mode of oscillation is suchthat the electric field is parallel to the x direction only, as shown inFigure 11. <strong>The</strong> electric field for this mode is given by
1MODULATION BY ELECTRON BEAMS 493and the frequency byE x (r, t)tryttZ— E sin — sin — e'-YZ(79)/I 1V Y' 2 Z"-(fiO)<strong>The</strong> x component of the vector potential corresponding to this mode isA dl Try ttZ. (r, t) = — E„ sin — sin — eluat.Y Z(81)H/DIRECTION OF STEADY^ MAGNETIC FIELDHIGH FREQUENCY FIELDELECTRON BEAMFig. 11—Schematic diagram showing beam inresonant cavity.rectangularWe shall assume that the electron stream traverses the cavity in adirection parallel to the z axis, in which direction a uniform magneticfield H is assumed to be present. <strong>The</strong> determination of the first-ordercurrent / ln (
«/„I|J494 FREQUENCY MODULATION, Volume IX Yx = —; V — —;2 2z =x^=y~ and « = i; ,the solutions of the equations of motion, (1), (2), (3), for the x componentof velocity, x, with the above applied field,iswheree\EF (z) e*"o*o (82)mf•/"H/VoF{z)— I cos »,,(« — z/v^) sin -qe^Hr). (83)2nV<strong>The</strong> charge entering the cavity per unit area of the beam betweent„ and t + dt will bedq = —\J\dtwhere J is the current density in the beam before entering the cavity.<strong>The</strong> current density J in the x direction in the beam between z andz + dz at time tisJcfe = _j|—dz . |e||x = E F (z) e^dzv m v(84)J — E F (z) e« (f -«/ l, » ) .<strong>The</strong> amplitude of the current density entering (75) and (76), namely,J\n a \ is just the time-independent part of the above expression; hence,e J| | IJm = a) (»o) EoF (*) e~Wv°.(85)This completes the calculation of the first-order approximation for thecurrent.Calculation of the Frequency Shift<strong>The</strong> integral in the denominators of (75) and (76) is easy to compute.<strong>The</strong> result is
|MODULATION BY ELECTRON BEAMS 495/-Z fY />XJ J J lA•/ ^02 fccZj/rf2 =-£" 2XYZ«>o* 4(86)In the numerator of the same formulas, we require the value ofIff1'JWJ J •/MA/ (r) dxdydz-i\e\ E,2 r z f Y r xm vv-if f\'o\Fv o Jo Jo Jo(z) e^z/voTryttzsin — sin — dxdydz.Y Z
i'Iea496FREQUENCY MODULATION, Volume 1whereK"'I71-2F(z) e-Mos/"o s in — dz.Z(88)K can be evaluated and for the real part we findR P K =|4tt7T(d) + (0 C )+TTV \ /TrWo \2]— (
MODULATION BY ELECTRON BEAMS 497<strong>The</strong> main characteristics of this method of changing the frequencyare that the frequency is proportional to the total beam current andinversely proportional to the energy stored in the electromagnetic fieldwithin the cavity. A further examination of (92) and (93) shows thatwhen the transit angle a is not too small, the maximum frequency shiftAoi mi occurs when(l-fc)
6a—498 FREQUENCY MODULATION, Volume Iresonant with the oscillating electric field over that which would resultfor zero magnetic field.When k < 1, the electron current is inductive, i.e., lags behind theelectric field producing it, and gives rise to an increase in resonantfrequency of the system.When k > 1 the electron current is capacitive,i.e., leads the electric field, and produces a decrease in resonant frequency.It should be noted that the above behavior applies to cases wherethe beam is not limited by space-charge effects and the orbits of theelectrons are not large enough to strike the walls of the cavity. Anestimate of the effects of these factors can be made for any special case.Electron LoadingIn order to calculate the electronic loading, we note from (76)the imaginary part of K given by (88) is required. Thusthat«o 2 |/|\e\= Im K. (95)2Q U (.mVyyXYZ<strong>The</strong> value of the ImK isImK = vrt«V Z (' rrV V ZI COS 2 ( c ) I I COS 2 (o) + u> c )Z I 2v \ Z I 2v—j;~~~ +—:irt> Y \— («o — °>o)2r2;jy'^oVi I) — (">o +
MODULATION BY ELECTRON BEAMS 499tional to the total beam current and inversely proportional to the cavityvolume and the square of the resonant frequency.<strong>The</strong> maximum loadingoccurs when w = (1 — k) a = 0. For a transit angle differentfrom zero this occurs at k = 1, i.e., u> c= , which means that theelectron circular motion is exactly in resonance with the electric field.As seen from Figure 13, Ao> is zero at this point, so that the electroncurrent is entirely a resistive component.When the transit angle is not too small the loading is essentiallyzero atW = (1 — k) a = Sir (99)since T(w) is zero at this point and T(u) is very small. In this casewe find that minimum loading occurs at (1 — k) a = Zir, instead of 2-n-
500 FREQUENCY MODULATION, Volume IAPPENDIXFringe-Field EffectIn general, the problem of estimating the effect of the fringe fielddepends on the geometry of the specific system. If, however, thetransit time in the fringe field is small, the effects can be approximatedas follows. 1Consider a charge q emerging from between a pair of parallelplaneelectrodes, and let the charge be displaced a distance x from themedian plane.<strong>The</strong> induced charge on one plane isQdand that on the other is
:7.MODULATION BY ELECTRON BEAMS 501<strong>The</strong> fringe effects on entering the space between the parallel planes arenegligible, for the electrons are assumed to enter at x = 0. Fromintegration of (6)x = + E nm 2o>-9(e VJ — 1) efa *.(102)Iffe fat/,=I'olE n2dm o),0(e«-l).<strong>The</strong> total current can be regarded as the sum of two parts, so thatI — I1 + I fwhere l x is given by (9)I =I'd M T*Eo(e'0-1) + (l + id-eW)2d m 1over-all admittance including fringe-field effects.L- j/ |1 — cos4d 2VO)(103)(sin d) 1tt)-,—+ i-It isclear from the above that, for small transit times through thefringe field, the contribution to the image currents from the fringeelectrons is of the same order of magnitude of terms already neglectedin this theory and should be neglected here.
502 FREQUENCY MODULATION, Volume 1CARRIER AND SIDE-FREQUENCY RELATIONS WITHMULTI-TONE FREQUENCY OR PHASEMODULATIONSByMurray G.CrosbyRCA Communications, Inc., Riverliead, L. I., N. Y.Summary<strong>The</strong> equation for the carrier and side frequencies of a frequency orphase-modulated wave is resolved for the case of two applied modulatingtones. It is shown that when more than one modulating tone is applied, theamplitude of the carrier is proportional to the product of the zero-orderBessel Functions of all the modulation indexes involved. <strong>The</strong> amplitudesof the side frequencies are proportional to the products of Bessel Functionsequal in number to the number of tones applied and having orders respectivelyequal to the orders of the frequencies involved in the sidefrequency. Beat side frequencies are produced which have higher-orderamplitude and do not appreciably widen the band width occupied by frequencymodulation.(4 pages)* Decimal Classification: R630.1.f RCA REVIEW, July, 1938.SOME RECENT DEVELOPMENTS IN RECORDREPRODUCING SYSTEMS*fByG. L. BEERSt AND C. M. SlNNETT#RCA Manufacturing Co., Inc., Camden, N. J.SummarySeveral factors of importance in obtaining satisfactory reproductionof sound from lateral-cut phonograph records are considered. An experimentalrecord reproducing system employing the principles of frequencymodulation is described and data are supplied on the measured and calculatedperformance characteristics of the system. Curves are includedshowing the vertical force required for satisfactory tracking with theexperimental frequency-modulation pickup as compared with other pickupsof conventional design.(9 pages; 18 figures; Appendix)* Decimal Classification : R681.843.f Proc. I.R.E., April, 1943.J Now Asst. Director of Engineering in Charge of Advanced Development,RCA Victor Division, Camden, N. J.# Now with the Home Instrument Department, RCA Victor Division,Camden, N. J.
SUMMARIES— MISCELLANEOUS 503FREQUENCY MODULATION OF RESISTANCE-CAPACITANCE OSCILLATORS*!ByMaueice AktztResearch Department, RCA Laboratories Division,Princeton, N. J.SummaryA method is described for direct-frequency modulation of a resistancecapacitanceoscillator which is simpler and more stable then the beatoscillators formerly used. Spurious amplitude modulation is reduced to anegligible value without the use of limiters and without introducing appreciableharmonics in the output wave. Balanced control tubes preventtransients or signal frequencies from appearing in the output. Curvesare given which provide an easy method of choosing the network andconstants for any desired condition. <strong>The</strong> device is especially suited tofacsimile transmission by sub-carrier frequency modulation.(6 pages; 9 figures)* Decimal Classification : R148.5.f Proc. I.R.E., July, 1944.AN F-M CALIBRATOR FOR DISCRECORDING HEADS*!ByH. E. KoysEngineering Products Department, RCA Victor Division,Camden, N. J,SummarySince the beginning of disc recording, a device has been needed whichwould permit the calibration of a recording head under actual cuttingconditions. Such a devise is described in this paper. First, however, variousformer methods (such as sunlight pattern, microscope, and photoelectriccell) are discussed. <strong>The</strong> paper then treats in detail with the FM methodand describes the FM calibrator. A comparison of FM and optical calibratorsis included together with discussions on change in frequency responsedue to cutting load, change in recording level with groove width,distortion, and monitoring.(6 pages; 10 figures)"'Decimal Classification: R681.843.f Broadcast <strong>New</strong>s, June, 1946.
504 FREQUENCY MODULATION, Volume IFREQUENCY-MODULATION MOBILE RADIO-TELEPHONE SERVICES*!ByH. B. MartinAssistant Chief Engineer, <strong>Radio</strong>marine Corporation of America,<strong>New</strong> York, N. Y.Summary<strong>The</strong> proposed use of frequencies in the Very High Frequency rangesof 30-/ f4 and 152-162 megacycles for Common-carrier General Mobile <strong>Radio</strong>telephoneCommunication is discussed with reference to propagational andequipment advantages. Consideration is limited to the radio link forvehicular and marine mobile service. Frequency modulation and its advantagesfor mobile communication are discussed briefly. <strong>The</strong> use ofseparate transmitting and receiving frequencies is the basis for all recommendationsand allocation plans which are traced from their origin by the<strong>Radio</strong> Technical Planning Board to the most recent Industry suggestionsto the Federal Communications Commission. Geographical considerationsfor service areas of fixed stations are based on <strong>Radio</strong> Manufacturers Associationrecommendations for transmitter powers, antenna heights, desiredand undesired signal levels, etc. <strong>The</strong> Urban and Highway proposed services,including Marine, are compared on an operational and equipment basis andthe most important mobile unit performance requirements are given. Referencesfrom <strong>Radio</strong> Technical Planning Board (RTPB), <strong>Radio</strong> ManufacturersAssociation (RMA), Federal Communications Commission (FCC) andtechnical publications are provided.(12 pages; i tables)* Decimal Classification : R540.t RCA REVIEW, June, 1946.A FREQUENCY-MODULATED MAGNETRON FORSUPER-HIGH FREQUENCIES*!ByG. R. Kilgore, Carl I. Shulman, and J. KurshanResearch Department, RCA Laboratories Division,Princeton, N. J.SummaryThis paper is based on a wartime requirement for a 25-watt, 4000-megacyclecontinuous-wave oscillator capable of electronic frequency modulationwith a deviation of at least 2.5 megacycles. A satisfactory solution wasfound in the addition of frequency control to a continuous-wave magnetronby the introduction of electron beams into the magnetron cavities in amanner described by Smith and Shulman. This method is referred to as"spiral-beam" control.A brief account is given of the method of designing a continuous-wavemagnetron for the specified power and frequency. <strong>The</strong> problem of adding
SUMMARIES — MISCELLANEOUS 505spiral-beam frequency control to this magnetron is considered in detail,and a procedure is presented for obtaining the optimum, design consistentwith negligible amplitude modulation and reasonable cathode-current densities.<strong>The</strong> unusual features of construction of this magnetron are described,including a, method of mechanical tuning and the method of adding gridcontrolledbeams for frequency modulation.Performance data on the continuous -wave magnetron over a wide rangeof operating conditions indicate that the required 25 watts output can beattained at 850 volts with 50 per cent efficiency. Experimental results on"spiral-beam" frequency control demonstrate that the required 2.5-megacyclefrequency deviation ivith no amplitude modulation can be achievedby electron beams introduced into two out of twelve cavities. A deviationof U megacycles is attained under conditions allowing some amplitudemodulation. Still greater deviation is predicted by using more beams.(8 pages; 10 figures)''Decimal Classification: R355.912M.f Proc. I.R.E., July, 1947.A 1-KILOWATT FREQUENCY-MODULATED MAGNE-TRON FOR 900 MEGACYCLES*!ByJ. S. Donal, Jr., R. R. Bush, C. L. Cuccia, and H. G. HegbarResearch Department. RCA Laboratories Division,Princeton, N. .1.Summary<strong>The</strong> method of Smith and Shulman has been used for the frequencymodulation of a 1-kilowatt continuous-wave magnetron. This tube is of the"Vane" type, having twelve resonant cavities, and it is mechanically tunableover a range from about 720 to 900 megacycles by a cylindrical elementwhich varies the interstrap capacitance. At the applied magnetic fieldrequired for frequency modulation without change in amplitude, 1 kiloivattoutput at 900 megacycles is obtained with an anode voltage of 2.5 kilovoltsand an efficiency of about 55 per cent; the efficiency rises with decreasingfrequency or with increasing magnetic field.At 900 megacycles, electron beams in nine of the magnetron resonantcavities give a frequency deviation of 3.5 megacycles (a total frequencyswing of 7 megacycles) at an output of 1 kilowatt, rising to h megacyclesat an output of 750 watts. <strong>The</strong> frequency deviation is reduced when the tubeis tuned to lower frequencies. <strong>The</strong> modulator power required would bevery low, since the grid-cathode capacitance of the frequency-modulationguns is small and the grids draw no current.It would be practicable to increase the frequency deviation of this tubeby about 15 per cent through an increase in beam current, and by an additional20 per cent through the use of eleven beams. A change in the typeof beam cathode would effect an even greater deviation.(6 pages; 6 figures; 1 table)* Decimal Classification: R355. 912.1.t Proc. I.R.E., July, 1947.
APPENDIX IFREQUENCY MODULATIONA Bibliography of Technical Papersby RCA Authors1936—1947This listing includes some 75 technical papers onFREQUENCY MODULATION and closely relatedsubjects, selected from those written byRCA Authors and published during the period1936-1947.Papers are listed chronologically except in casesof multiple publication. Papers which have appearedin more than one journal are listed once,with additional publication data appended.A List of Sources isgiven on the following page.507
508 FREQUENCY MODULATION, Volume 1Broadcast <strong>New</strong>sElectronicsLIST OF SOURCESRCA REVIEWCommunicationsFM and TelevisionJour, of the Society of Motion Picture EngineersProceeding of the Institute of <strong>Radio</strong> EngineersRCA Licensee Bulletins(RCA Licensee Bulletins are not published and are issued only as aservice to licensees of the <strong>Radio</strong> Corporation of America.)
FREQUENCY MODULATION BIBLIOGRAPHY"Frequency Modulation Propagation Characteristics", M. G. Crosby,Proc. I.R.E. (June) 1936"Frequency Modulation Noise Characteristics", M. G. Crosby, Proc.I.R.E. (April) 1937"Carrier and Side Frequency Relations with Multi-Tone Frequencyor Phase Modulation", M. G. Crosby, RCA REVIEW (July) .... 1938"Frequency Modulation", S. W. Seeley, RCA Licensee BulletinLB-505 (January) 1940"<strong>The</strong> Service Range of Frequency Modulation", M. G. Crosby, RCAREVIEW (January) 1940"A Cathode Ray Frequency Modulation Generator", R. E. Shelby,Electronics (February) 1940"Comparative Characteristics of Frequency and Amplitude ModulationReceivers", C. N. Kimball and S. W. Seeley, RCA LicenseeBulletin LB-515 (March) 1940"Signal Generators for Frequency Modulated Waves", J. A. Rankinand D. E. Foster, RCA Licensee Bulletin LB-514 (March) 1940"Sound Broadcasting on Ultra-High Frequencies with SpecialReferenceto Frequency Modulation", A. F. Van Dyck, RCA LicenseeBulletin LB-518 (March) 1940'Frequency Modulation Receiver Considerations", J. A. Rankin andD. E. Foster, RCA Licensee Bulletin LB-510 (May) 1940"Reactance-Tube Frequency Modulators", M. G. Crosby, RCA RE-VIEW (July) 1940"Dual I-F Amplifier for FM-AM Reception", G. Mountjoy, RCALicensee Bulletin LB-535 (October) 1940"Frequency Modulation Field Tests", R. F. Guy, RCA REVIEW(October) 1940<strong>Radio</strong> (January) 1941"Spurious Responses in FM Receivers", D. E. Foster and J. A. Rankin,RCA Licensee Bulletin LB-5U3 (December) 1940"A Transmitter for Frequency Modulated Broadcast Service Using a<strong>New</strong> Ultra-High-Frequency Tetrode", A. K. Wing and J. E. Young,RCA REVIEW (January) 1941FM", M. G. Crosby, RCA REVIEW"Band Width and Readability in(January) 1941"Impulse Noise in FM Reception", V. D. Landon, Electronics(February)1941"Frequency Modulation", S. W. Seeley, RCA REVIEW (April) 1941"Drift Analysis of the Crosby Frequency-Modulated TransmitterCircuit", E. S. Winlund, Proc. I.R.E. (July) 1941"Duplex Transmission of Frequency-Modulated Sound and Facsimile",RCA REVIEW (July) 1941"Intermediate-Frequency Values forFrequeney-Modulated-Wave Receivers",D. E. Foster and J. A. Rankin, Proc. I.R.E. (October) .... 1941"<strong>The</strong> Development of a Frequency-Modulated Police Receiver forUltra-High-Frequency Use", H. E. Thomas, RCA REVIEW (October)1941"Generation and Detection of FM Waves", A. Barco, C. N. Kimballand S. W. Seeley, RCA REVIEW (January) 1942509
510 FREQUENCY MODULATION, Volume I"Frequency-Modulation Distortion in Loudspeakers", G. L. Beers andH. Belar, Proc. I.R.E. (April) 1943Jour. Soc. Mot. Pic. Eng. (April) 1943"Some Recent Developments in Record Reproducing Systems", G. L.Beers and C. M. Sinnett, Proc. I.R.E. (April) 1943"PM & UHP", R. F. Guy, Communications (August) 1943"Use of Subcarrier Frequency Modulation in Communication System",W. H. Bliss, Proc. I.R.E. (August) 1943"PM Noise Level and AM Noise Level", Broadcast <strong>New</strong>s (January) . . 1944"An F-M Receiver Circuit", RCA Licensee Bulletin LB-616 (February)1944"A <strong>New</strong> System for Crystal Control of F-M Carriers", G. Mountjoy,RCA Licensee Bulletin LB-621 (June)"Frequency Modulation of Resistance-Capacitance Oscillators",1944M. Artzt, Proc. I.R.E. (July) 1944"Coverage Curves for FM Antennas", R. D. Duncan, Jr., Broadcast<strong>New</strong>s (August) 1944"FM Audio Measurements with an AM Receiver", R. J. <strong>New</strong>man,Broadcast <strong>New</strong>s (August) * 1944"Antennas for FM Stations", J. P. Taylor, Broadcast <strong>New</strong>s (August) 1944"A Frequency-Dividing Locked-in Oscillator Frequency ModulationReceiver", G. L. Beers, Proc. I.R.E. (December) 1944"Selecting a Site for an FM Station", J. P. Taylor, Broadcast <strong>New</strong>s(January) 1945"Square Loop Frequency Modulation Antenna", J. P. Taylor, Electronics(March) 1945"A Pretuned Turnstile Antenna", G. H. Brown and J. Epstein, Electronics(June) 1945"How to Determine the Area an FM Station Should Serve", J. P.Taylor, Broadcast <strong>New</strong>s (June) 1945"How to Determine the Required Transmitter Power of an FMStation", J. P. Taylor, Broadcast <strong>New</strong>s (June) 1945"Audio Frequency Response and Distortion Measuring Techniques forFM Transmitting Stations", R. J. <strong>New</strong>man, Broadcast <strong>New</strong>s (June) 1945"Quench AVC for F-M Receivers", RCA Licensee Bulletin LB-6S6(July) 1945"FM Antenna Coupler", J. P. Taylor, Electronics (August) 1945"Ratio Detectors for F-M Receivers", S. W. Seeley, RCA LicenseeBulletin LB-645 (September) 1945"Frequency-Modulation Distortion Caused by Multi-path Transmission",M. S. Corrington, Proc. I.R.E. (December) 1945"High Frequency R-F Circuits for AM-FM Receivers", E. I. Anderson,RCA Licensee Bulletin LB-653 (December) 1945"Multi-Unit Construction—A Feature of <strong>New</strong> FM Transmitters",J. L. Ciba, Broadcast <strong>New</strong>s (January) 1946"Push-Pull Frequency Modulated Circuit and Its Application to VibratorySystems", A. Badmaieff, Jour. Soc. Mot. Pic. Eng. (January) 1946"Range Prediction Chart for FM Stations", F. C. Everett, Communications(November) 1945Broadcast <strong>New</strong>s (January) 1946"A <strong>New</strong> Exciter Unit for Frequency Modulated Transmitters", N. J.Oman, RCA REVIEW (March) 1946"Balanced Phase Shift Discriminator", S. W. Seeley, RCA LicenseeBulletin LB-666 (March) 1946
FM BIBLIOGRAPHY 511"Input Impedance of Several Receiving-Type Pentodes at P-M andTelevision Frequencies", F. Mural, RCA Licensee Bulletin LB-661(March) 1946"<strong>The</strong> Transmission of a Frequency-Modulated Wave Through a Network",W. J. Frantz, Proc. I.R.E. (March) 1946"Grounded-Grid Power Amplifiers", E. E. Spitzer, Electronics (April) 1946"Frequency Modulation Mobile <strong>Radio</strong>telephone Services", H. B. Martin,RCA REVIEW (June) 1946"Development of an Ultra-Low Loss Transmission Line", E. O. Johnson,RCA REVIEW (June) 1946"An FM Calibrator for Disc Recording Heads", H. E. Roys, Broadcast<strong>New</strong>s (June) 1946"A Discussion of FM Field Survey Techniques", Broadcast <strong>New</strong>s(June) 1946"How to Make a Field Survey of an FM Station", G. W. Klingaman,Broadcast <strong>New</strong>s (June) 1946"Characteristics of the Pylon FM Antenna", R. F. Holtz, FM andTele. (September) 1946"Determining the Population Served by an FM Station", Broadcast<strong>New</strong>s (October) 1946"Isolation Methods for FM Antennas Mounted on AM Towers", R. F.Holtz, Broadcast <strong>New</strong>s (October) 1946"Frequency-Modulation Distortion Caused by Common- and Adjacent-Channel Interference", M. S. Corrington, RCA REVIEW (December)1946"Twelve-Channel FM Converter", J. E. Young and W. A. Harris,Electronics (December) 1946"Input Circuit Noise Calculations for F-M and Television Receivers",W. J. Stotze, Communications (February) 1947"Explanation of the Ratio Detector as an Aid in FM Servicing", J. A.Cornell, RCA Rad. Serv. <strong>New</strong>s (March-April) 1947"Transmission Lines and Antennas for FM and Television", M.Kaufmann, <strong>Radio</strong> Maintenance (March and April) 1947"<strong>The</strong> Ratio Detector", J. Avins, RCA Licensee Bulletin LB-710 (May26) 1947"<strong>The</strong> Ratio Detector", S. W. Seeley and J. Avins, RCA REVIEW(June) 1947"An Analysis of Modern Antennas for FM and Television Reception",M. Kaufman, RCA Rad. Serv. Ne.ws (June-July) 1947"A Non-Directional Antenna for Mobile Field Strength Measurementsin the FM Band", B. W. Robins, Broadcast <strong>New</strong>s (June) 1947"Triplex Antenna for Television and FM", L. J. Wolf, Electronics(July) 1947"Frequency Modulation and Control By Electron Beams", L. P. Smithand Carl I. Shulman, Proc. I.R.E. (July) 1947"A Frequency-Modulated Magnetron for Super-High Frequencies",G. R. Kilgore, Carl I. Shulman and J. Kurshan, Proc. I.R.E. (July) 1947"A 1-Kilowatt Frequency-Modulated Magnetron for 900 Megacycles",J. S. Donal, Jr., R. R. Bush, C. L. Cuccia, and H. R. Hegbar,Proc. I.R.E. (July) 1947"Generalized <strong>The</strong>ory of Multitone Amplitude and Frequency Modulation",L. J. Giacoletto, Proc. I.R.E. (July) 1947"Servicing FM Receivers", M. Kaufman, <strong>Radio</strong> Maintenance, "Part I—Basic <strong>The</strong>ory" (July) 1947"Part II—Conventional Circuits" (August) 1947"Part III—FM Detectors" (September) 1947
512 FREQUENCY MODULATION, Volume 1"An FM Quality Speaker", G. E. Rand, Broadcast <strong>New</strong>s (September) . 1947"An Analysis of PM Servicing", N. L. Chalfm, RCA Rad. Serv. <strong>New</strong>s(October-November) 1947"Variation of Bandwidth with Modulation Index in Frequency Modulation",M. S. Corrington, Proc. I.R.E. (October) 1947"10.7 Megacycle FM Intermediate Frequency Signal Generator", W. R.Alexander, RCA Licensee Bulletin LB-737 (November 10) 1947"Ratio Detectors for FM Receivers", S. W. Seeley, FM and Tele.(December) 1947"Slot Antennas", N. E. Lindenblad, Proc. I.R.E. (December) 1947
APPENDIX IIFM STATION PLACEMENT AND FIELDSURVEY TECHNIQUES<strong>The</strong> ever-increasing number of FM stations now in the planning stagehas focused attention on the difficult problems of station placement and fieldsurvey work. It is considered both appropriate and timely to include herewitha bibilography of material relating to these problems with the assurancethat this guide will assist to some degree in the solution of theseproblems."Selecting a Site for an FM Station"*, John P. TaylorJ, Broadcast<strong>New</strong>s (January) 1945.Summary— This paper treats with the problem of choosing anappropriate station location from a very practical point of view.First, the factors to be considered are discussed in some detailincluding technical requirements, importance of central location,height, and other practical considerations. <strong>The</strong>n, various typesof FM sites are covered including tall buildings, mountain tops,AM towers and special structures.N. J.Decimal Classification: R630.ll x R630.2Engineering Products Department, RCA Victor Division, Camden,'How to Determine the Area an FM Station Should Serve"-, JohnP. TaylorJ, Broadcast <strong>New</strong>s (June) 1945.Summary— Details of the procedure to be followed in determiningthe "trade area" and "service area" of an FM station arecovered in this paper. <strong>The</strong> problems dealt with for both the firstand subsequent applicants for a particular area. Sources of"trade area" charts and maps are given, and the use of thesemaps is discussed. <strong>The</strong> problems of "limited trade area" andother classes of stations are also covered.* Decimal Classification : R630.llt See previous paper."How to Determine the Required Transmitter Power of an FMStation"*, John P. Taylort, Broadcast <strong>New</strong>s (June) 1945.Summary—<strong>The</strong> method of calculating the transmitter powerrequired to provide coverage of a specified service area whenthe antenna elevation and gain are known is discussed in thispaper. Topics covered include: starting^ data, obtaining topographicmaps, drawing the radials, other sources of elevationdata, determining coverage for a given power, coverage in eightdirections, effect of a callable transmitter power, and simulta'ne-513
514 FREQUENCY MODULATION, Volume Ioris consideration of power and location. Appropriate chartsand tables are also included.* Decimal Classification : R630.ll.:|: See previous papers.'Range Prediction Chart for FM Stations"*, F. C. Everettf, Communications(November) 1945.Broadcast <strong>New</strong>s (reprinted from Communications) . . . (January) 1946.Summary— <strong>The</strong> chart makes it possible to determine the signalsthat can be expected with various powers, antenna heights anddistances. Heights indicated are those of transmitting antennaover average terrain to point in question and receiving antennaheight of 30 feet. Several examples of the use of the chart areincluded.* Decimal Classification : R630.ll.| Engineering Department, National Broadcasting Co., Inc., <strong>New</strong> York,N. Y."How to Make a Field Survey of an FM Station"*, G. W. KlingamanJ,Broadcast <strong>New</strong>s (June) 1946.Summary— This article discusses the mechanics involved inmaking a practical field survey for an FM station and presentstypical data from surveys which have been made. Topics coveredinclude: methods, equipment, making the survey, organizing thedata, and discussion of the results. (See also next paper)* Decimal Classification: R270 x R630.ll.t Engineering Products Department, RCA Victor Division, Camden,N. J."A Discussion of FM Field Survey Methods"*, Broadcast <strong>New</strong>s(June) 1946.Summary— This paper carries a reprint of Section 5 of the FCC's"Standard of Good Engineering Practise Concerning FM BroadcastStations" and disqusses FM field survey methods in the lightof these standards. <strong>The</strong> paper includes sections on methods ofmaking mobile recordings, method of analyzing recordings,determining the 1000 po/m contour, determining the 50 pv/mcontour, determining the interference area, maps, exhibits, etc.Procedures outlined by the FCC differ slightly from those describedin the preceding paper and these slight differences shouldbe noted.* Decimal Classification: R270 x R630.ll.
STATION PLACEMENT AND FIELD SURVEY 515'Determining the Population Served by an FM Station"*, Broadcast<strong>New</strong>s (October) 1946.Summary— <strong>The</strong> method of using Minor Civil Division Maps andPopulation Bulletins' in determining population within the practicalservice area of an FM station is discussed. This informationis required when applying for FM Construction Permits. <strong>The</strong>various steps in the required procedure are clearly outlinedand explained.Decimal Classification:R630.ll.'A Non-Directional Antenna for Mobile Field Strength Measurementsin the FM Band"*, B. W. Robinst, Broadcast <strong>New</strong>s (June) 1947.Summary— FCC "Standards" require the use of a non-directionalreceiving antenna when making field strength measurements ofFM Broadcast Stations. Such an antenna, capable of being usedwith the Standard Field Intensity Meter is described in thispaper. <strong>The</strong> antenna is of simple arrangement but must be tailormadeto fit conditions. Hence, it is not a regularly manufactureditem. <strong>The</strong> experimental work on and with this antenna is described,however, so that station engineers may adapt its principlesfor their own specific purposes. <strong>The</strong> paper includes antennaspecifications, mounting problems, and a number of representativepatterns obtained through its use.* Decimal Classification: R630.ll.% Engineering Products Department, RCA Victor Division, Camden,N. J.