Reactive Nitrogen Compounds in the Arctic
Reactive Nitrogen Compounds in the Arctic
Reactive Nitrogen Compounds in the Arctic

You also want an ePaper? Increase the reach of your titles
YUMPU automatically turns print PDFs into web optimized ePapers that Google loves.
JOURNAL OF GEOPHYSICAL RESEARCH, VOL. 90, NO. D6, PAGES 10,739-10,743, OCTOBER 20, 1985<br />
<strong>Reactive</strong> <strong>Nitrogen</strong> <strong>Compounds</strong> <strong>in</strong> <strong>the</strong> <strong>Arctic</strong><br />
RUSSELL R. DICKERSON<br />
Department of Meteorology, University of Maryland, College Park<br />
Measurements of NO, NOx (NO + NO2), and NOy (NO. + 2N205 + NO3 + HONO + HO2NO2 +<br />
PAN + R-ONOx) were made <strong>in</strong> March 1983 between 200 and 12,000 m altitude on several flights <strong>in</strong> <strong>the</strong><br />
<strong>Arctic</strong> and from Spitsbergen, Norway, to Cologne, West Germany. NO values were always below <strong>the</strong><br />
detection limit (10 ppt); NO, values (determ<strong>in</strong>ed with a FeSO4 converter) were high, -600 ppt, <strong>in</strong> <strong>the</strong><br />
boundary layer and generally decreased sharply with altitude, although dist<strong>in</strong>ct strata of high NOr<br />
were observed at altitudes up to 8000 m. NO s (measured with a 425øC Mo converter) showed altitude<br />
profiles similar to NO, profiles with boundary layer values as high as 1500 ppt. Ratios of NO. to NOy<br />
were 0.81 near <strong>the</strong> surface and 0.46 at 6400 m, probably ow<strong>in</strong>g to higher levels of PAN or o<strong>the</strong>r organic<br />
compounds <strong>in</strong> <strong>the</strong> free troposphere. The possible global impact of high concentrations of reactive<br />
nitrogen compounds <strong>in</strong> <strong>the</strong> <strong>Arctic</strong> is discussed.<br />
INTRODUCTION<br />
<strong>Reactive</strong> nitrogen compounds exert a profound effect on<br />
<strong>the</strong> chemistry of <strong>the</strong> atmosphere. They contribute to <strong>the</strong><br />
acidity of precipitation and catalyze <strong>the</strong> photooxidation of<br />
carbon monooxide and hydrocarbons to form ozone [Crut-<br />
zen, 1973; Chameides and Walker, 1973]. Large amounts of<br />
NOx (NO + NO2) are produced by combustion, but most of<br />
this pollution rema<strong>in</strong>s <strong>in</strong> <strong>the</strong> planetary boundary layer (PBL)<br />
because NOx is quickly removed by ei<strong>the</strong>r dry deposition or<br />
photochemical conversion to HNO3 followed by dry and wet<br />
deposition [Logan, 1983; Fishman and Crutzen, 1978].<br />
In <strong>the</strong> <strong>Arctic</strong> w<strong>in</strong>ter <strong>the</strong>se removal mechanisms are largely<br />
absent. Without solar UV radiation <strong>the</strong>re is little photochem-<br />
ical activity, and <strong>the</strong> absolute humidity is so low that<br />
precipitation is virtually nonexistent. Crutzen and Gidel<br />
[1983] predicted large concentrations of tropospheric NOy <strong>in</strong><br />
<strong>the</strong> <strong>Arctic</strong> w<strong>in</strong>ter. <strong>Reactive</strong> nitrogen compounds transported<br />
Particulate nitrate, NO3-, is unlikely to contribute significantly<br />
to <strong>the</strong> NOy levels reported here. If we assume that all<br />
particles with a diameter less than 1.0 tam are collected by<br />
to <strong>the</strong> <strong>Arctic</strong> <strong>in</strong> <strong>the</strong> w<strong>in</strong>ter are likely to rema<strong>in</strong> <strong>in</strong> <strong>the</strong><br />
troposphere until spr<strong>in</strong>g unless <strong>the</strong>y are transported to lower<br />
latitudes. In this manner <strong>Arctic</strong> air, especially <strong>in</strong> <strong>the</strong> free<br />
2<br />
. , [,<br />
troposphere, can act as a reservoir for odd nitrogen and<br />
represent a globally important source of tropospheric NOx.<br />
This article presents <strong>the</strong> first profiles of reactive nitrogen<br />
compounds measured <strong>in</strong> <strong>the</strong> remote <strong>Arctic</strong>.<br />
IO<br />
21 MARCH 1983<br />
EXPERIMENTAL<br />
Details of <strong>the</strong> chemilum<strong>in</strong>escent NO <strong>in</strong>strument have been<br />
presented elsewhere [Delany et al., 1982; Dickerson, 1984'<br />
Dickerson et al., 1984] but will be summarized here. NO is 6<br />
detected directly with a detection limit for a 20-s <strong>in</strong>tegration<br />
time ofabout 10ppt (S'N = 1' 1 for +-2rrnoise). NOx (NO +<br />
NO2) is detected after conversion to NO <strong>in</strong> a FeSO4 converter.<br />
Known <strong>in</strong>terferences <strong>in</strong>clude HONO and PAN; <strong>the</strong> latter<br />
is converted with only about 10% efficiency. Nitrous oxide,<br />
N20, has recently been tested <strong>in</strong> this laboratory and found to<br />
4<br />
be converted to NO with an efficiency of less than 5 x 10 -7.<br />
Tests of organic nitrates and nitrites are currently be<strong>in</strong>g<br />
conducted. NOy (NOx + 2xN205 + NO3 + HONO +<br />
2<br />
HO2NO2 + PAN + R-ONOx) is detected after conversion to<br />
NO on a hot (425øC) Mo converter. R-ONOx represents<br />
o<br />
0 400 800 1200 1600 2000<br />
organic N conta<strong>in</strong><strong>in</strong>g compounds o<strong>the</strong>r than PAN. In <strong>the</strong>se<br />
NOy (ppt)<br />
Copyright 1985 by <strong>the</strong> American Geophysical Union.<br />
Paper number 5D0387.<br />
0148-0227/85/005D-0387502.00<br />
10,739<br />
experiments, nitric acid is assumed removed by <strong>the</strong> 1.5-mlong<br />
sta<strong>in</strong>less steel <strong>in</strong>let tube [Goldan et al., 1983].<br />
Uncerta<strong>in</strong>ty <strong>in</strong> NOy measurements depends on several<br />
factors [Dickerson et al., 1984], <strong>in</strong>clud<strong>in</strong>g a background<br />
signal from <strong>the</strong> converter. This effect was accounted for by<br />
mak<strong>in</strong>g measurements with zero air before and after <strong>the</strong><br />
flights, but it limits <strong>the</strong> precision of <strong>the</strong> measurements to 50<br />
ppt. Inlet l<strong>in</strong>e losses of species such as N205, R-ONOx, and<br />
HO2NO2 under widely vary<strong>in</strong>g temperature, pressure, and<br />
humidity are unknown; thus <strong>the</strong> absolute accuracy of NOy<br />
measurements cannot be stated with certa<strong>in</strong>ty but is probably<br />
with<strong>in</strong> a factor of 2. The values that follow can be<br />
considered reasonable lower limits.<br />
8<br />
2<br />
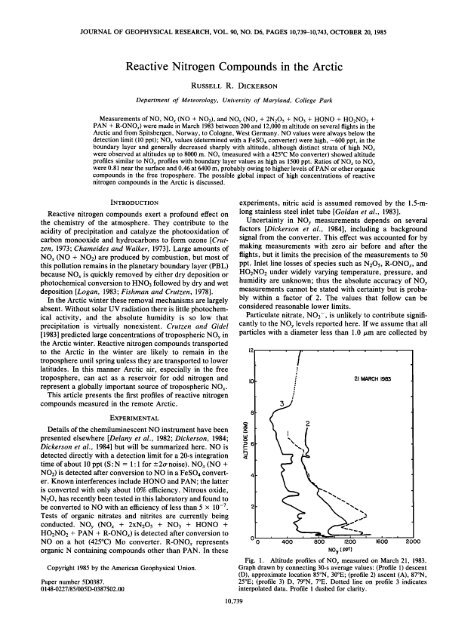
Fig. 1. Altitude profiles of NOy measured on March 21, 1983.<br />
Graph drawn by connect<strong>in</strong>g 30-s average values: (Profile 1) descent<br />
(D), approximate location 85øN, 30øE; (profile 2) ascent (A), 87øN,<br />
25øE; (profile 3) D, 79øN, 7øE. Dotted l<strong>in</strong>e on profile 3 <strong>in</strong>dicates<br />
<strong>in</strong>terpolated data. Profile 1 dashed for clarity.
I.d 4<br />
I--<br />
0<br />
5<br />
w 4<br />
t-<br />
0<br />
I<br />
2<br />
2.3 MARCH 198.3<br />
i<br />
i i i<br />
400 800 1200 1600 2000<br />
(0)<br />
800 i i 1200 i i I io 0 i 2000<br />
(o)<br />
, I , ,<br />
- 5,o ,L 4,0 ,-3.b ø.c '<br />
i<br />
200 400 600 800 I000<br />
o , , , i , , , , , i i<br />
0 200 400 600 800 I000 200 400 600 800 I000 200 4 O0 600 800 I000<br />
(0) (0)<br />
NOy (ppt)<br />
i , ,<br />
Fig. 2. Same as Figure 1 but for March 23, 1983. Profiles are as follows: (1) D, 77.5øN, 7øE; (2) A, 77øN, 3øE; (3) A,<br />
78øN, 0øE; (4) A, 82øN, 0øE; (5) D, 84øN, 0øE; (6) A, 85øN, 0øE; (7) D, 84øN, 6øE; (8) A, 83øN, 9øE; (9) D, 81.5øN, 12.5øE;<br />
(10) A, 80øN, 13øE; (11) D, 79øN, 11.5øE. Profile 5 has temperature plotted as well. Note that changes <strong>in</strong> NOv<br />
concentration correspond to strata <strong>in</strong>dicated by changes <strong>in</strong> lapse rate.<br />
o<br />
o o<br />
o<br />
I i i ß<br />
i i i i i i I<br />
200 400 600 8O0<br />
' i i i ! i i i i<br />
200 400 600 800<br />
io00 200 400 600 800 iooo<br />
(0) (0)<br />
Iooo i 200 i i 4 )o i 60O i i 800 i i Iooo<br />
(o) (o)<br />
NOx--NOy - (ppt)<br />
i i i i<br />
i i i i i , , i<br />
200 400 600 8O0<br />
i<br />
iooo<br />
200 i i 400 i ' 6 ) 0 , 800 , , iOO0<br />
Fig. 3. Altitude profiles for March 24, 1983. Heavy l<strong>in</strong>es <strong>in</strong>dicate NOv; light l<strong>in</strong>es <strong>in</strong>dicate NO,. Profiles are as<br />
follows: (1) D, 80øN, 24øE; (2) A, 81øN, 27øE; (3) D, 82.5øN, 27øE; (4) D, 83øN, 24øE; (5) D, 83øN, 11øE; (6) A, 82øN,<br />
10øE; (7) D, 80.5øN, 10øE; (8) A, 79øN, 10øE; (9) D, 78øN, 10øE; (10) A, 76.5øN, 10øE; (11) D, 75øN, 12øE; (12) A, 74øN,<br />
12.5øE. Note <strong>in</strong>crease <strong>in</strong> concentration between profiles 10 and 11 as aircraft passes through warm front <strong>in</strong>to region of<br />
circulation from eastern Europe.
::)6<br />
90 85 80 75 70 60N<br />
DICKERSON: BRIEF REPORT 10,741<br />
o 12 I 24 MARCH 198.3<br />
8<br />
4<br />
i i , i<br />
0 0 400 800 1200 16)0 2000<br />
NO x -- NOy --- (ppt)<br />
Fig. 5. Same as Figure 3. Profiles are as follows: (12) A, 74øN,<br />
12.5øE; (13) A, 72øN, 17øE; (14) D, 70øN, 19øE. Touchdown <strong>in</strong><br />
Troms½, Norway, followed profile 14.<br />
15<br />
?_4-25 MARCH 1983<br />
0 I I ] I I[[ I I I f I I<br />
0 I .0 Z.O $.0 4.0 5.0<br />
NOx-- NOy (ppb)<br />
30E Fig. 6. Observations recorded on descent and land<strong>in</strong>g <strong>in</strong> Cologne,<br />
Federal Republic of Germany (51øN, 7øE). Heavy l<strong>in</strong>es are<br />
lOW 0 IOE 20E<br />
Fig. 4. Surface isobar analysis for 0600 UT, tviarch 24, 1983.<br />
Between fly<strong>in</strong>g profiles 10 and 11 of Figure 3 <strong>the</strong> aircraft passed<br />
NOy; light l<strong>in</strong>es, NOx. The tropopause as <strong>in</strong>dicated by temperature<br />
and o7one concentration was located at about 9 km.<br />
through <strong>the</strong> warm front shown; o<strong>the</strong>r fronts have been omitted <strong>in</strong> <strong>the</strong><br />
<strong>in</strong>terest of clarity. Dashed l<strong>in</strong>e depicts flight path. Isobars drawn at<br />
5-mbar <strong>in</strong>tervals based on <strong>the</strong> Berl<strong>in</strong>er Wetterkarte' Freien Univer-<br />
Uncerta<strong>in</strong>ty <strong>in</strong> NOx measurements also depends on <strong>the</strong><br />
background signal, but this effect was generally much smallsitfit<br />
Berl<strong>in</strong>.<br />
er than for NOy. Air samples with dew po<strong>in</strong>ts below -25øC<br />
<strong>the</strong> backward fac<strong>in</strong>g sample <strong>in</strong>let tube and that <strong>the</strong>y are<br />
converted by <strong>the</strong> molybdenum catalyst with 100% efficiency,<br />
<strong>the</strong>n <strong>the</strong> nitrate levels reported by Radke et al. [1984] would<br />
contribute only about 60 ppt NOy <strong>in</strong> haze layers and 10 times<br />
can significantly reduce <strong>the</strong> response time of <strong>the</strong> <strong>in</strong>strument<br />
<strong>in</strong> <strong>the</strong> NOx mode, although <strong>the</strong> conversion efficiency is<br />
apparently unaffected. At <strong>the</strong> low dew po<strong>in</strong>ts encountered <strong>in</strong><br />
<strong>the</strong> upper troposphere of <strong>the</strong> <strong>Arctic</strong> <strong>the</strong> response time was of<br />
<strong>the</strong> order of 2 m<strong>in</strong>. The estimated absolute accuracy of NOx<br />
less <strong>in</strong> clear air.<br />
measurements above 50 ppt is -+40%.<br />
I ! ! ! i i i ! !<br />
A Hawker Siddeley 125 tw<strong>in</strong> eng<strong>in</strong>e jet was leased by <strong>the</strong><br />
Max Planck Institute for Chemistry, Ma<strong>in</strong>z, West Germany,<br />
13<br />
for <strong>the</strong> <strong>Arctic</strong> flights. Location, altitude, and temperature<br />
were recorded by hand from <strong>the</strong> aircraft <strong>in</strong>struments.<br />
RESULTS AND DISCUSSION<br />
High concentrations of reactive nitrogen compounds were<br />
frequently encountered on <strong>the</strong> flights <strong>in</strong> <strong>the</strong> <strong>Arctic</strong>. As<br />
shown <strong>in</strong> Figures 1-3, <strong>the</strong> lower 1.0 km of <strong>the</strong> atmosphere<br />
typically conta<strong>in</strong>ed about 700 ppt N Oy, most of which was<br />
NOx. This is several times higher than has been found <strong>in</strong><br />
o<strong>the</strong>r remote locations <strong>in</strong> <strong>the</strong> nor<strong>the</strong>rn hemisphere [e.g.,<br />
Kelly et al., 1980; Helas and Warneck, 1981; Boll<strong>in</strong>ger et al.,<br />
1984]. Dist<strong>in</strong>ct strata of high concentrations of both NOx and<br />
NOy existed <strong>in</strong> <strong>the</strong> free troposphere at altitudes up to 8 km.<br />
High levels of reactive nitrogen compounds were accompanied<br />
by high levels of CO, H2, and CO2 (W. Seiler, private<br />
communication, 1983), mak<strong>in</strong>g combustion <strong>the</strong> primary can-<br />
didate for a source.<br />
NO was always below <strong>the</strong> detection limit of <strong>the</strong> <strong>in</strong>strument,<br />
-- 10 ppt. This may seem surpris<strong>in</strong>g <strong>in</strong> view of <strong>the</strong> high<br />
NO2 levels encountered, but <strong>the</strong> <strong>in</strong>tensity of UV radiation<br />
was always very low. On <strong>the</strong> equ<strong>in</strong>ox at 80øN <strong>the</strong> sun is<br />
never more than 10 ø above <strong>the</strong> horizon. The frequency of<br />
NO2 photolysis at this zenith angle is difficult to measure or<br />
calculate [Dickerson et al., 1982; Parrish et al., 1983] but is<br />
surely very slow. In addition, <strong>the</strong> ratio of NO2 to NO is often
10,742 DICKERSON: BRIEF REPORT<br />
much higher than is predicted by a simple NO-NO2-O3 On descent <strong>in</strong>to Cologne (Figure 6) <strong>the</strong> highest NO v and<br />
photostationary state [Kelly et al., 1980]. Such low NO NO concentrations of <strong>the</strong> entire project were encountered.<br />
levels <strong>the</strong>n are reasonable.<br />
These could be <strong>the</strong> result of air traffic <strong>in</strong> <strong>the</strong> vic<strong>in</strong>ity of <strong>the</strong><br />
Pollutants <strong>in</strong> <strong>the</strong> <strong>Arctic</strong> air exist <strong>in</strong> strata not because <strong>the</strong>y airport or convective transport of polluted PBL air. Towerare<br />
released locally at dist<strong>in</strong>ct altitudes but because <strong>the</strong>y are <strong>in</strong>g cumulus and snow showers were reported <strong>in</strong> Cologne<br />
transported <strong>the</strong>re <strong>in</strong> well-def<strong>in</strong>ed air strata. Figure 2 shows a<br />
temperature profile recorded <strong>in</strong> parallel with NOy concentra-<br />
(Berl<strong>in</strong>er Wetterkarte, March, 24 and 25, 1983).<br />
tions. At least five dist<strong>in</strong>ct air strata are apparent from <strong>the</strong><br />
vary<strong>in</strong>g lapse rates. An extremely stable layer <strong>in</strong> <strong>the</strong> first few<br />
CONCLUSIONS<br />
hundred meters existed, followed by an iso<strong>the</strong>rmal layer up High concentrations of reactive nitrogen compounds have<br />
to about 1.2 km, designated as <strong>the</strong> PBL. Above this altitude been predicted to exist <strong>in</strong> <strong>the</strong> <strong>Arctic</strong> w<strong>in</strong>ter. The measure<strong>the</strong><br />
air becomes less stable, and <strong>the</strong> concentration of NOy ments reported here confirm <strong>the</strong>se predictions and suggest<br />
drops off. Between 2.6 and 4.3 km <strong>the</strong>re was an air mass with that <strong>the</strong> <strong>Arctic</strong> troposphere may act as a reservoir for NO<br />
a uniform lapse rate conta<strong>in</strong><strong>in</strong>g high pollutant levels; above and that this NOx may be transported to <strong>the</strong> remote regions<br />
4.3 km <strong>the</strong> temperature decreases ra<strong>the</strong>r quickly with alti- where it can <strong>in</strong>crease global ozone production from tropostude,<br />
and <strong>the</strong> new air mass was markedly cleaner. The phereic photochemistry. Pollutants existed <strong>in</strong> <strong>the</strong> boundary<br />
results of this study testify that polluted layers are common layer and <strong>in</strong> dist<strong>in</strong>ct layers at higher elevations. These strata<br />
<strong>in</strong> <strong>the</strong> <strong>Arctic</strong>, at least <strong>in</strong> <strong>the</strong> early spr<strong>in</strong>g when solar heat<strong>in</strong>g is are <strong>the</strong> result of air mass transport at dist<strong>in</strong>ct altitudes up to<br />
very low.<br />
about 8 km. Movement of air masses along l<strong>in</strong>es of constant<br />
On 13 profiles both NOx and NOy were measured at <strong>the</strong><br />
bottom (---0.2 km) and top (--6.4 km) of <strong>the</strong> flight pattern.<br />
potential temperature could account for <strong>the</strong>se high strata.<br />
The ratio of NOx to NOy decreases significantly with alti-<br />
This affords <strong>the</strong> opportunity to compare NOx to NOy ratios tude. Photochemical calculations suggest that this NOy is not<br />
<strong>in</strong> <strong>the</strong> PBL to ratios <strong>in</strong> <strong>the</strong> free troposphere. The results were composed of N205 but more likely PAN, HO2NO2 or some<br />
0.81 +- 0.2 (-+ 1 standard deviation) <strong>in</strong> <strong>the</strong> PBL and 0.46 +_ 0.2 R-ONO. Although <strong>the</strong> observations and calculations report<strong>in</strong><br />
<strong>the</strong> free troposphere. Recall<strong>in</strong>g that HNO3 was probably ed here give a strong <strong>in</strong>dication that <strong>the</strong> chemistry of <strong>the</strong><br />
efficiently removed by <strong>the</strong> sta<strong>in</strong>less steel <strong>in</strong>let system, <strong>the</strong>se <strong>Arctic</strong> troposphere can significantly affect global atmospherratios<br />
argue <strong>in</strong> favor of high concentrations of some o<strong>the</strong>r ic chemistry, <strong>the</strong> data are far too sparse <strong>in</strong> temporal and<br />
reactive nitrogen compounds <strong>in</strong> <strong>the</strong> free troposphere. N205, spatial scale to draw any general conclusions about mean or<br />
PAN, R-ONO, and HO2NO2 are likely candidates.<br />
It is possible to calculate <strong>the</strong> amount of N205 expected to<br />
be present <strong>in</strong> <strong>the</strong>se measurements by assum<strong>in</strong>g steady state,<br />
seasonal pollution levels; fur<strong>the</strong>r <strong>in</strong>vestigation is called for.<br />
that NO2, NO3, and N205 are <strong>the</strong> only species detected, and Acknowledgments. The author wishes to thank R. Schnell and<br />
that toge<strong>the</strong>r <strong>the</strong>y compose NOy. The strong temperature B. Ottar for help<strong>in</strong>g to organize <strong>the</strong> <strong>Arctic</strong> research expeditions and<br />
Conti-Flug GmbH, Cologne, for <strong>the</strong>ir helpful cooperation on <strong>the</strong><br />
dependence of N205 dissociation and <strong>the</strong> difficulty <strong>in</strong> calcuflights.<br />
Assistance from P. Crutzen, L. Nunnermacker, W. Seller,<br />
lat<strong>in</strong>g accurate NO3 photolysis rates make <strong>the</strong> results very and F. Slemr is also acknowledged. This work was supported <strong>in</strong> part<br />
uncerta<strong>in</strong>, but if <strong>the</strong>y are correct, <strong>the</strong>n N205 contributed less by NSF grant ATM-83-05843 and <strong>the</strong> Max Planck Institute for<br />
than $% to <strong>the</strong> total odd nitrogen observed at 6.4 km. Details<br />
of <strong>the</strong> steady state calculation are available from <strong>the</strong> author.<br />
PAN has been measured <strong>in</strong> <strong>the</strong> range of hundreds of ppt <strong>in</strong><br />
Chemistry <strong>in</strong> Ma<strong>in</strong>z, West Germany.<br />
<strong>the</strong> free troposphere [S<strong>in</strong>gh and Salas, 1983] and may well<br />
REFERENCES<br />
be present <strong>in</strong> similar concentrations <strong>in</strong> <strong>the</strong> <strong>Arctic</strong>.<br />
Boll<strong>in</strong>ger, M. J., C. J. Hahn, D. D. Parrish, P. C. Murphy, D. L.<br />
On <strong>the</strong> return flight to Troms6, Norway, a dramatic Albritton, and F. C. Fehsenfeld, NO. measurements <strong>in</strong> clean<br />
cont<strong>in</strong>ental air and analysis of <strong>the</strong> contribut<strong>in</strong>g meteorology, J.<br />
<strong>in</strong>crease <strong>in</strong> NOy was observed as <strong>the</strong> aircraft crossed 76øN, Geophys. Res., 89, 9623-9631, 1984.<br />
as shown <strong>in</strong> profiles 10 and 11 of Figure 3. A surface analysis Chameides, W., and J. C. G. Walker, A photochemical <strong>the</strong>ory of<br />
(Figure 4) shows a warm front extend<strong>in</strong>g to higher altitudes tropospheric ozone, J. Geophys. Res., 78, 8751-8760, 1973.<br />
with a def<strong>in</strong>ite change of air mass at 76øN. This front was Crutzen, P. J., A discussion of <strong>the</strong> chemistry of some m<strong>in</strong>or<br />
visible from <strong>the</strong> aircraft as a wall of clouds. A trajectory<br />
analysis by visual <strong>in</strong>spection of <strong>the</strong> 500- and 850-mbar maps<br />
suggests that this air orig<strong>in</strong>ated <strong>in</strong> eastern Europe. This air is<br />
constituents <strong>in</strong> <strong>the</strong> stratosphere and troposphere, Pure Appl.<br />
Geophys., 106, 1385-1399, 1973.<br />
Crutzen, P. J., and L. T. Gidel, A two-dimensional photochemical<br />
model of <strong>the</strong> atmosphere, 2, The tropospheric budgets of <strong>the</strong><br />
significantly more polluted than <strong>the</strong> air north of <strong>the</strong> front. anthropogenic chlorocarbons CO, CH4, CH3Cl and <strong>the</strong> effect of<br />
Back trajectories and factor analysis of particulate samples various NO sources on tropospheric ozone, J. Geophys. Res.,<br />
often <strong>in</strong>dicate eastern Europe as a source of <strong>Arctic</strong> haze<br />
[e.g., Rahn, 1981].<br />
<strong>Reactive</strong> nitrogen compounds, when located at <strong>the</strong> top of<br />
88, 6641-6661, 1983.<br />
Delany, A. C., R. R. Dickerson, F. L. Melchior, and A. F.<br />
Wargburg, Modification of a commercial NO detector for high<br />
sensitivity, Rev. Sci. Instrurn., 53, 1899-1902, 1982.<br />
<strong>the</strong> troposphere, have a much longer lifetime and can have a Dickerson, R. R., Measurements of reactive nitrogen compounds <strong>in</strong><br />
broader effect on global atmospheric chemistry. Figure 5<br />
shows that strata of NO and NOy exist as high as 6-8 km.<br />
This figure also shows that NOy concentrations drop off<br />
<strong>the</strong> free troposphere, Atrnos. Environ., 18, 2585-2593, 1984.<br />
Dickerson, R. R., D. H. Stedman, and A. C. Delany, Direct<br />
measurements of ozone and nitrogen dioxide photolysis rates <strong>in</strong><br />
<strong>the</strong> troposphere, J. Geophys. Res., 87, 4933-4946, 1982.<br />
above <strong>the</strong> tropopause, located at about 10 km on this profile. Dickerson, R. R., A. C. Delany, and A. F. Wartburg, Fur<strong>the</strong>r<br />
Between Troms6 and Cologne <strong>the</strong> aircraft flew at about 12 modification of a commercial NOx detector for high sensitivity,<br />
km altitude, well <strong>in</strong>to <strong>the</strong> stratopshere. NOy levels were<br />
fairly uniform at 200-300 ppt. This is <strong>in</strong> reasonable agreement<br />
with <strong>the</strong> model of Crutzen and Gidel [1983] if HNO3 is<br />
Rev. Sci. Instrum., 55, 1995-1998, 1984.<br />
Fishman, J., and P. J. Crutzen, The orig<strong>in</strong> of ozone <strong>in</strong> <strong>the</strong> troposphere,<br />
Nature, 274, 855, 1978.<br />
Goldan, P. D., W. C. Kuster, D. L. Albritton, F. C. Fehsenfeld, P.<br />
substracted from <strong>the</strong> calculated NOy.<br />
S. Connell, and R. B. Norton, Calibration and tests of <strong>the</strong> filter-
collection method for measur<strong>in</strong>g clean-air, ambient levels of nitric<br />
acid, Atmos. Environ., 17, 1355-1364.<br />
Helas, G., and P. Warneck, Background NO mix<strong>in</strong>g ratios <strong>in</strong> air<br />
masses over <strong>the</strong> North Atlantic Ocean, J. Geophys. Res., 86,<br />
7283-7290, 1981.<br />
Kelly, T. J., D. H. Stedman, J. A. Ritter, and R. B. Harvey,<br />
Measurements of oxides of nitrogen and nitric acid <strong>in</strong> clean air, J.<br />
Geophys. Res., 85, 7417-7425, 1980.<br />
Logan, J. A., <strong>Nitrogen</strong> oxides <strong>in</strong> <strong>the</strong> troposphere: Global and<br />
regional budgets, J. Geophys. Res., 88, 10785-10807, 1983.<br />
Parrish, D. D., P. C. Murphy, D. L. Albritton, and F. C. Fehsenfeld,<br />
The measurement of <strong>the</strong> photodissociation rate of NO2 <strong>in</strong> <strong>the</strong><br />
atmosphere, Atmos. Environ., 17, 1365-1379, 1983.<br />
Radke, L. F., J. H. Lyons, D. A. Hegg, P. V. Hobbs, and I. H.<br />
DICKERSON: BRIEF REPORT 10,743<br />
Bailey, Airborne observations of arctic aerosols, I, Characteris-<br />
tics of arctic haze, Geophys. Res. Lett., 11, 393-396, 1984.<br />
Rahn, K. A., Relative importances of North America and Eurasia as<br />
sources of <strong>Arctic</strong> aerosol, Atmos. Environ., 15, 1337-1457, 1981.<br />
S<strong>in</strong>gh, H. B., and L. J. Salas, Peroxyactyl nitrate <strong>in</strong> <strong>the</strong> free<br />
troposphere, Nature, 302, 326-328, 1983.<br />
R. R. Dickerson, Department of Meteorology, University of<br />
Maryland, College Park, MD 20742.<br />
(Received February 18, 1985;<br />
revised March 26, 1985;<br />
accepted March 29, 1985.)