Transcranial Direct Current Stimulation during Sleep Improves ...
Transcranial Direct Current Stimulation during Sleep Improves ...
Transcranial Direct Current Stimulation during Sleep Improves ...

You also want an ePaper? Increase the reach of your titles
YUMPU automatically turns print PDFs into web optimized ePapers that Google loves.
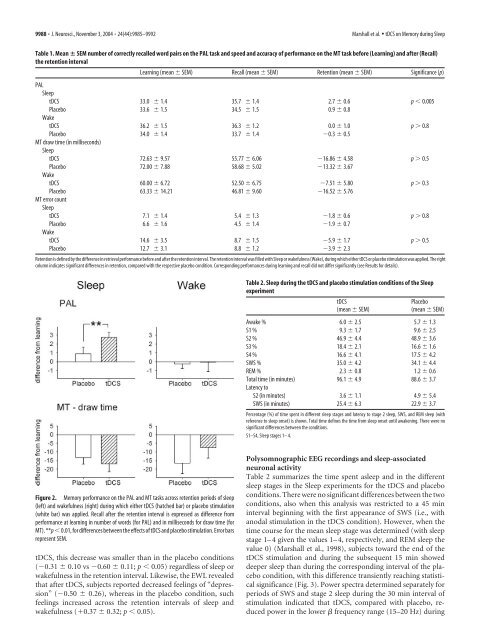
9988 • J. Neurosci., November 3, 2004 • 24(44):9985–9992 Marshall et al. • tDCS on Memory <strong>during</strong> <strong>Sleep</strong>Table 1. Mean SEM number of correctly recalled word pairs on the PAL task and speed and accuracy of performance on the MT task before (Learning) and after (Recall)the retention intervalLearning (mean SEM) Recall (mean SEM) Retention (mean SEM) Significance (p)PAL<strong>Sleep</strong>tDCS 33.0 1.4 35.7 1.4 2.7 0.6 p 0.005Placebo 33.6 1.5 34.5 1.5 0.9 0.8WaketDCS 36.2 1.5 36.3 1.2 0.0 1.0 p 0.8Placebo 34.0 1.4 33.7 1.4 0.3 0.5MT draw time (in milliseconds)<strong>Sleep</strong>tDCS 72.63 9.57 55.77 6.06 16.86 4.58 p 0.5Placebo 72.00 7.88 58.68 5.02 13.32 3.67WaketDCS 60.00 6.72 52.50 6.75 7.51 5.80 p 0.3Placebo 63.33 14.21 46.81 9.60 16.52 5.76MT error count<strong>Sleep</strong>tDCS 7.1 1.4 5.4 1.3 1.8 0.6 p 0.8Placebo 6.6 1.6 4.5 1.4 1.9 0.7WaketDCS 14.6 3.5 8.7 1.5 5.9 1.7 p 0.5Placebo 12.7 3.1 8.8 1.2 3.9 2.3Retentionisdefinedbythedifferenceinretrievalperformancebeforeandaftertheretentioninterval.Theretentionintervalwasfilledwith<strong>Sleep</strong>orwakefulness(Wake),<strong>during</strong>whicheithertDCSorplacebostimulationwasapplied.Therightcolumn indicates significant differences in retention, compared with the respective placebo condition. Corresponding performances <strong>during</strong> learning and recall did not differ significantly (see Results for details).Table 2. <strong>Sleep</strong> <strong>during</strong> the tDCS and placebo stimulation conditions of the <strong>Sleep</strong>experimenttDCS(mean SEM)Placebo(mean SEM)Awake % 6.0 2.5 5.7 1.3S1 % 9.3 1.7 9.6 2.5S2 % 46.9 4.4 48.9 3.6S3 % 18.4 2.1 16.6 1.6S4 % 16.6 4.1 17.5 4.2SWS % 35.0 4.2 34.1 4.4REM % 2.3 0.8 1.2 0.6Total time (in minutes) 96.1 4.9 88.6 3.7Latency toS2 (in minutes) 3.6 1.1 4.9 5.4SWS (in minutes) 25.4 6.3 22.9 3.7Percentage (%) of time spent in different sleep stages and latency to stage 2 sleep, SWS, and REM sleep (withreference to sleep onset) is shown. Total time defines the time from sleep onset until awakening. There were nosignificant differences between the conditions.S1–S4, <strong>Sleep</strong> stages 1–4.Figure 2. Memory performance on the PAL and MT tasks across retention periods of sleep(left) and wakefulness (right) <strong>during</strong> which either tDCS (hatched bar) or placebo stimulation(white bar) was applied. Recall after the retention interval is expressed as difference fromperformance at learning in number of words (for PAL) and in milliseconds for draw time (forMT).**p0.01,fordifferencesbetweentheeffectsoftDCSandplacebostimulation.Errorbarsrepresent SEM.tDCS, this decrease was smaller than in the placebo conditions(0.31 0.10 vs 0.60 0.11; p 0.05) regardless of sleep orwakefulness in the retention interval. Likewise, the EWL revealedthat after tDCS, subjects reported decreased feelings of “depression”(0.50 0.26), whereas in the placebo condition, suchfeelings increased across the retention intervals of sleep andwakefulness (0.37 0.32; p 0.05).Polysomnographic EEG recordings and sleep-associatedneuronal activityTable 2 summarizes the time spent asleep and in the differentsleep stages in the <strong>Sleep</strong> experiments for the tDCS and placeboconditions. There were no significant differences between the twoconditions, also when this analysis was restricted to a 45 mininterval beginning with the first appearance of SWS (i.e., withanodal stimulation in the tDCS condition). However, when thetime course for the mean sleep stage was determined (with sleepstage 1–4 given the values 1–4, respectively, and REM sleep thevalue 0) (Marshall et al., 1998), subjects toward the end of thetDCS stimulation and <strong>during</strong> the subsequent 15 min showeddeeper sleep than <strong>during</strong> the corresponding interval of the placebocondition, with this difference transiently reaching statisticalsignificance (Fig. 3). Power spectra determined separately forperiods of SWS and stage 2 sleep <strong>during</strong> the 30 min interval ofstimulation indicated that tDCS, compared with placebo, reducedpower in the lower frequency range (15–20 Hz) <strong>during</strong>