Jean Abraham - Shadac
Jean Abraham - Shadac
Jean Abraham - Shadac
- No tags were found...

You also want an ePaper? Increase the reach of your titles
YUMPU automatically turns print PDFs into web optimized ePapers that Google loves.
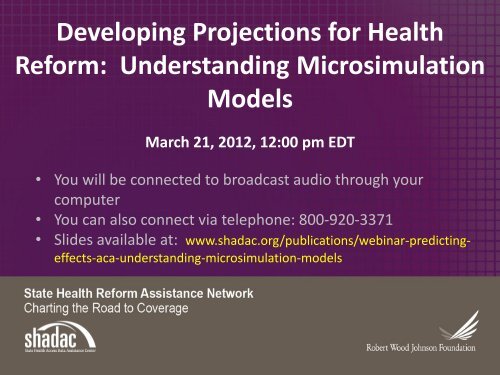
Developing Projections for HealthReform: Understanding MicrosimulationModelsMarch 21, 2012, 12:00 pm EDT• You will be connected to broadcast audio through yourcomputer• You can also connect via telephone: 800-920-3371• Slides available at: www.shadac.org/publications/webinar-predictingeffects-aca-understanding-microsimulation-models
Technical Information• All phones will be muted during the webinar• Submit questions via the chat at any time• Questions will be addressed during the Q&A session• If you’re having trouble with the visual component ofthe webinar:– Call ReadyTalk’s helpline at 800-843-9166– Go to www.shadac.org/signup to view today’s slides asPDFs– Ask for help using the chat feature (if you’re able to log in)
Welcome and Introductions• Lynn Blewett, SHADAC Director• Deborah Bae, RWJF SeniorProgram Officer
Featured Speaker<strong>Jean</strong> <strong>Abraham</strong>Assistant Professor in the Universityof Minnesota’s School of PublicHealth, Division of Health Policy andManagement
Featured SpeakerDanielle HolahanProject Director for Health Insurance ExchangePlanning for New York State
Contact SHADACJoin our mailing list:Visit www.shadac.org and click “Sign Up.”Join us on Facebook and Twitterwww.facebook.com/shadac4states@shadacQuestions about the webinar:Contact Paige Hubbell at phubbell@umn.eduwww.shadac.org
Predicting the Effects of PPACA:A Comparative Analysis ofHealth Policy Microsimulation ModelsMarch 21, 2012<strong>Jean</strong> <strong>Abraham</strong>Lynn BlewettJulie SonierElizabeth Lukanen
• <strong>Jean</strong> <strong>Abraham</strong>Presenter’s Background– Assistant ProfessorDivision of Health Policy & ManagementUniversity of Minnesota– Health Economics and Policy– Senior Economist on President’s Councilof Economic Advisers, 2008-2009
Questions Addressed Today• What are health policy microsimulation models and theirkey components?• What are the similarities and differences among themajor federal health policy models being used withrespect to these components?• When considering different modeling options, whatquestions should states ask?
Major health policy simulation models• Congressional Budget Office• GMSIM (J. Gruber from MIT)• RAND Compare• HIPSM (Urban)• HBSM (Lewin Group)
Methodology• Conducted a comprehensive review ofpublicly-available technical documentation forthe major health policy microsimulationmodels.
Data InfrastructureBehaviorOutcomesPopulationPoliciesIndividuals:• Take-up of employersponsoredinsurance(ESI) and Non-group• Public insuranceenrollment giveneligibilityEmployers:• Offer healthinsurance• Premiums and plangenerosity (employerand employee share)Individuals:• Insurance coveragedistribution (ESI,Medicaid/CHIP, non-group,uninsured) overall and byother attributesEmployers:• % offering health insurance• ESI premiumsGovernment:• Public programparticipation• Public program spending
Data Infrastructure: Individuals and EmployersKey Population Data Sources:1) Current Population Survey Annual Social and Economic Supplement2) Survey of Income and Program Participation3) Medical Expenditure Panel SurveyKey Employer Data Sources:1) Statistics of U.S. Businesses2) National Compensation Survey3) Kaiser Family Foundation/HRET Employer Health Benefits Survey
Data Infrastructure: Building Synthetic FirmsSynthetic Firms: group individuals from population survey data based on theircharacteristics and those of business establishments (e.g., firm size, geography,health insurance offer status). Aligned to reflect distribution of U.S. businesses.Firm 1(n=50)Individual Data(n=500)Firm 2(n=10)Synthetic Firm Data(n=3)Firm 3(n=100)
Model Comparison: Population and Employment DataCBOGMSIM(Gruber)RANDCOMPAREHBSM(LEWIN)HIPSM(URBAN)PopulationSurvey Data2002 SIPP 2005 Feb/MarchCPS2008 SIPP 2002-2005MEPS2009/2010 CPSEmploymentDataBLS NationalCompensationSurveyBLS NationalCompensationSurveyKFF EmployerSurvey;Statistics of U.S.BusinessesKFF EmployerSurvey & 1997RWJF EmployerSurveyStatistics of U.S.BusinessesCalibrationRe-weighted toreflect U.S.populationprojections2008-2017Re-weighted to2008 March CPSRe-weighted toreflect 2010and beyondage-sex-racedistributionRe-weighted to2009 MarchCPS onpopulationattributes andcoverageRe-weightedand adjusted toalign withcoverage,income,expenditures,and firmdistribution asof 2009
Data Infrastructure: PremiumsKey Data Sources:•Medical Expenditure Panel Survey-Household Component•Medical Expenditure Panel Survey-Insurance Component•Kaiser Family Foundation/HRET Employer Health BenefitsSurvey
Data Infrastructure: PremiumsESI Premium Construction:1) Built from expected medical spending among a synthetic firm’sworkers with adjustments made for administrative loads andstate regulation.2) Built from reported premium data (IC or KFF) and adjusted toaccount for actuarial value differences and geography/stateregulations.Individual Market Premium Construction:1) Built from estimated individual health spending with adjustmentfactors for demographics, health status, and geography. Loadingfactor that reflects administrative costs and profits is applied.
ESI Premium Data and ConstructionCBOGMSIM(Gruber)RAND COMPAREHBSM(LEWIN)HIPSM(URBAN)Data 2004 MEPS 2004 MEPS-IC 2007-08 KFF/HRET2002-2003 MEPS2006 KFF/HRET and 1997RWJF Employer HealthInsurance Survey2002-2005 MEPS-HCMEPS-IC2006-2008 MEPS-HCExpectedSpending / CostsExpectedaggregatespending of afirm’s workersIndividual-level costindex based on age,sex, health rating.Averaged oversynthetic firm. Indexmatched up toemployer premiumdistribution to assignpremium to firm.Firm-specific premiums are afunction of experience-ratedand community-ratedestimates. Former usepredicted spending ofworkers and dependents,while the latter use 12 poolsbased on 4 census regionsby 3 firm sizes.Use expenditures ofworkers and apply ratingpractices (e.g., smallgroup market). Alsosimulate premiums forself-funded plans.Built from riskpools fromunderlying healthcare spending.Blend of actualand expectedcosts.Actuarial ValueadjustmentYes (firm size,income, healthstatus)Yes (income, firmsize)Yes (firm size)Yes (comparison ofemployer plan to standardbenefits)Yes (firm size)Loading Fee 27% for 2employee firmto 9% for 100+workersImplicit in premium20%: < 25 workers13%: 25-99 workers8.3% for 100+ workersRanges from40% for 1-4 workers to5.5% for 10,000+ workersYes (industry andfirm size)State-specificinformationRegulatoryenvironmentAccounts for statevariation in premiumsDetails not availableImpute state code toMEPS; small group ratingrulesAccounts forstate variation inspending
Non-Group Premium Data and ConstructionCBOGMSIM(Gruber)RAND COMPAREHBSM(LEWIN)HIPSM(URBAN)ExpectedspendingFactor-basedapproach usinginformation on age,sex, health,experience, andstate.Age-health statusspending distributionfrom MEPS andapplied to CPS.Age-health status riskpools and estimatespending from MEPS forthose reportingindividual coverage.Predict spendingand apply ratingpractices (age, sex,health status).Predicted spendingamong those in nongroupmarket. Modelbased on age, sex,health status, and“typical” rating rules.Loading fee forbaseline29% Fixed load of 15%;Varying loadcomponent equal to30% of averageunloaded non-groupcost, based on ageintervalYes(details not available)40% Yes(details not available)State-specificinformation/adjustmentsYes Yes Yes(approximated)YesYes
Examples of ACA Provisions Modeled• Creation of Exchanges• Premium and cost-sharing subsidies forExchange-based plans• Employer shared responsibility requirements• Medicaid expansion• Individual mandate
How are Policies Simulated?Establish baseline scenario to reflect‘status quo’ regarding premiums andcoverage distribution.Model the behavioral responses ofindividuals and employers to a policychange(s) to arrive at new scenario.Using coverage status information from new scenario,update premiums and other information to estimate outputfor subsequent years.
Approaches toModeling Behavioral Responses• Elasticity-Based Approach– CBO, Gruber, and Lewin– Utilizes findings from empirical health economics and health servicesresearch literatures• Studies on individuals’ price-sensitivity of take-up of coverage– Marquis and Long (1994)– Blumberg, Nichols, and Banthin (2001)• Studies of employers’ price-sensitivity with respect to offering andspending on health insurance– Gruber and Lettau (2004); Gruber and McKnight (2001)» Estimate how changes in the “tax-price” of health insurance affect employerprovision
Simple Example: Elasticity• Availability of an Exchange-based premium subsidyto a low-income single individual without ESI access.– $5,000 premium in the baseline scenario– With application of policy (e.g., subsidy), premiumdecreases 40% to $3,000.– Published estimates from literature on degree of priceresponsivenessused to quantify change in probability of aperson taking up non-group coverage, given a % change inpremium.• Elasticity is -.5.– Probability of purchasing a plan increases 20% (=.5*40%)
Approaches to Modeling Behavior• Utility-Based Approach– RAND, Urban, and Lewin– Individuals can choose among a given number of options (ESI,non-group, public, uninsured)– Utility (satisfaction) of each insurance choice is a function of• Expected out-of-pocket costs• Value of health care consumed• Out-of-pocket premiums• Tax incentives• Out-of-pocket expenses relative to income
Approaches to Modeling Behavior• Utility-Based Approach– Policy shocks are modeled to affect utility of options– Firms’ decision to offer insurance is contingent on workers’total willingness to pay (based on model above) exceedingtotal costs of offering insurance as a fringe benefit(premium and HR administrative fixed costs)– Individuals make coverage decisions based on optionsavailable to them and select the one that maximizes utility– Results are calibrated to ensure that elasticity estimatesare within range of historical estimates
Behavior of IndividualsCBOGMSIM(Gruber)RAND COMPAREHBSM(LEWIN)HIPSM(URBAN)CoverageTake-up (ESI;Non-group;Public;Uninsured)Informed by ESItake-upliterature.Sensitivity variesby income,previousuninsurancestatus, andsubsidy size.Doesn’t assumemany will drop ESIand buy nongroup.Private coveragetake-up amongthose eligible forpublic programs islow.Specifieselasticities ofvarious insurancetransitions, givenbaselineinsurance status(e.g., uninsured tonon-group(-.5).Assumes lowprobability ofmoving from ESIto publicinsurance giveneligibility (Gruberand Simon(2008)).Utility-basedapproach(Goldman et al.)Calibratebehavioralresponses toranges ofestimates for ESItake-up; nongroup/Exchangedemand;MedicaidenrollmentSimulate eligibilityand enrollment inMedicaid.Simulate ESI takeupgiven an offer,based on ownmodeling withMEPSEstimate nongroupdemandagain using ownmodel. Impliedelasticity is -.34and declines withage and income.Updated versionincludes utilitybasedapproachUtility-basedapproach.Existing coverageis assumedoptimal atbaseline.Benchmark thatbehavioralresponsesconsistent withhistorical rangesindicated by Gliedet al. (2003).Model iteratesuntil stable
Behavior of FirmsCBOGMSIM(Gruber)RAND COMPAREHBSM(LEWIN)HIPSM(URBAN)Firm’sDecision toOfferCoveragePrice-sensitivityvaries by firm size(Gruber andLettau, 2004;Hadley andReschovsky, 2002,etc)Price-sensitivityvaries by firm size(Gruber andLettau, 2004)Includes “dampdown”factor tocapture relativeattractiveness ofnon-ESI optionsfor workers.Firm’s decision isa function of costof ESI to employerand workers, taxtreatment, admincosts, and value ofoutside options.Estimatereduced-formmodel using 1997RWJF Employersurvey. Generateoffer elasticitiesby firm size.Offer if workers’total willingnessto pay > totalcosts.Depends onpremiums,penalties, HRcosts, tax subsidy,tax credits.
Output of Microsimulation Models• Coverage– ESI, Non-group (Exchange), Medicaid, UninsuredCounts– Transitions from baseline scenario over time• Costs/Spending– Individuals– Employers– Government
Comparing Estimates from Various Models• Very challenging• Reasons– Differences in data infrastructure or modelingapproach– Reference period varies• “Implemented today” vs. 2014 vs. 2016– Results are stated differently• Likely multiple factors driving differences
• DataPotential Questions to Ask– Beyond adjusting for demographics and health status ofmy state population, in what other ways can a model becustomized to reflect our state’s health care marketenvironment?– What is the lowest level of geography that microsimulationmodels can capture?
Potential Questions to Ask• Policy Scenarios– To what extent can a model incorporate decisions aboutstate-based Exchange functions or other decisions to bemade by state policymakers that would affect premiumsand coverage decisions (e.g., pooling individual and smallgroups)?– How easily can certain provisions be relaxed in order togauge their importance?
• OutputPotential Questions to Ask– To what extent can a model generate information aboutdistributional effects (e.g., attributes of the newlyinsured)?– How might the model results be used to assess the impactof the policy from an economic standpoint?– What value does the model have after 2014? How can itbe used longer-term regarding implementation?
Concluding Remarks• Microsimulation models are complex and takeyears to develop.– Data infrastructure– Modelers use both elasticity-based and utility-basedapproaches– Multiple steps and assumptions embedded in themodeling process• Understanding the basics of these models canhelp analysts to ask more direct questions abouttheir flexibility and how they can be tailored toreflect a state’s particular needs.
• CBOSources– http://www.cbo.gov/sites/default/files/cbofiles/ftpdocs/87xx/doc8712/10-31-healthinsurmodel.pdf• GMSIM– http://economics.mit.edu/files/5939• RAND Compare– http://www.rand.org/content/dam/rand/pubs/technical_reports/2010/RAND_TR825.pdf– http://www.rand.org/content/dam/rand/pubs/technical_reports/2011/RAND_TR971.pdf– Personal correspondence• Lewin Group– http://www.lewin.com/~/media/lewin/site_sections/publications/hsbmdocumentationmar09rev.pdf– http://www.lewin.com/~/media/lewin/site_sections/publications/healthreform_wo_mandate-appendix.pdf– Personal correspondence• Urban Institute– http://www.urban.org/UploadedPDF/412471-Health-Insurance-Policy-Simulation-Model-Methodology-Documentation.pdf– Personal correspondence
New York State Exchange Planning:Use of Simulation ModelingDanielle HolahanProject Director, Health Insurance Exchange PlanningMarch 21, 2012
New York’s Use of Simulation Modeling toInform Exchange Planning• New York has contracted with the Urban Institute to model the cost andcoverage impacts of reform in New York:– Standard implementation scenario– Non-group and small group market merger– Defining small group size as 50 and 100 in 2014– Basic Health Plan• Health Insurance Policy Simulation Model-New York (HIPSM-NY)• Questions the model answers:– Number of newly insured New Yorkers under health reform– New and previous sources of coverage– Estimated cost to government, employers, and individuals– Impact of various policy decisions– Modeling results will inform Exchange policy decisions and budget needs2
New York’s Use of Simulation Modeling toInform Exchange Planning• Built on work with Urban Institute in 2007 (“Partnership forCoverage”)• Current contract began April 2011– Scope of work developed with New York’s interagency Exchangeplanning team• Contract cost: approximately $150,000• Deliverables:– Numerous rounds of draft output– Public presentation of results– Final written report3
Contact InformationSlides and webinar information available at this link:http://www.shadac.org/publications/webinar-predicting-effects-acaunderstanding-microsimulation-modelsJoin our mailing list:Visit www.shadac.org and click “Sign Up.”Join us on Facebook and Twitterwww.facebook.com/shadac4states @shadacQuestions about the webinar:Contact Paige Hubbell at phubbell@umn.eduwww.shadac.org