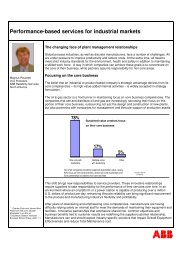
Effective Maintenance Program Development/Optimization
Effective Maintenance Program Development/Optimization
Effective Maintenance Program Development/Optimization

You also want an ePaper? Increase the reach of your titles
YUMPU automatically turns print PDFs into web optimized ePapers that Google loves.
Downloaded from Reliabilityweb.com on the web at http://www.reliabilityweb.com<strong>Effective</strong> <strong>Maintenance</strong> <strong>Program</strong><strong>Development</strong>/<strong>Optimization</strong>Sammy SeifeddineHSB Reliability TechnologiesSenior Project Manager800 Rockmead DriveThree Kingwood Place, Suite 180Kingwood, TX 77339(281) 358-1477 ext. 276(281) 358-1871 faxsseifeddine@hsbrt.com12th InternationalProcess Plant Reliability ConferenceOctober 22-23, 2003Houston, TexasPage 1
Downloaded from Reliabilityweb.com on the web at http://www.reliabilityweb.com<strong>Effective</strong> <strong>Maintenance</strong> <strong>Program</strong><strong>Development</strong>/<strong>Optimization</strong>AbstractThis paper describes a proven process for developing, optimizing, and managingeffective maintenance programs for new and in-service assets based on risk and costbenefitprinciples. The process calls for utilizing operational and maintenance experienceas long as the experience is documented for the proper class of assets in the form ofstandard tasks. In absence of standard tasks, a more comprehensive analysis isperformed using Reliability-Centered <strong>Maintenance</strong> (RCM2) or Failure Modes EffectsAnalysis (FMEA) to develop an optimum program. Asset performance data is used tocontinually adjust the maintenance program to meet user objectives.1.0 IntroductionA maintenance program is effective when it targets critical production equipment andputs emphasis on minimizing risk, which will lead to improved reliability, availabilityand resource utilization.This paper focuses on a process for developing effective asset (or optimizing existing)maintenance programs. The process is a component of overall asset’s Life CycleManagement (LCM).2.0 <strong>Maintenance</strong> <strong>Program</strong> <strong>Development</strong>/<strong>Optimization</strong>This process consists of the following steps (refer to Figure 1):1. Identifying business objectives.2. <strong>Development</strong> of plant/asset technical model.3. Condition assessment of installed assets.4. Criticality and risk assessment.5. <strong>Maintenance</strong> program development/review.6. Loading of maintenance tasks to the CMMS system.7. <strong>Maintenance</strong> spares strategy (not covered in this document.)These steps are considered in more detail in the following sections.3.0 Business ObjectiveBusiness objectives are set at the corporate and plant levels. They reflect marketconditions, shareholders expectations, and regulatory compliance. Objectives at this levelPage 2
Downloaded from Reliabilityweb.com on the web at http://www.reliabilityweb.cominclude production levels, products qualities, safe operation policies and requirements,environmental integrity requirements, and operating cost targets.Objectives are then translated to major assets’ specific performance expectations.Measures at this level might include availability, asset utilization, efficiency, specificproducts qualities, Overall Equipment <strong>Effective</strong>ness (OEE), cost per unit produced, etc.Target values are set by plant operating departments and approved by plant and corporatemanagement.Major assets or systems performance expectations are further refined to the individualequipment level. Here target vales for measures, such as Mean Time Between Failure(MTBF), Mean Time To Repair (MTTR), availability, etc., are set and approved.This process is repeated periodically, and the objectives are changed to reflect thecompany’s position regarding the main business drivers. Figure 2 identifies the stepsinvolved in developing asset performance expectations.Business objectives and performance expectations set the stage for defining equipmentperformance standards for high risk equipment in which RCM2 is the utilized method fordeveloping/optimizing the maintenance programs.4.0 Plant Technical ModelThe plant technical model (also known as asset hierarchy) is composed of a hierarchy ofsystems and sub-systems that gradually represent increased levels of detail in describingthe asset. The model reflects how systems and sub-systems fit together, interrelate andoperate to provide the intended business function. As such, the hierarchy reflects both thestructural and process flow characteristics of the plant/asset.The model starts with the process flow diagram representing the overall operation of aplant. This level consists of the major plant production units, utility systems (such aselectricity, water, steam, air, fuel, etc.), feed and raw material preparation facilities, finalproduct storage, plant control systems and local area network(s), infrastructures, etc.The next level breaks down each unit into systems and sub-systems as depicted on unitprocess flow diagram and P&ID’s. Examples at this level include systems such as feedfiltration, feed pressurization, feed heating, atmospheric fractionation, etc. Atprogressively lower levels of the model, the breakdown of the plant becomes moredetailed. At the end, the plant is reduced to a set of systems and sub-subsystems and theequipment items that support each one of the systems or sub-sub-systems.Control and protective systems are incorporated in the hierarchy at the appropriate levels.In the case where a control or protective system is dedicated to one system or sub-systemthen it should be setup as a sub-element of that system. In the case that aPage 3
Downloaded from Reliabilityweb.com on the web at http://www.reliabilityweb.comcontrol/protective system is controlling/protecting multiple systems, it should be setup asan element at the same level in the hierarchy.Every hierarchy element - whether it is a system, sub-system or an equipment item - has aclearly defined boundary. Boundary definitions are standardized for classes ofsystem/equipment items.The steps involved in developing a plant technical model are as follows (see Figure 3):1. Collect technical information and drawings (PFD’s, P&ID’s, line diagrams,datasheets, O&M manuals, etc.)2. Establish a standard for defining systems’ boundaries. See references 4 and 6 fordetails.3. Develop plant technical hierarchy.4. Define systems’ functions (optional).5. Load hierarchy into the plant maintenance information system (CMMS).5.0 Criticality and Risk AssessmentCriticality and risk assessment is a qualitative analysis of assets failure events and theranking of those events according to their impact on the business goals of the company.The process consists of the following main activities (see Figure 4):1. Establish criticality assessment criteria.2. Define for each assessment criteria the failure consequences and their scores.3. Collect equipment condition assessment records or generic failure frequencies.4. Determine failure frequencies and their ratings.5. Define criticality ranking scores.6. Define criticality ranking rules.7. Select systems and/or equipment for assessment.8. Perform the analysis.9. Rank systems/equipment by criticality.10. Rank systems/equipment by risk.These steps are considered in more detail in the following sections.5.1 Assessment CriteriaThe first step in the analysis is to use the organizational business objectives to define thecriticality assessment criteria. The following are some suggested criticality assessmentcriteria.‣ Health and Safety.‣ Environmental Integrity.‣ Throughput.Page 4
Downloaded from Reliabilityweb.com on the web at http://www.reliabilityweb.com‣ Customer Service.‣ Operating Cost.Each criterion is given a maximum score to reflect the consequences and relativeimportance. In Table 1, the safety criterion is given a maximum score of twenty (20)while operating cost criterion is given a maximum score of ten (10).5.2 Failure ConsequencesFailure consequences within each criterion are defined and given an evaluation score.Table 2 provides examples of safety, throughput/downtime, product quality, maintenanceand operating cost criteria and their associated consequences of failure and their scores.5.3 Failure FrequenciesFailure frequencies are defined based on systems and equipment performance. Whendefining failure frequencies, consideration is given to aspects such as:‣ Operational failure history (where available).‣ Generic reliability data.‣ Equipment redundancy.‣ Mode of equipment operation.‣ Equipment stress variations, etc.The frequency of failure score is used in the calculation of relative risk to determine howlikely the failure of the assessed system or equipment item will impact an organization’sbusiness. Table 3 shows a sample of frequency scores.5.4 Criticality Ranks and RulesThe criticality rank number of a system or equipment is a function of the system’s orequipment’s impact on the business when the system or equipment fails, regardless ofhow often the failure occurs. For example, a set of criticality ranking numbers mightrange from 1 to 10. Criticality rank number 10 represents the highest rank while number1 represents the lowest.Criticality ranking rules are defined to assist in assigning criticality ranks to systems orequipment during the analysis. The rules are established by considering the combinedconsequence scores for all assessment criteria. For example, a rule can be defined as“Assign criticality of 10 to a system/equipment, if any of safety or environmentalconsequence scores are greater than 18, or any of throughput, product quality ormaintenance and operating cost consequence scores are equal to 10”, and so forth.Page 5
Downloaded from Reliabilityweb.com on the web at http://www.reliabilityweb.comThe equipment criticality rank numbers, number range, and the rules for assigning thenumbers to systems or equipment under assessment are defined before conducting theanalysis.Criticality rank numbers are assigned to systems and/or equipment based on the rulesdeveloped. This is accomplished by comparing the equipment’s criteria consequencescores to the criticality rank number’s rules. If the equipment matches the rules, theequipment is assigned that criticality rank number. The equipment is always assigned thehighest criticality rank number it matches.5.5 Criticality and Risk AssessmentThe assessment starts by analyzing the selected system and/or equipment failureconsequences. The most serious failure consequence in each defined consequencecriterion is identified and its score recorded.System and equipment failure consequences are analyzed in terms of the resultant effectson the asset as a whole and consider the impact of the failure on safety of personnel andon the asset commercial performance. The later requires consideration of both direct andindirect failure costs.The analysis is conducted by answering a series of questions about each system orequipment item. These questions assess both the consequence of system or equipmentfailure and the frequency/probability of failure with respect to the assessment criteria.The criticality number and relative risk are calculated during the assessment fromresponses to the questions.Questions are formulated in the following form:“If the system/equipment fails, could it result in a safety consequence? If yes, howserious should the potential consequence be rated?”5.6 Results of Criticality and Risk Assessment5.6.1 Outcome of the AssessmentCriticality and risk assessment produces the results:1. Systems/equipment criticality ranks.2. Relative risk.3. Total consequence scores.4. Individual system/equipment scores.Page 6
Downloaded from Reliabilityweb.com on the web at http://www.reliabilityweb.com5.6.2 Relative RiskThe probability of failure is used in combination with the total failure consequence of asystem/equipment to determine the RR value of the system/equipment. CARA uses theconcept of the relative risk (RR) to identify system/equipment that has the greatestpotential impact on the business goals of the company.The RR of a system or equipment is the product of its Total Consequence Score (TC) andthe Frequency/Probability (F/P) Number. It is called “relative risk” because it only hasmeaning relative to the other equipment evaluated by the same method.The Total Consequence (TC) is the sum of all the scores assigned to each of the criteriaincluding: Safety (S), Environmental (E), Quality (Q), Throughput (T), Customer Service(CS) and Operating Cost (OC).TC = S + E + Q + T + CS + OCRR = TC * F/P6.0 <strong>Maintenance</strong> Tasks <strong>Development</strong>/<strong>Optimization</strong> (MTD/O)The MTD/O process described in this paper establishes a structured framework fordeveloping or assessing maintenance programs for in-service or newly commissionedassets. The process emphasizes the use of operation and maintenance experiencedocumented in a form of standard maintenance tasks (SMT).6.1 <strong>Maintenance</strong> Tasks <strong>Development</strong>/<strong>Optimization</strong> (MTD/O) OverviewThe flowchart in Figure 5 describes the steps involved in carrying out the MTD/Oprocess.The steps involved in the development/optimization of maintenance tasks are as follows:1. A system is identified for review by selecting an element from the plant technicalhierarchy. As described earlier, the selected system boundary should be clearlydefined. The selected system includes all lower level elements.2. A risk analysis is performed per section 4 of this paper. If an analysis was conductedin the past, review of failure frequencies in lieu of the current system/equipmentitems’ condition is conducted and the frequency scores changed as necessary. Thesystem/equipment items selected are then ranked by their risk ranking.3. In the case that the system under review belongs to an equipment class group that hasa Standard <strong>Maintenance</strong> Task (SMT) documented, it is only necessary to verify forlow risk systems/equipment that any specific company, standards, and regulationPage 7
Downloaded from Reliabilityweb.com on the web at http://www.reliabilityweb.comrequirements are applicable and simple service activities are adequate and costefficient. For high and medium risk systems/equipment, verification of all SMTelements is required.4. When an applicable SMT is not available, a more detailed analysis is required forhigh and medium risk systems/equipment. For high risk items, a complete RCM2analysis is recommended, while for medium risk items, RCM2 (FMEA) is sufficientto develop/optimize the maintenance program. The outcome of RCM2 or RCM2FMEA is a set of proposed tasks, their frequencies, and the crafts and skill levels ofindividuals performing the work, or recommended actions in case suitable routinetasks cannot be found.5. For low risk items not governed by any company, standard or governmentalrequirements a run-to-failure strategy is adapted. When requirements exist, routinetasks are developed and incorporated into work packages.6. From the output of RCM2 or RCM2 (FMEA), detailed routine task descriptions aredeveloped and then incorporated into work packages.7. SMTs are developed to reduce tasks development time, efforts, and to ensureconsistency when dealing with equipment from the same equipment group.Developed SMTs are kept in a library for future reference. Routine updates are madeto SMTs to reflect current condition of equipment, gained maintenance and operatingexperience, and any new changes/modification to systems and equipment.8. The final step in the analysis is to upload the developed work packages into PlantReliability Information Management Systems (PRIMS). PRIMS include maintenancesystems such as MAXIMO, SAP Plant <strong>Maintenance</strong>, Document ManagementSystems, Inspection Systems, etc.9. Monitoring developed/optimized maintenance programs is essential to ensure theireffectiveness in meeting the objective set by the organization. An established methodfor recording failure modes, failure effects, and failure causes as well as thecorrective actions taken to eliminate/reduce the failure effects is critical to thesuccessful implementation of any maintenance program.6.2 Standard <strong>Maintenance</strong> Task (SMT)An SMT is a set of maintenance activities, which demonstrate a technically feasible andcost-effective maintenance strategy for a defined equipment group. An equipment groupis a set of equipment of the same class that functions in an identical operating context. Anequipment group has similar design, failure modes and frequencies.Establishing a library of SMTs ensures consistent documentation of maintenancestrategies, reduces the efforts for developing maintenance programs for new systems,Page 8
Downloaded from Reliabilityweb.com on the web at http://www.reliabilityweb.comensures the application of uniform, consistent and cost-effective maintenance activities,and facilitates analysis of equipment groups.It is recommended to include the following information when documenting a standardmaintenance task:1. Applicable company requirements.2. Applicable governing standards.3. Governmental requirements/regulations.4. Completed RCM2 analysis.5. Description of equipment boundary and proper reference to drawings/isometrics.6. Description of operating context (operational and environmental.)7. Assumptions/requirements for/from risk assessment.8. Dominating failure modes with approximate probability.9. The selected maintenance activities to reduce the probability of identified failuremechanisms to cause failure along with the proper intervals (time-based orperformance/condition-based).10. All equipment monitored parameters (RCM2) with their sensitivity to faults/failures.11. Established performance indicators.12. Experience from using a known maintenance strategy along with periodic monitoringof established performance indicators.13. For non evident failure modes, the tests/inspections required to determine equipmentexpected availability.14. Required experience and competency of maintenance personnel.15. Estimated person-hours for maintenance activities.16. Estimated repair time.17. Essential spare parts, tools, equipment, and lead times.The extent of documentation depends on the complexity and the risk assigned to theassets under review. For low risk assets, it is only required to document items one to threeabove and an assessment if simple service activities are adequate and cost effective. Forhigh and medium risk assets, it is recommended that the SMT documents all of the listeditems.6.3 Condition MonitoringThe MTD/O review will determine that the best maintenance strategy is to perform “oncondition maintenance.”Equipment condition is determined by monitoring operational and non-operationalparameters sensitive to failure modes. Since not all parameters are effective in detectingfailure modes, a formal analysis is needed to select the right corroborative set ofparameters. The analysis must identify the failure sensitive parameters and theirmonitoring practicality.Page 9
Downloaded from Reliabilityweb.com on the web at http://www.reliabilityweb.comAfter establishing the technical feasibility of condition monitoring, the economic viabilitymust be considered. The costs associated with the operation and on-going support of thecondition-monitoring program must be considered against the potential cost savings andcost of alternative maintenance strategies.6.4 Monitoring <strong>Maintenance</strong> <strong>Program</strong> <strong>Effective</strong>nessMonitoring the effectiveness of the developed maintenance programs is accomplished bytracking and trending a set of key performance indicators. The indicators wereestablished during the assets condition assessment phase. Progress reports are producedperiodically. Modifications to maintenance tasks are made when necessary.7.0 ApplicationThis process was introduced and implemented at several plants in North America. Assets’condition assessment studies were conducted and baselines established for each facility.The studies helped in developing the frequency score tables and provided points ofreference for future analysis to assess the effectiveness of the devised maintenanceprograms.Areas of assessment included the following:‣ Mean time between failures.‣ Downtime due to unscheduled maintenance.‣ Downtime for scheduled maintenance.‣ Asset downtime due to failures of utilities, upstream, and downstream productionassets.‣ Slowdowns due to equipment failures.‣ Slowdowns due to utilities, upstream and downstream failures.‣ Quality problems due to equipment failures.‣ <strong>Maintenance</strong> cost.‣ Increased operating cost due to equipment failures.‣ Safety incidents due to equipment failures.‣ Environmental releases and damages due to equipment failures.‣ Spares consumptions.‣ Survey of existing PM and PdM tasks.Operational downtimes and slowdowns data were collected but not used for this analysis.The impact of adapting this process on assets performance and maintenanceorganizations are summarized in Table 4.Page 10
Downloaded from Reliabilityweb.com on the web at http://www.reliabilityweb.comStartDevelopPlant/AssetDevelopPlant/AssetTechnical ModelTechnical ModelPerformPerformCriticality & RiskCriticalityAssessment& RiskAssessmentNew/ExistingPlant/Asset?NewDevelop /Develop /OptimizeOptimizeMPMPExistingAssess Plant/AssetAssess Plant/AssetConditionConditionDevelop /OptimizeDevelop /SparesOptimizeStrategySpares StrategyModify/Load MPTo PRIMSMonitorMonitorMP<strong>Effective</strong>nessMP<strong>Effective</strong>nessEndMP: <strong>Maintenance</strong> <strong>Program</strong>PRIMS: Plant Reliability Information Management SystemsFigure 1: <strong>Maintenance</strong> <strong>Program</strong> <strong>Development</strong> Process.Page 11
Downloaded from Reliabilityweb.com on the web at http://www.reliabilityweb.comStartCollectCollectPlant/AssetPlant/AssetTechnical DataTechnical DataEstablishEstablishBoundary DefinitionBoundary DefinitionStandardsStandardsDevelopDevelopPlant/AssetPlant/AssetTechnical ModelTechnical ModelDescribe Systems’Describe Systems’FunctionsFunctionsLoad Plant/Asset Model& Equipment To PRIMSEndPRIMS: Plant Reliability Information Management SystemsFigure 3: Plant Technical Model <strong>Development</strong>.Page 13
Downloaded from Reliabilityweb.com on the web at http://www.reliabilityweb.comCriterionScoreHealth and Safety 20Environmental Integrity 20Production Throughput 10Operating Cost 10Table 1: Assessment Criteria Scores.ScoreConsequenceSafety20 Fatalities.18 Disabling injury.14 Serious injury.6 Minor or first aid injury such.0 No injury.Throughput/Downtime10 Production downtime equal or greater than 7 days9 Production downtime from 3 to 7 days.8 Production downtime from 1 to 3 days.7 One day production down time.6 Production throughput at 25% of capacity.4 Production throughput at 50% of capacity.2 Production throughput at 75% of capacity.0 No impact on throughput.Product Quality10 Unacceptable quality resulting in TOTAL product loss.5 Unacceptable quality resulting in TOTAL product rework.0 No effect on product quality.<strong>Maintenance</strong> and Operating Cost10 Incurred cost $100K and $50K and $10K and $1K and
Downloaded from Reliabilityweb.com on the web at http://www.reliabilityweb.comFailure FrequencyScoreFailures occur daily 10Failures occur weekly 9Failures occur monthly 8Failures occur between one month and one year intervals 7Failures occur yearly 6Failures occur between 1 and 5 years 5Failures occur between 5 and 10 years 4Failures occur less frequently than once in 10 years 1Table 3: Failure Frequency Scores.Availability(%) 1Downtime(%) 2RAV 3ProductQualityRejects(%) 4BeforePlant 18884.16Plant 28973.56Plant 39253.14Plant 49342.52AfterPlant 19243.254.5Plant 291.54.52.854.2Plant 394.52.52.42.4Plant 494.52.52.11.31) Availability ([operating time - all downtimes including slowdowns]*100/operating time).2) Planned and unplanned downtime for maintenance (excluding TA).3) Percent of maintenance cost to asset replacement value.4) Percent reject due to equipment failure (includes startup and shutdown of spec products).Table 4: Implementation Results.Page 17
Downloaded from Reliabilityweb.com on the web at http://www.reliabilityweb.comAppendix A: DefinitionsAsset: May refer to a plant, system, or a piece of equipment.Failure Mechanism: Physical, chemical, or other processes which lead or have led tofailure.<strong>Maintenance</strong> <strong>Program</strong>: A comprehensive set of maintenance activities, their intervals,and required recourses along with the performed maintenance analysis documentation.<strong>Maintenance</strong> Strategy: The means by which equipment are maintained. Themaintenance strategy can be of four main types: Run-to-failure, preventive, predictive (oncondition maintenance), or, redesign (the equipment).Standard <strong>Maintenance</strong> Task (SMT): A set of cost-effective maintenance actions for anequipment class group.Equipment Group: A set of equipment of the same class that functions in an identicaloperating context.Page 18
Downloaded from Reliabilityweb.com on the web at http://www.reliabilityweb.comAppendix B: References1. AIChE/CCPS, Guidelines for Process Equipment Reliability Data. Center forChemical Process Safety, American Institute of Chemical Engineers, New York,1989.2. Blanchard, Benjamin S., Logistics Engineering and Management, Prentice Hall, Inc.,1998.3. EXP Training Documentation, IVARA Corporation, 2002.4. Moubray, John, Reliability-Centered <strong>Maintenance</strong> (RCM II), 2 nd Edition, IndustrialPress, 1997.5. ISO 14224, “Petroleum and Natural Gas Industries – Collection and Exchange ofRefinery and <strong>Maintenance</strong> Data for Equipment,” International StandardsOrganization, First Edition, 1999.6. Norsok Standard, “Criticality Analysis for <strong>Maintenance</strong> Purposes,” Z-008, Rev. 2,November 2001.7. OREDA-97, Offshore Reliability Data, Det Norske Veritas, P.O.Box 300, N-1322Hovik, Norway, 3 Edition, 1997.8. Seifeddine, Sammy, “Criticality and Risk Assessment,” HSB ReliabilityTechnologies, Project Document, 2000.Page 19