bruker axs d8 discover gadds microdiffractometer - Department of ...
bruker axs d8 discover gadds microdiffractometer - Department of ...
bruker axs d8 discover gadds microdiffractometer - Department of ...

Create successful ePaper yourself
Turn your PDF publications into a flip-book with our unique Google optimized e-Paper software.
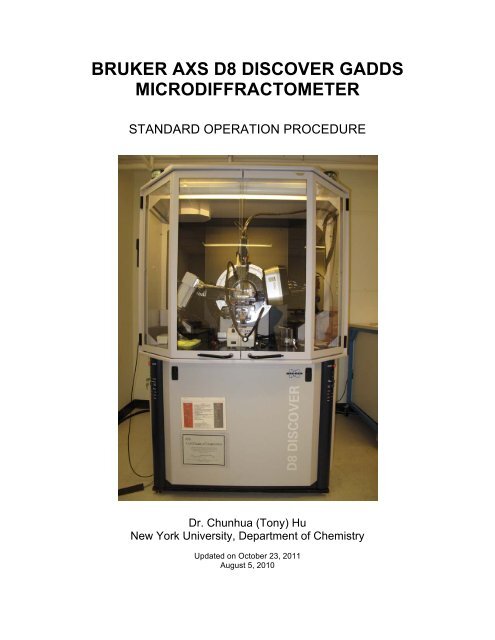
BRUKER AXS D8 DISCOVER GADDSMICRODIFFRACTOMETERSTANDARD OPERATION PROCEDUREDr. Chunhua (Tony) HuNew York University, <strong>Department</strong> <strong>of</strong> ChemistryUpdated on October 23, 2011August 5, 2010
1. SAFETYYour safety is the first concern. Each individual who wishes to be authorized to use X-ray equipments at the Facility must first receive training concerning the X-ray radiationhazards associated with the use <strong>of</strong> the equipment, the function and importance <strong>of</strong> theequipment's safety devices, the proper operation procedures, and procedures to followin the even <strong>of</strong> a suspected radiation exposure.1.1 Links to On-line Safety Training:http://www.safety.ncsu.edu/xray_training/http://www.nyu.edu/fas/dept/chemistry/wardgroup/DoubleEdgedSword.mov1.2 Radiation DosimeterWear your radiation badge and finger dosimeter all the time when you work in the X-raylab.To obtain the whole body badge and finger dosimeter, please contact Charles Strom(charlie.strom@nyu.edu, 212-998-88480, 1001I Silver).1.3 Geiger counterA Geiger counter is available in the lab for detecting any X-ray leakage.1.4 Standard Operation ProtocolAlways follow this standard operation protocol to operate the machine. If you have anyquestions, do not hesitate to contact Dr. Chunhua (Tony) Hu (212-9988769,chunhua.hu@nyu.edu).1.5 VANTEC-2000 beryllium windowThe VÅNTEC-2000’s optic assembly contains a beryllium window. Beryllium ispotentially hazardous if ingested, inhaled, or absorbed through the skin. Take care toavoid contact with the VÅNTEC-2000 X-ray window. Never drill, grind or sand berylliumunless you are a qualified individual using appropriate respiratory equipment and dustcontainment and collection apparatus. Disposal <strong>of</strong> parts containing beryllium mustcomply with all applicable local and national regulations. 2
2. DATA COLLECTION2.1. Log in the computer with the username <strong>of</strong> Bruker Instrument User andpassword <strong>of</strong> <strong>gadds</strong>.For the GADDS program users:2.2. Double-click GADDS icon on the Desktop to start the program.2.3. Click Yes in the pop-up window to set the generator to 40 kV and 40 mA(Fig. 1).Fig. 1 The generator power setup2.4. Choose Project > New to create a new project (Fig. 2).Fig. 2 Create a new project 3
2.5. Fill out the project information. The first four letters <strong>of</strong> Sample Name shouldbe three letters <strong>of</strong> your names’ initials plus _. Title can be any information relatedto the project or sample. See the following picture as an example. Click OK whenit is done (Fig. 3).Fig. 3 Fill out the Project Infromation2.6. Click Yes again in the popup window to create a folder for data storage. (Fig.4)Fig. 4 Create a new folder.2.7. In the next popup window click Yes, too, to save the existed configuration.(Fig. 5) 4
2.10a. If you are measuring sample under reflection mode, type L to switch onthe alignment laser (Fig. 8).Fig. 8 Manual mode2.11a. Use the manual control box to drive the XYZ stage until the laser beam onthe sample surface appears exactly in the center <strong>of</strong> VIDEO’s reticle (Fig. 9).Fig. 9 The aligned position 6
2.10b. If you are measuring sample under transmission mode, open the mercurylight in the diffractometer enclosure.2.11b. Use the manual control box to drive the Psi to 90° and the XYZ stage untilthe capillary center is in the middle <strong>of</strong> VIDEO’s reticle (Fig. 10).Fig. 10 Sample in 0.8 mm Kapton capillary2.12. Click Collect > Scan > SingleRun or press Ctrl+Shift+F1 keys (Fig. 11).Fig. 11 Sinlge Run data collection 7
2.12. Set up the experiment conditions in the popup window (Fig. 12).a. For a fast test, use 30 seconds/frame. If the sample diffracts well, 5 or 10minutes data collection time should be enough.b. Theta1 and Theta2 at 12 degrees are a good start. If you have peaks at low 2-theta angle, you may change them to smaller values. (Note: If you want to set anangle less than 12 degrees, talk to Dr. Hu first.)c. Type @ and then press tab key in the corresponding options for Phi, Psi, X, Yand Z, and use their current positions for the data collection.d. For the flat sample, use the sample oscillation <strong>of</strong> XY 2mm; for the capillarysample, check Rotate sample and none for Sample Osc.e. Title and sample name can be same.f. Job name is the output file name.Click OK to start the data collection.Fig. 12 Options for Single Run data collection2.13. If you want to collect the multiple data in one setup, click Collect > Scan >EditRuns or press Ctrl+Shift+F2 keys (Fig. 13). Set up the data collectionstrategy in the run list (Fig. 14). 8
Fig. 13 Edit runsFig. 14 MultiRun list2.14. Click Collect > Scan > MultiRun or press Ctrl+Shift+F3 keys (Fig. 15). 9
Fig. 15 Multiple Run data collection2.15. Set up the experiment conditions in the popup window (Fig. 16).a. Job name is the output file name.b. Title and sample name can be same.c. For the flat sample, use the sample oscillation <strong>of</strong> XY 2mm; for the capillarysample, check Rotate sample and none for Sample Osc.Click OK to start the data collection.Fig. 16 Options for MultiRun data collection 10
3. DATA PROCESSING3.1. In PILOT, click on the XRD2 Eval icon. From the Tool Icon Bar, click the FileOpen icon . The Choose Image File dialog appears. To select either one ormore files, hold the [Shift] or [Ctrl] key while clicking the desired frame filenames.Click Open. A progress bar appears while PILOT merges the frames. Thecomposite image appears in the Task Display Area.Fig. 31 Choose Image File3.2. Once an image is displayed, parts <strong>of</strong> it can be selected for further processingin three ways: Wedge, Slice, and Region <strong>of</strong> Interest. In the Tool Icon Bar, selectthe Wedge Tool (for a single image) or the Slice Tool (for a mergedimage). Click and drag the mouse across the image to select the desired wedge.Release the mouse when done. You can change the 2-theta setting to the valuesyou want (for example, min. 10 and max 60, and the Region Height to 1800).Fig. 32 Wedge Tool 11
3.3. Right-click in the Task Display Area shows the menu in Fig 32. SelectIntegrate. After integration is done, right-click again and choose Create RawFile. Save the raw file under the fold C:\frames\guest\yoursamplename.Fig. 33 Integrate frame and create raw file3.4. Open the program DIFFRAC PLUS Evalution/Raw file exchange. Browseyour raw file, select the output file type as Diffrac Exchange format (UXD) anduse the input file path for the output file. Click Convert.Fig. 34 Raw File Exchange5. Open the program FullPr<strong>of</strong>_Suite. Click WinPlotr icon.Fig. 35 FullPr<strong>of</strong> Suite Toolbar6. Click File/Open raw data file, and select the file format 56. UXD multiscans. 12
Fig. 36 WinPLOTR3.7. After you see the powder pattern, click File > Save data as … > save dataas XY file. Click OK twice. An XY file is saved, which can be read by Excel orOrigin program.Fig. 37 Save data as XY file3.8. Copy all your data to your own computer for storage. 13
Fig. 38 Goniometer setup with capillary sample 14
Fig. 39 Goniometer setup with flat sample 15
4. EXPERIMENTAL DESCRIPTIONThe ground powder was loaded in a 0.8 mm Kapton capillary and mounted on amagnetic base. The data were collected on a Bruker D8 DISCOVER GADDS<strong>microdiffractometer</strong> equipped with a VANTEC-2000 area detector in a ϕ rotationmethod. The X-ray generated from a sealed Cu tube is monochromated by agraphite crystal and collimated by a 0.5mm MONOCAP (λ Cu-Kα = 1.54178 Å).The sample-detector distance is 150 mm, and the exposure time is 600 secondsper run. Data were integrated by the XRD2EVAL program in the Bruker PILOTs<strong>of</strong>tware [1]. The raw file was converted by the UXD format by the DIFFRAC plusFileExchange [2], which was later analyzed by the WINPLOTR program [3].[1] PILOT (version 2009.5-0). Program for Bruker D8 DISCOVER X-rayDiffractometer Control. Bruker AXS Inc., Madison, WI, 2009.[2] DIFFRAC plus FileExchange (version 1.2.28). S<strong>of</strong>tware Package for PowderDiffraction. Bruker AXS Inc., Madison, WI, 2009.[3] WinPLOTR (version May 2009): a Windows tool for powder diffractionpatterns analysis. Materials Science Forum, Proceedings <strong>of</strong> the SeventhEuropean Powder Diffraction Conference (EPDIC 7), 2000, p.118-123, Ed. R.Delhez and E.J. Mittenmeijer. Authors: T. Roisnel, J. Rodriguez-Carvajal.5. ACKNOWLEDGEMENTWe thank Dr. Chunhua Hu at the NYU <strong>Department</strong> <strong>of</strong> Chemistry X-ray DiffractionFacility for his help with data collection and the support by the National ScienceFoundation under Award Numbers CRIF/CHE-0840277 and by the NSF MRSECProgram under Award Number DMR-0820341. 16