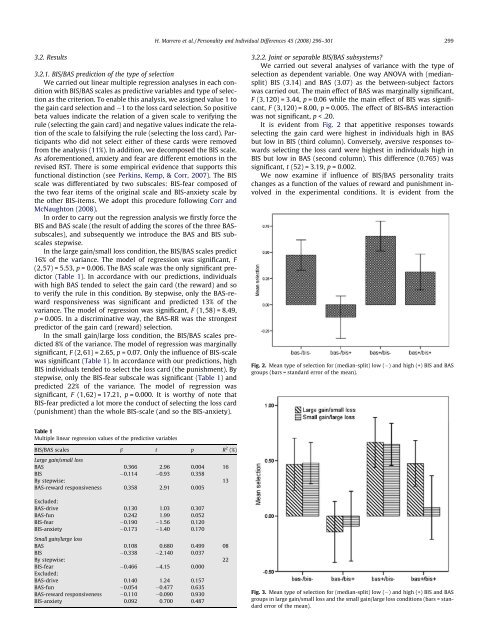
H. Marrero et al. / Personality <strong>and</strong> Individual Differences 45 (2008) 296–301 2993.2. Results3.2.1. <strong>BIS</strong>/<strong>BAS</strong> prediction <strong>of</strong> <strong>the</strong> type <strong>of</strong> selectionWe carried out linear multiple regression analyses in each conditionwith <strong>BIS</strong>/<strong>BAS</strong> scales as predictive variables <strong>and</strong> type <strong>of</strong> selectionas <strong>the</strong> criterion. To enable this analysis, we assigned value 1 to<strong>the</strong> gain card selection <strong>and</strong> 1 to <strong>the</strong> loss card selection. So positivebeta values indicate <strong>the</strong> relation <strong>of</strong> a given scale to verifying <strong>the</strong>rule (selecting <strong>the</strong> gain card) <strong>and</strong> negative values indicate <strong>the</strong> relation<strong>of</strong> <strong>the</strong> scale to falsifying <strong>the</strong> rule (selecting <strong>the</strong> loss card). Participantswho did not select ei<strong>the</strong>r <strong>of</strong> <strong>the</strong>se cards were removedfrom <strong>the</strong> analysis (11%). In addition, we decomposed <strong>the</strong> <strong>BIS</strong> scale.As aforementioned, anxiety <strong>and</strong> fear are different emotions in <strong>the</strong>revised RST. There is some empirical evidence that supports thisfunctional distinction (see Perkins, Kemp, & Corr, 2007). The <strong>BIS</strong>scale was differentiated by two subscales: <strong>BIS</strong>-fear composed <strong>of</strong><strong>the</strong> two fear items <strong>of</strong> <strong>the</strong> original scale <strong>and</strong> <strong>BIS</strong>-anxiety scale by<strong>the</strong> o<strong>the</strong>r <strong>BIS</strong>-items. We adopt this procedure following Corr <strong>and</strong>McNaughton (2008).In order to carry out <strong>the</strong> regression analysis we firstly force <strong>the</strong><strong>BIS</strong> <strong>and</strong> <strong>BAS</strong> scale (<strong>the</strong> result <strong>of</strong> adding <strong>the</strong> scores <strong>of</strong> <strong>the</strong> three <strong>BAS</strong>subscales),<strong>and</strong> subsequently we introduce <strong>the</strong> <strong>BAS</strong> <strong>and</strong> <strong>BIS</strong> subscalesstepwise.In <strong>the</strong> large gain/small loss condition, <strong>the</strong> <strong>BIS</strong>/<strong>BAS</strong> scales predict16% <strong>of</strong> <strong>the</strong> variance. The model <strong>of</strong> regression was significant, F(2,57) = 5.53, p = 0.006. The <strong>BAS</strong> scale was <strong>the</strong> only significant predictor(Table 1). In accordance with our predictions, <strong>individual</strong>swith high <strong>BAS</strong> tended to select <strong>the</strong> gain card (<strong>the</strong> reward) <strong>and</strong> soto verify <strong>the</strong> rule in this condition. By stepwise, only <strong>the</strong> <strong>BAS</strong>-rewardresponsiveness was significant <strong>and</strong> predicted 13% <strong>of</strong> <strong>the</strong>variance. The model <strong>of</strong> regression was significant, F (1,58) = 8.49,p = 0.005. In a discriminative way, <strong>the</strong> <strong>BAS</strong>-RR was <strong>the</strong> strongestpredictor <strong>of</strong> <strong>the</strong> gain card (reward) selection.In <strong>the</strong> small gain/large loss condition, <strong>the</strong> <strong>BIS</strong>/<strong>BAS</strong> scales predicted8% <strong>of</strong> <strong>the</strong> variance. The model <strong>of</strong> regression was marginallysignificant, F (2,61) = 2.65, p = 0.07. Only <strong>the</strong> influence <strong>of</strong> <strong>BIS</strong>-scalewas significant (Table 1). In accordance with our predictions, high<strong>BIS</strong> <strong>individual</strong>s tended to select <strong>the</strong> loss card (<strong>the</strong> punishment). Bystepwise, only <strong>the</strong> <strong>BIS</strong>-fear subscale was significant (Table 1) <strong>and</strong>predicted 22% <strong>of</strong> <strong>the</strong> variance. The model <strong>of</strong> regression wassignificant, F (1,62) = 17.21, p = 0.000. It is worthy <strong>of</strong> note that<strong>BIS</strong>-fear predicted a lot more <strong>the</strong> conduct <strong>of</strong> selecting <strong>the</strong> loss card(punishment) than <strong>the</strong> whole <strong>BIS</strong>-scale (<strong>and</strong> so <strong>the</strong> <strong>BIS</strong>-anxiety).3.2.2. Joint or separable <strong>BIS</strong>/<strong>BAS</strong> subsystems?We carried out several analyses <strong>of</strong> variance with <strong>the</strong> type <strong>of</strong>selection as dependent variable. One way ANOVA with (mediansplit)<strong>BIS</strong> (3.14) <strong>and</strong> <strong>BAS</strong> (3.07) as <strong>the</strong> between-subject factorswas carried out. The main effect <strong>of</strong> <strong>BAS</strong> was marginally significant,F (3,120) = 3.44, p = 0.06 while <strong>the</strong> main effect <strong>of</strong> <strong>BIS</strong> was significant,F (3,120) = 8.00, p = 0.005. The effect <strong>of</strong> <strong>BIS</strong> * <strong>BAS</strong> interactionwas not significant, p < .20.It is evident from Fig. 2 that appetitive responses towardsselecting <strong>the</strong> gain card were highest in <strong>individual</strong>s high in <strong>BAS</strong>but low in <strong>BIS</strong> (third column). Conversely, aversive responses towardsselecting <strong>the</strong> loss card were highest in <strong>individual</strong>s high in<strong>BIS</strong> but low in <strong>BAS</strong> (second column). This difference (0.765) wassignificant, t (52) = 3.19, p = 0.002.We now examine if influence <strong>of</strong> <strong>BIS</strong>/<strong>BAS</strong> personality traitschanges as a function <strong>of</strong> <strong>the</strong> values <strong>of</strong> reward <strong>and</strong> punishment involvedin <strong>the</strong> experimental conditions. It is evident from <strong>the</strong>Fig. 2. Mean type <strong>of</strong> selection for (median-split) low ( ) <strong>and</strong> high (+) <strong>BIS</strong> <strong>and</strong> <strong>BAS</strong>groups (bars = st<strong>and</strong>ard error <strong>of</strong> <strong>the</strong> mean).Table 1Multiple linear regression values <strong>of</strong> <strong>the</strong> predictive variables<strong>BIS</strong>/<strong>BAS</strong> scales b t p R 2 (%)Large gain/small loss<strong>BAS</strong> 0.366 2.96 0.004 16<strong>BIS</strong> 0.114 0.93 0.358By stepwise: 13<strong>BAS</strong>-reward responsiveness 0.358 2.91 0.005Excluded:<strong>BAS</strong>-drive 0.130 1.03 0.307<strong>BAS</strong>-fun 0.242 1.99 0.052<strong>BIS</strong>-fear 0.190 1.56 0.120<strong>BIS</strong>-anxiety 0.173 1.40 0.170Small gain/large loss<strong>BAS</strong> 0.108 0.680 0.499 08<strong>BIS</strong> 0.338 2.140 0.037By stepwise: 22<strong>BIS</strong>-fear 0.466 4.15 0.000Excluded:<strong>BAS</strong>-drive 0.140 1.24 0.157<strong>BAS</strong>-fun 0.054 0.477 0.635<strong>BAS</strong>-reward responsiveness 0.110 0.090 0.930<strong>BIS</strong>-anxiety 0.092 0.700 0.487Fig. 3. Mean type <strong>of</strong> selection for (median-split) low ( ) <strong>and</strong> high (+) <strong>BIS</strong> <strong>and</strong> <strong>BAS</strong>groups in large gain/small loss <strong>and</strong> <strong>the</strong> small gain/large loss conditions (bars = st<strong>and</strong>arderror <strong>of</strong> <strong>the</strong> mean).
300 H. Marrero et al. / Personality <strong>and</strong> Individual Differences 45 (2008) 296–301contrast in Fig. 3 that only <strong>the</strong> group <strong>BAS</strong>(+)/<strong>BIS</strong>(+) has visiblychanged among <strong>the</strong> two conditions.In this group <strong>the</strong>re are more appetitive responses (gain cardselection) in <strong>the</strong> large gain/small loss condition (47%) than in smallgain/large loss condition (8%), although this difference did notreach significance, p = 0.26.4. General discussionIn accordance with RST predictions, our results have shown thatchanges in <strong>the</strong> values <strong>of</strong> reward <strong>and</strong> punishment in interactionwith <strong>individual</strong> variability in sensitivity to reward <strong>and</strong> punishmentinduced ei<strong>the</strong>r <strong>verification</strong> or falsification in <strong>the</strong> game task. Alsorelevant, <strong>the</strong> greater percentage <strong>of</strong> appetitive (verifying) responses– selecting <strong>the</strong> gain – was given by <strong>individual</strong>s high in <strong>BAS</strong> but lowin <strong>BIS</strong>. Conversely, <strong>the</strong> greater percentage <strong>of</strong> aversive (falsifying)responses – selecting <strong>the</strong> loss – was given by <strong>individual</strong>s high in<strong>BIS</strong> but low in <strong>BAS</strong>. In addition, our results have indicated thatwhen <strong>the</strong> value <strong>of</strong> <strong>the</strong> loss (punishment) is high, <strong>BIS</strong> inhibits impulsivitytowards selecting <strong>the</strong> gain card (reward) in high <strong>BAS</strong> participants.This pattern <strong>of</strong> results supports <strong>the</strong> joint subsystemshypo<strong>the</strong>sis (Corr, 2002).Our results also indicate that <strong>the</strong> functional distinction betweenanxiety <strong>and</strong> fear is appropriate to examine <strong>the</strong> role <strong>of</strong> <strong>individual</strong><strong>differences</strong> in punishment sensitivity in selection behaviour. Inour game task <strong>the</strong>re was an approach–avoidance conflict <strong>of</strong> attaining<strong>the</strong> reward (<strong>the</strong> gain) <strong>and</strong> avoiding <strong>the</strong> punishment (<strong>the</strong> loss).In this context, participants high in fearfulness to potential punishmentwill experience <strong>the</strong> task in <strong>the</strong> small gain/large loss conditionas <strong>the</strong> origin <strong>of</strong> an approach–avoidance conflict, <strong>and</strong> motivated by<strong>BIS</strong>, will tend to inspect <strong>the</strong> loss card (<strong>the</strong> risk <strong>of</strong> loss). In contrast,participants low in fearfulness (in <strong>the</strong> pursuit <strong>of</strong> a reward) willtend to ignore punishment, <strong>and</strong> to minimize this conflict. As a result,<strong>BIS</strong> is not triggered <strong>and</strong> <strong>BAS</strong> would lead <strong>the</strong>m to select <strong>the</strong> gaincard (reward).In this light, we consider that fur<strong>the</strong>r research is necessary toexamine <strong>the</strong> role <strong>of</strong> fearfulness in <strong>individual</strong> <strong>differences</strong> in reward<strong>and</strong> punishment sensitivities in <strong>the</strong> light <strong>of</strong> <strong>the</strong> revised RST. Moregenerally, a more precise definition <strong>and</strong> measurement <strong>of</strong> <strong>the</strong> psychologicalstructure <strong>of</strong> <strong>the</strong>se sensitivities is needed (see Caseraset al., 2003).Overall, our results uphold <strong>the</strong> relevance <strong>of</strong> <strong>the</strong> revised RST(Gray & McNaughton, 2000) in <strong>the</strong> examination <strong>of</strong> <strong>individual</strong> <strong>differences</strong>in reward/punishment sensitivities in reasoning, particularlyin <strong>the</strong> process <strong>of</strong> <strong>verification</strong>/falsification <strong>of</strong> hypo<strong>the</strong>ticalaction ? result <strong>conditional</strong>s. Also relevant is <strong>the</strong> fact that our resultssupport in human behaviour several RST proposals that havebeen previously tested in animal research. In this context, <strong>the</strong>ymake a contribution to <strong>the</strong> research program aimed at showing<strong>the</strong> usefulness <strong>of</strong> <strong>BIS</strong>/<strong>BAS</strong> systems as organizing <strong>the</strong>mes for <strong>the</strong>orydevelopment. Reward <strong>and</strong> punishment sensitivities could constitutea bridge between disparate psychological ambits such as motivation<strong>and</strong> personality on <strong>the</strong> one h<strong>and</strong> <strong>and</strong> reasoning <strong>and</strong>decision-making about actions in social contexts, on <strong>the</strong> o<strong>the</strong>r.Our research has also combined experimental <strong>and</strong> correlationalmethodologies. The relevance <strong>of</strong> relating <strong>the</strong>se for <strong>the</strong> progress <strong>of</strong>scientific psychology was pointed out by Cronbach (1957) decadesago.AcknowledgementsWe are specially grateful for <strong>the</strong> advice <strong>of</strong> Margaret Gillon <strong>and</strong>Philip Corr. Thanks also to two anonymous reviewers who <strong>of</strong>feredvaluable criticisms <strong>and</strong> suggestions.Appendix ASuppose that you go to a casino. When you go in, you find a newcard game. The game is about turning up cards to check certainrules. The cards have letters on one side, <strong>and</strong> a result on <strong>the</strong> o<strong>the</strong>rside: ei<strong>the</strong>r 1 € [100 €] gain or 100 € [1 €] loss.Below, <strong>the</strong>re are four cards <strong>the</strong> same as those displayed in <strong>the</strong>game:CARD DISPLAYAs you can see, two cards show <strong>the</strong> letter side (<strong>and</strong> <strong>the</strong> resultside is hidden) <strong>and</strong> two cards show <strong>the</strong> result side (<strong>and</strong> <strong>the</strong> letterside is hidden). The rule that you have to check on this occasionis: Whenever a card has a letter A on one side, <strong>the</strong>n <strong>the</strong> card has ‘‘1€ gain” [100 €] on <strong>the</strong> o<strong>the</strong>r side. As you can imagine, <strong>the</strong> card with<strong>the</strong> letter A could have on <strong>the</strong> o<strong>the</strong>r side ei<strong>the</strong>r ‘‘1 € [100 €] gain” or‘‘100 € [1 €] Loss”. Therefore, if <strong>the</strong> rule is true <strong>the</strong>n you will gain 1 €[100 €], <strong>and</strong> if it is false you will lose 1 € [100 €]. Let us suppose thatbefore <strong>the</strong> game starts (<strong>and</strong> before you gain or lose money), you aregiven <strong>the</strong> opportunity to carry out a previous test. Logically, thistest has to evaluate whe<strong>the</strong>r this rule: Whenever a card has a letterA on one side <strong>the</strong>n <strong>the</strong> card has ‘‘1 € gain” [100 €] on <strong>the</strong> o<strong>the</strong>r side isFALSE. The cards displayed above are to carry out this test. Once<strong>the</strong> test has been carried out, <strong>the</strong> game will start with <strong>the</strong> display<strong>of</strong> similar cards. If you check that <strong>the</strong> rule is false, <strong>the</strong>n you can‘‘pass” when it’s your turn <strong>and</strong> so avoid losing 100 € [1€].To do <strong>the</strong> test you have to indicate those two cards you definitelyneed to turn over to evaluate that <strong>the</strong> rule is false.I’ll turn over <strong>the</strong> cards:Explain briefly <strong>the</strong> reasons for your selection:A.1. Card displayA.1.1. Small gain/large loss versionA Y 1gain100loss1 2 3 4A.1.2. Large gain/small loss versionReferencesA Y 100gain1loss1 2 3 4Carver, Ch. S. (2006). Approach, avoidance, <strong>and</strong> <strong>the</strong> self-regulation <strong>of</strong> affect <strong>and</strong>action. Motivation <strong>and</strong> Emotion, 30, 105–110.Carver, Ch. S., & White, T. L. (1994). Behavioral activation <strong>and</strong> affective responses toimpending reward <strong>and</strong> punishment: The <strong>BIS</strong>/<strong>BAS</strong> scales. Journal <strong>of</strong> Personality<strong>and</strong> Social Psychology, 67(2), 319–333.Caseras, X., Ávila, C., & Torrubia, R. (2003). The measurement <strong>of</strong> <strong>individual</strong><strong>differences</strong> in behavioural inhibition <strong>and</strong> behavioural activating systems: Acomparison <strong>of</strong> personality scales. Personality <strong>and</strong> Individual Differences, 34,999–1013.Corr, P. J. (2002). J.A. Gray’s reinforcement sensitivity <strong>the</strong>ory: Tests <strong>of</strong> <strong>the</strong> jointsubsystems hypo<strong>the</strong>sis <strong>of</strong> anxiety <strong>and</strong> impulsivity. Personality <strong>and</strong> IndividualDifferences, 33, 511–532.Corr, P. J. (2004). Reinforcement sensitivity <strong>the</strong>ory <strong>and</strong> personality. Neuroscience &Biobehavioral Reviews, 28, 317–332.