True Group - True Corporation Public Company Limited
True Group - True Corporation Public Company Limited
True Group - True Corporation Public Company Limited

Create successful ePaper yourself
Turn your PDF publications into a flip-book with our unique Google optimized e-Paper software.
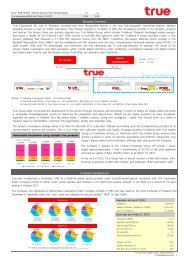
<strong>True</strong> <strong>Corporation</strong> Plc.At a GlanceSeptember 2012Disclaimer: This presentation contains statements about expected future events and financial results that are forward-looking and subject to risks and uncertainties. For these statements, we claim the protection of thesafe harbor for forward-looking statements contained in the Private Securities Litigation Reform Act of 1995. Discussion of factors that may affect future results is contained in our recent filings with the Securities andExchange Commission.
<strong>True</strong> <strong>Group</strong> – Thailand’s convergence lifestyle leader1CP <strong>Group</strong><strong>Public</strong>shareholders- Foreign 12.1%- Local 23.6%64.3% 35.7%Reported under <strong>True</strong>Online99.4 1/ % 100.0% 2/100.0%100.0%Mobile <strong>Group</strong> Pay TV Wireline/Online Wireline/onlineConvergence & others“ 19.5 mn subs on 2G, HSPA+ &CDMA“ 25.0% subscriber market share“ Operates 3G+ reseller services on850 MHz under <strong>True</strong>Move H brand“ International call services: 006 (TDM),00600 (VoIP)“ 1.6 mn subs (93% DsTV; 7%cable TV)“ Enhanced, secure broadcastingsystem with MPEG-4 & securesilicon“ Ad revenue is a key growth area“ Fixed-line operator with 1.8 mn subsin Greater Bangkok area“ 1.5 mn Broadband Internet customersvia ADSL, VDSL, DOCSIS 3.0 andfiber“ 100,000 domestic WiFi hotspots“ 36.7% Broadband subscriber marketshare 3/“ Convergence/bundled packages“ Digital content, media and onlinegames publisher“ <strong>True</strong> App Center – developsapplications (220+) for iOS,BlackBerry and Android“ Payment channel supporting300+ payment servicesNote: 1/ Indirectly holds 99.3% in <strong>True</strong>Move and 99.4% in Real Move (<strong>True</strong>Move H brand)2/ Indirectly holds 100.0% in <strong>True</strong>Visions <strong>Group</strong> (which holds 99.3% in <strong>True</strong>Visions PLC and 99.0% in <strong>True</strong>Visions Cable PLC)3/ Market share figure is as at June 30, 2012 (source: <strong>Company</strong>)4/ Subscriber figures are as at Jun 30, 2012 and estimated shareholding figures are as at Mar 31, 2012
Key strategic milestonesTransformation from a fixed-line concessionaire to a quad-play operator21995: Launched cable TV serviceunder UTV; merged with IBC in1998 to form UBC2003: LaunchedBroadband services2007: Launched the firstbundled package “<strong>True</strong> LifeFreeview” which offeredpopular convergence packageof <strong>True</strong>Move and <strong>True</strong>Visions2011: Completed Hutchacquisition; started rolling outcommercial 3G services;launched DOCSIS 3.0 CableModem network1991: Started fixed-linetelephone service under aB-T-O concession with TOT(first 2 mn lines)2002: TA Orange launchedits cellular service underthe “Orange” brand2006: Achieved nationwide mobilecoverage (92%)- Completed UBC tender offer;rebranded as “<strong>True</strong>Visions’;expand pay TV services to massmarket- Introduced first public WiFiservice2009: First Thai operator tolaunch Apple’s iPhone 3G;offered 3G 850 MHz trialservice2012: expandedWiFi network to100,000 hot spots;activation of MPEG-4broadcasting system
Thai telecom industry’s competitive landscape3Fixed-line licenseTOTNTC/NBTCMobile licenseIndustry regulatorCATEquipment leaseand O&MBFKTWire-linelicenseFixed-lineconcessionsMobile 2GconcessionMobile 3GTOT’s Thai MobileMobile 2GconcessionsMobile 3GCAT TelecomTUC<strong>True</strong>TT&TAISDTAC<strong>True</strong>MoveRealMove(<strong>True</strong>Move H brand)AIS’s DPCType-3 telecomlicenseConcessionConcessionMVNO/ResellerConcessionMVNO/Reseller
<strong>Group</strong> long-term financial trendsBt bn50.5 51.8 51.9 52.6 52.6 56.88.4 8.9 9.4 9.5 9.6 9.741.51.7 4.5 8.2 22.3 22.3 23.8 22.8 23.6 23.3 27.214.3 18.1 20.1 24.2 27.0 30.414.3 18.1 20.1 22.6 22.6 22.8 23.0 24.0 24.5 26.0 26.4 26.0 26.9'99 '00 '01 '02 '03 '04 '05 '06 '07 '08 '09 '10 '11<strong>True</strong>Online <strong>True</strong> Mobile <strong>True</strong>Visions*Segment results are presented before intersegment eliminationBt bnService RevenueEBITDA2.4 2.5 2.7 2.6 2.3 2.21.8 5.1 5.1 7.6 5.7 7.2 6.2 5.07.4 9.5 9.0 9.8 11.6 12.9 15.7 17.3 19.8 18.5 19.6 18.4 17.17.4 9.5 9.0 11.8 11.9 11.5 10.7 9.9 9.7 10.2 9.8 9.8 10.0(1.9) (0.3)'99 '00 '01 '02 '03 '04 '05 '06 '07 '08 '09 '10 '11<strong>True</strong>Online <strong>True</strong> Mobile <strong>True</strong>VisionsBt bn(5.8)(5.0) (4.3) (1.6)(4.5)(3.0)NIOGO(3.8)(6.0)(1.2)EBITDA margin*0.1 (0.5)(1.4)(5.4)'99 '00 '01 '02 '03 '04 '05 '06 '07 '08 '09 '10 '11<strong>True</strong>Online <strong>True</strong> Mobile <strong>True</strong>Visions <strong>Group</strong>50% 49% 44% 38%42% 40% 36% 33%37% 35% 35% 33% 27%'99 '00 '01 '02 '03 '04 '05 '06 '07 '08 '09 '10 '11<strong>True</strong>Online <strong>True</strong> Mobile <strong>True</strong>Visions <strong>Group</strong>* on total revenue excluding IC and network rental revenue4
Key investment & growth strategy512345First-mover advantage for 3G+ mobile services nationwide; expand 2Gcoverage/capacity in provincial areas with high growth potential (mainly Northeast)Secure Broadband leadership with the launch of DOCSIS 3.0; enhance fiber servicesfor enterprise segment; maintain Thailand’s largest and fastest Wi-Fi network (supportsdata off-loading for 3G services)HDTV via DOCSIS 3.0; MPEG-4 enhanced broadcasting system to eliminate threat frompiracy and secure the premium pay TV market; capture advertising growth potential byfurther expanding into the mass market and new mediaFurther strengthen convergence platform by developing content and applications toenhance customer loyalty and reduce churnSeek regional business opportunities
<strong>True</strong>Move H positioned to capture growth in mobile data• Officially launched on Aug 30, 2011• Reached 2 mn subscribers by 2Q12; FY12postpaid subscriber target already achieved• Well-positioned to capture growth in mobiledata/Internet markets• Thailand’s most extensive 3G+ coverage• ~ 100,000 domestic Wi-Fi hot spots• <strong>True</strong> App Center has developed 220+ appsfor iOS, BlackBerry and Android platforms(recently launched H-perience i.e. H TV)• Launched device-bundling promotions andbundled packages with exclusive contentfrom <strong>True</strong>VisionsCAT<strong>True</strong> Mobile <strong>Group</strong> Structure100.00%BFKTNetworkLease AgreementWholesaleAgreementMarketing ContractTRUE Corp<strong>True</strong> Mobile <strong>Group</strong>Real FutureHWMH73.92%HCATCDMABITCOOperator99.40%99.99% 99.92%RealMove (<strong>True</strong>Move H brand) <strong>True</strong>Move3G 850 MHz (reseller) 2G 1800 MHz/3G 850 MHztrial92.5%6
Superior 3G+ service drives <strong>True</strong>Move H acquisitions7 <strong>True</strong> Move H acquired 2 mn subscribers by the end of 2Q12 Subscriber base almost doubled from 1Q12 70% of postpaid subscribers came from outside of <strong>True</strong> <strong>Group</strong> High-value postpaid subscribers dominated customer base On track for 4 mn target by year-end Key drivers were Thailand’s most extensive 3G+ coverage, attractive device-bundlecampaigns, and Innovative applications and content
Mobile non-voice market driven by 3G & smartphones8Thailand mobile non-voice market size*23.2%19.2%13.3% 13.4%15.8%18.0%9.9%Bt mn15,000 20,962 21,021 26,148 35,22016,176 23,0882007 2008 2009 2010 20111H111H12Market value% service revenue* Consisting of <strong>True</strong>Move, <strong>True</strong>Move H, Hutch, AIS and DTAC** DTAC restated its voice/non-voice revenue breakdown for the 2009 results (no restatementsavailable for its 2007-2008 results)
subs (mn)Blended ARPU (Bt/sub/mo)<strong>True</strong> Mobile <strong>Group</strong> targets & strategic outlook• Increase 3G+ subscribers to 4 mn byYE12, from 2.0 mn at 2Q12• Expand 3G+ to cover every amphoe and7,336 tambons in 77 provinces by theend of 2012• Discontinue Hutch CDMA service by theend of 2012 to facilitate subscribermigration to <strong>True</strong>Move H• Launch more device bundling promotionsand leverage innovative apps and content• Capitalize on <strong>True</strong>Move’s expanding 2Gfootprint in low penetration/ high-growthpotential areas (i.e., Northeast)302520151050Projected 3G subs & ARPU2011 2012 2013 20143G Subs 2G Subs Blended 3G ARPUSource: <strong>Company</strong>, BMI market forecast800600400200-9
<strong>True</strong> Mobile <strong>Group</strong> targets & strategic outlook3G coverage map1077 provinces77 provinces843 Amphoes5,158 Tumbols843 amphoe5,158 tambons77 provinces77 provinces928 Amphoes6,583 Tumbols928 amphoe6,583 tambons77 provinces77 provincesALL Amphoes7,235 TumbolsEvery amphoe7,336 tambons
Funding in place to support business expansion• Successful financing activities in 2011 (Rights Offering, securing long-term creditfacilities at <strong>True</strong> Mobile <strong>Group</strong>) allow <strong>True</strong> <strong>Group</strong> to capture business opportunitiesin 3G and Broadband• Higher long-term debt in 2Q12 mainly to support the expansion of 3G+ andDOCSIS 3.0 businesses11Bt bn851132Long-term debt composition78 7680 831168 671111 119 1229 29 26 37 402242 38 36 33 33 32 322006 2007 2008 2009 2010 2011 2Q12<strong>True</strong>Online <strong>True</strong> Mobile <strong>True</strong>Visions
Regulatory issues12• <strong>Public</strong> hearings on the first draft of the InformationMemorandum for the 3G 2.1 GHz license auctionwere conducted in July; the final draft waspublished in the Royal Gazette on August 27, 2012while the auction for the 2.1 GHz spectrum isexpected in October• <strong>True</strong> <strong>Group</strong> continues to collaborate with CAT toamend six clauses in the 3G <strong>True</strong>-CAT agreementsaccording to NBTC’s recommendation• <strong>True</strong> <strong>Group</strong> is working to resolve the MNP ClearingHouse bottleneck. Negotiations continue with theNBTC to obtain more numbers
pioneers next-generation Broadband• Platinum Trusted Brand Award Winner from Reader’s Digest in the Internet Operator category• Continued success of ULTRA hi-speed Internet, DOCSIS 3.0 expansion and localized marketingactivities resulted in Broadband net adds of 131k in 1H12• Already achieved more than half of the full-year target net adds• Launched 200 Mbps ULTRA hi-speed Internet via DOCSIS 3.0 in April 2012; FTTH services areoffered in the high-end residential projects• 3.0 mn DSL and DOCSIS homepasses in 38 provinces• Maintain Thailand’s fastest WiFi service (up to 100 Mbps) with approximately 100,000 domestichotspots3.7k128 Kbps<strong>True</strong>Online’s Broadband Internet RoadmapADSL, VDSL1.0mnUp to50 Mbps2002 2003 2004 2007 2008 2009 20101.2mnUp to400 MbpsDOCSIS 3.0Broadband subscribers>1.4mn2011 and beyond• DOCSIS 3.0• FTTx• WiMAX• Quad Play• HD Content• NGN/NBNUp to1 GbpsFTTx NGN/NBN13
Superior fiber optic network yields competitive advantage<strong>True</strong> Fiber Optic Network inBangkok Metropolitan Area (BMA)Fiber OpticTNCSN14RCURCURCURCU(OSP - Copper)Fiber and advanced electronics= greater reliability and stabilityShorter ‚last mile‛ connection improvesBroadband performance – avg. within 3 kmCostly and difficult to replicateFiber rich (>240,000 core kilometres in BMA;>300,000 km nationwide)780++ RCUs (instead of 70-80 central offices)
targets & strategic outlook15Thailand Broadband market forecast by value25%16% 19% 21% 20%Bt bn1823263138462009 2010 2011 2012F 2013F 2014FBroadband market size % growth• Expect Broadband market value to grow by ~20% annually over the next few years• Plan to launch an ULTRA hi-speed Internet package offering maximum speed of 200Mbps (via FTTH) and new Broadband VAS
targets & strategic outlook (cont’d)• Capture Broadband growth opportunity by maintaining market’s most competitivepackages via ADSL and cable modem (DOCSIS 3.0) technologies• Strengthen Broadband’s position by expanding Broadband coverage (ADSL andDOCSIS) to 53 provinces by YE12• Leverage convergence platform by bundling DOCSIS 3.0 with <strong>True</strong>Visions• Continue to enhance the customer experience with superior serviceBroadband penetration by householdThailand Broadband penetration16104% 95%83%30%21%8.06.04.010% 15% 2.04.4Subscribers (mn)Penetration rate (%)12.910.26.415.718.7 19.5-2006 2007 2008 2009 2010 2011 2012ESource: BuddeCommSource: NBTC (subscriber), NESDB (household)
to revive growth via market segmentation• Premium segment: Received strong response to the activation of the newbroadcasting system (MPEG-4) in July which effectively prevent unauthorizedaccessing of our premium content; increased HD offerings to 17 channels;continue to strengthen our portfolio with international/ exclusive content• Mid-tier segment: Launched attractive/ customized packages with our attractive/exclusive content• Mass segment: Partnered with PSI and CTH to increase audience base and boostadvertising revenue; continued to redeploy old set-top boxes to the mass CMDUmarket and simplified our convergence offerings to increase upsellingopportunitiesUSD bnAdvertising spending1.2 1.2 1.5 1.6 1.9 2.2 2.5 2.6 2.7 2.8 2.7 2.70.4 0.4 0.6 0.6 0.7 0.9 1.1 1.1 1.1 1.2 1.2 1.13.13.31.21.30.8 0.8 0.9 1.0 1.1 1.3 1.4 1.5 1.6 1.6 1.5 1.6 1.8 2.017'98 '99 '00 '01 '02 '03 '04 '05 '06 '07 '08 '09 '10 '11TV OthersSource: AGB Nielsen
2012 targets & guidance18• Mid-to-high single-digit revenue growth at <strong>True</strong> <strong>Group</strong>• High single-digit growth at <strong>True</strong> Mobile <strong>Group</strong> and <strong>True</strong>Visions• Mid single-digit growth at <strong>True</strong>Online• <strong>Group</strong> CAPEX of Bt 23 bn• Majority at <strong>True</strong> Mobile <strong>Group</strong>
<strong>True</strong> <strong>Group</strong> provides unique investment opportunities19• Thailand’s only quadruple-play operator with an unparalleled range ofproducts and services• Convergence lifestyle platform strengthened by:• 3G 850 MHz nationwide services• Leadership of the premium smartphone market• DOCSIS 3.0 (double-play) Broadband and pay TV• Thailand’s largest and fastest WiFi network• Exclusive content and applications for <strong>True</strong> <strong>Group</strong> customers• Market leadership in terms of technological and service innovation
2Q12 results
Financial highlights – 2Q12(Units in millions of Baht unless otherwise indicated) <strong>True</strong>Online 1/ Wireless <strong>Group</strong> 1/ <strong>True</strong>Visions Elim1/ConsolidatedTotal Revenue (excl IC & network rental) 7,195 10,380 2,394 18,027% growth Q-o-Q -2.8% -3.3% -3.6% -2.6%% growth Y-o-Y 6.1% 26.1% 1.9% 15.0%Service Revenue 6,821 7,660 2,372 15,019% growth Q-o-Q -2.6% 2.6% -3.9% 0.1%% growth Y-o-Y 3.9% 14.9% 1.6% 7.4%EBITDA 2,362 1,191 523 4,012% growth Q-o-Q -8.1% -7.9% 18.5% -5.9%% growth Y-o-Y -7.7% -20.8% -14.3% -14.6%Interest expense (551) (874) (228) (1,603)% growth Q-o-Q -1.1% 3.9% -4.5% 1.0%% growth Y-o-Y -4.2% -2.7% -1.6% -3.1%Tax, net (315) (363) 9 (558)growth Q-o-Q 105 495 (49) 431growth Y-o-Y 58 (6) (64) (137)21NIOGO 2/ (32) (1,829) 29 (1,752)growth Q-o-Q (332) (598) 116 (718)growth Y-o-Y (231) (443) (89) (732)NIOGO excl. deferred tax 208 (1,547) 13 (1,357)growth Q-o-Q (210) (168) 82 (320)growth Y-o-Y (124) (530) (152) (900)Free Cash Flow (100) (1,844) 391 (1,479)growth Q-o-Q 225 776 485 2,033growth Y-o-Y (1,098) (2,905) 9 (4,046)Capex 813 2,991 505 4,320growth Q-o-Q (527) (215) (169) (934)growth Y-o-Y (26) 2,061 318 2,4521/Before eliminating inter-company transactions; 2/ Revenue from telephone and other services excluding IC revenue and network rental revenue3/NIOGO: Net income (loss) from ongoing operations
Financial highlights – 1H12(Units in millions of Baht unless otherwise indicated) <strong>True</strong>Online 1/ Wireless <strong>Group</strong> 1/ <strong>True</strong>Visions 1/ ConsolidatedTotal Revenue (excl IC & network rental) 14,597 21,115 4,878 36,528% growth Y-o-Y 6.5% 30.5% 1.1% 16.9%Service Revenue 13,822 15,123 4,840 30,017% growth Y-o-Y 4.7% 13.3% 1.2% 6.9%EBITDA 4,934 2,484 964 8,276% growth Y-o-Y -4.6% -20.7% -19.8% -12.5%Depreciation & amortization (3,045) (3,572) (587) (7,161)% growth Y-o-Y -0.3% 25.0% 19.3% 12.9%Interest expense (1,107) (1,715) (467) (3,189)% growth Y-o-Y -1.0% -2.8% 3.0% -1.5%Tax, net (524) (231) (31) (686)Current tax (166) (97) (29) (293)growth Y-o-Y (106) 97 0 (8)Deferred income tax (358) (134) (2) (393)growth Y-o-Y 139 (647) (88) (727)NIOGO 2/ 269 (3,059) (57) (2,787)growth Y-o-Y (229) (673) (276) (1,103)NIOGO excl. deferred tax 627 (2,926) (56) (2,394)growth Y-o-Y (90) (1,320) (364) (1,830)Free Cash Flow (426) (4,464) 297 (4,991)growth Y-o-Y (1,397) (6,238) (282) (8,124)Capex 2,153 6,198 1,180 9,574growth Y-o-Y 451 4,632 896 6,071221/Before eliminating inter-company transactions; 2/ Revenue from telephone and other services excluding IC revenue and network rental revenue3/NIOGO: Net income (loss) from ongoing operations
%FY08 %FY09 %FY10 %FY11 %YoYService revenue -4.4% +3.4% -1.2% +17.0% +13.3%EBITDA -24.8% +27.0% -13.7% -20.2% -20.7%<strong>True</strong>Move H drives <strong>True</strong> Mobile <strong>Group</strong> revenueService revenue & market share15.7% 14.4% 15.0% 14.1% 14.8%14.9% 15.2%Bt mn46NIOGOBt mn23,835 22,796 23,575 23,284 27,2493,223 13,345 15,123(777) (624) (1,314)1,4263,919(2,883) (1,411)(2,258)(3,244)(4,811)23,835 22,796 23,575 23,284 24,36811,956 11,891(1,605)(2,386)(2,926)(3,059)23(6,173)2007 2008 2009 2010 2011 1H11 1H122007 2008 2009 2010 2011 1H11 1H12<strong>True</strong>Move* 3G, CDMA & others* NIOGO excl. deferred income tax NIOGO% <strong>True</strong>Mobile revenue market share*Before intersegment elimination between <strong>True</strong>Move and 3G, CDMA & others30.6% 24.3% 27.7% 24.0% 15.1%Bt mnEBITDA & EBITDA margin7,5666,4635,691 7,226 6,2333,2944,974 3,1332,4102,484-1,481 (156) (191)Net IC +165 (845) (32) +181 (98) +96 (420)2007 2008 2009 2010 2011<strong>True</strong>Mobile EBITDA19.4% 11.8%1H11EBITDA margin1H12<strong>True</strong>Move<strong>True</strong>Mobile<strong>Group</strong>3G, CDMA &othersBt mn5,0704,2324,111 3,8802,6372,762Free cash flow3,4293,6676,5162922007 2008 2009 2010 2011Cash flow from operationsCapex3,2521,5661H116,1982681H12
Mobile Internet continues to drive non-voice growth<strong>True</strong> Mobile’s non-voice revenue25.7%10.4% 11.8% 13.3% 15.2% 19.5% 17.0%5,314Bt mn3,8863,5341,5687143,1342,490 2,6792,2711,5111,616 2,7471,367 1,512770 2,655336 362 569 1,123999787 805 949 900 999502 5162007 2008 2009 2010 20111H11 1H12Messaging (SMS/MMS) Mobile Internet Content & RBT% of service revenue excl. IC and network rental24• Accelerated non-voice growth due to rising mobile Internet usage driven by ongoingexpansion of 3G+ service coverage and promotion packages for smartphone and tabletdevices%FY08 %FY09 %FY10 %FY11 %YoYNon-voice revenue +7.6% +17.0% +12.8% +50.4% +71.1%
Smartphone packages support <strong>True</strong> Mobile’s postpaid net adds<strong>True</strong> Mobile subscribers & market share23.2% 24.3% 24.6% 24.5% 25.0%‘000 subs12,08014,757 15,80117,11818,94028949425.1% 25.0%18,53419,460902,02912,08014,757 15,801 17,118 18,15717,93117,341Net adds +4,502 +2,677 +1,044 +1,317 +1,822 +1,416 +520(‘000) 2007 2008 2009 2010 2011 1H11 1H122G 3G CDMA % market share597Prepaid vs. postpaid subscribers9%91%1H11PostpaidPrepaid11%89%1H1225<strong>True</strong> Mobile postpaid revenue<strong>True</strong> Mobile prepaid revenueBt mn5,807 6,3324,870 4,930532 7051,082 1,5034,338 4,225 4,725 4,8299,9732,9806,9936,1024,6521,1772,2593,475 3,843Bt mn16,488 15,206 15,1951,95814,194 14,4391,974 2,052 2,030 2,33414,530 13,232 13,143 12,164 12,1057,163 7,6981,094 1,6276,069 6,0712007 2008 2009 2010 2011 1H11 1H12 2007 2008 2009 2010 2011 1H11 1H12Voice Non-voice Voice Non-voice
%FY08 %FY09 %FY10 %FY11 %YoYService revenue +6.0% +1.5% -1.3% +3.2% +4.7%EBITDA +5.4% -3.8% -0.5% +2.3% -4.6%<strong>True</strong>Online grows on solid Broadband performanceBt mn24,528 25,989 26,387 26,043 26,87611,452 10,179 8,564 7,538 6,8129,235Service revenue9,998 10,573 11,532 13,0213,841 5,812 7,250 6,973 7,04313,201 13,8223,470 3,2706,295 7,0543,436 3,4982007 2008 2009 2010 2011 1H11 1H12Convergence & othersBroadband & other Internet servicesTraditional voice (fixed-line, payphone, PCT)EBITDA & EBITDA margin38.8% 38.1% 36.4% 36.5% 35.5% 37.7% 33.8%Bt mn9,670 10,195 9,804 9,751 9,9735,170 4,9342007 2008 2009 2010 2011 1H11 1H12EBITDAEBITDA marginBt mn782(158)1,0001,20145(101)760301NIOGO1,144717 627427 4982692007 2008 2009 2010 2011 1H11 1H12NIOGO excl. deferred income tax NIOGOBt mnFree cash flow5,517 6,558 5,392 5,1046,2561,8492,408 2,5513,397 3,0872,6731,7271,7022,1532007 2008 2009 2010 2011 1H11 1H12Cash flow from operations Capex26
Success of ULTRA hi-speed packages drives Broadband growthBt mnBroadband revenue*7,300 8,117 8,531 9,262 10,659 5,126 5,961549Broadband customers* & ARPUBt/sub/mo728 701 707 704 709927 1,026 1,175 1,335 1,466‘000 subs1,254272007 2008 2009 2010 2011 1H11 1H12* Broadband revenue and subscribers were reclassified and restated to include revenues fromenterprise business in 1Q11Nationwide Broadband market share(estimated as of 2Q12)3BB27.8%Source: <strong>Company</strong>Others2.8%TOT32.7%By no. of subs<strong>True</strong>36.7%2007 2008 2009 2010 2011 1H11 1H12Broadband customer Blended ARPU27.0%40.5%Super Hi-speed sub by speed*10.5%1H1122.1%< 6Mbps6 Mbps7 Mbps> 7 Mbps4%16%64%1H1216%*Connection speed for the standard package (Bt599/month) was upgraded from 6 Mbpsto 7 Mbps in Jun’11%FY08 %FY09 %FY10 %FY11 %YoYBroadband revenue +11.2% +5.1% +8.6% +15.1% +16.3%Broadband subscribers +68.8% +10.6% +14.6% +13.6% +16.9%
Ad revenue offset declines in Pay TV subscription revenueService revenuesBt mn8,866 9,431 9,533 9,585 9,66913 74 482 707865992 910 769 8318,001 8,426 8,549 8,334 8,1314,781 4,840283 369348 5294,150 3,942AdvertisingMusic entertainment& OthersSubscription &installation674Bt mn1,0071,1669831,097 1,130 1,020516NIOGO354 309294(56)219 (57)282007 2008 2009 2010 20112,527 2,666 2,622 2,322 2,2361H11EBITDA & EBITDA margin1H1225.9% 26.1% 27.0% 23.7% 22.7% 24.9% 19.8%Bt mn 26.1% 23.7%1,201 9642007 2008 2009 2010 2011 1H11 1H12EBITDA EBITDA margin w/o TVS extra itemNote: 2009 includes the reversal of over-accrued content-related costs (Bt207mn)Bt mn2007 2008 2009 2010 2011 1H11 1H12NIOGO excl. deferred income tax NIOGOFree cash flow2,0781,494 1,5201,4779118645521,4301,180614 681232284-6602007 2008 2009 2010 2011 1H11 1H12Cash flow from operations Capex%FY08 %FY09 %FY10 %FY11 %YoYService revenue +6.4% +1.1% +0.5% +0.9% +1.2%EBITDA +5.5% -1.7% -11.5% -3.7% -19.8%
Subscribers decline from competition and piracy%FY08 %FY09 %FY10 %FY11 %YoYTotal subscriber +41.4% +13.2% +2.5% -3.7% -5.4%ARPU -10.5% -18.4% -7.7% +2.9% +10.5%29Subscribers & ARPUBt/sub/mo1,104 988 806 744 765 759 8391,469 1,663 1,705 1,642 1,693‘000 subs1,601199 256143290 2691,039345536 520527526 54631990501149 320470 475 396 443 347481 479 459 455 430 435 408Net adds +415 +431 +194 +42 (63) (12) (41)(‘000)2007 2008 2009 2010 2011 1H11 1H12Premium (Platinum, Gold, Silver) Standard (Knowledge)Freeview Free-to-air Blended ARPUBundled package subscribers &upselling rate19.0% 30.4% 38.5% 38.0% 32.4% 35.1% 26.2%1,016 1,059 1,008 1,061‘000 subs958819533 515 521 541495394 52492 141 160 14746212319249391 403 327 373 25175 -2007 2008 2009 2010 2011 1H11 1H12Upsold Non-upsold (Free-to-air) Non-upsold (Free view)% Upselling rate* Upselling rate refers to the upgrading of mass market subscribers to highervaluepackages