A new Red List of British butterflies - Butterfly Conservation
A new Red List of British butterflies - Butterfly Conservation
A new Red List of British butterflies - Butterfly Conservation

You also want an ePaper? Increase the reach of your titles
YUMPU automatically turns print PDFs into web optimized ePapers that Google loves.
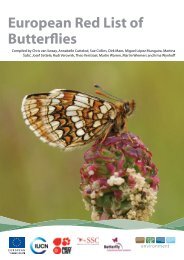
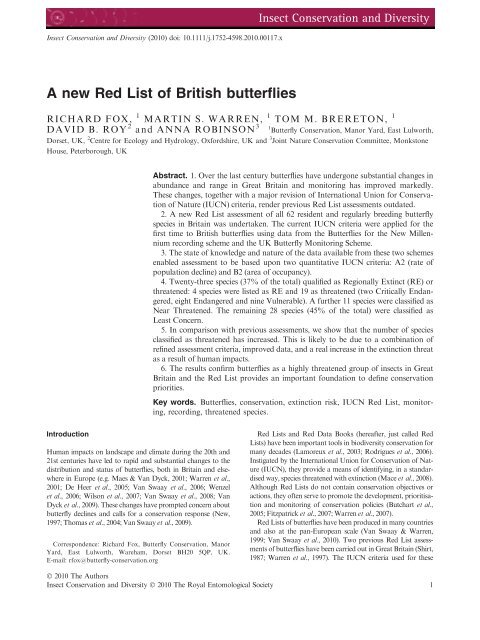
Insect <strong>Conservation</strong> and Diversity (2010) doi: 10.1111/j.1752-4598.2010.00117.xA <strong>new</strong> <strong>Red</strong> <strong>List</strong> <strong>of</strong> <strong>British</strong> <strong>butterflies</strong>RICHARD FOX, 1 MARTIN S. WARREN, 1 TOM M. BRERETON, 1DAVID B. ROY 2 and ANNA ROBINSON 31 <strong>Butterfly</strong> <strong>Conservation</strong>, Manor Yard, East Lulworth,Dorset, UK, 2 Centre for Ecology and Hydrology, Oxfordshire, UK and 3 Joint Nature <strong>Conservation</strong> Committee, MonkstoneHouse, Peterborough, UKAbstract. 1. Over the last century <strong>butterflies</strong> have undergone substantial changes inabundance and range in Great Britain and monitoring has improved markedly.These changes, together with a major revision <strong>of</strong> International Union for <strong>Conservation</strong><strong>of</strong> Nature (IUCN) criteria, render previous <strong>Red</strong> <strong>List</strong> assessments outdated.2. A <strong>new</strong> <strong>Red</strong> <strong>List</strong> assessment <strong>of</strong> all 62 resident and regularly breeding butterflyspecies in Britain was undertaken. The current IUCN criteria were applied for thefirst time to <strong>British</strong> <strong>butterflies</strong> using data from the Butterflies for the New Millenniumrecording scheme and the UK <strong>Butterfly</strong> Monitoring Scheme.3. The state <strong>of</strong> knowledge and nature <strong>of</strong> the data available from these two schemesenabled assessment to be based upon two quantitative IUCN criteria: A2 (rate <strong>of</strong>population decline) and B2 (area <strong>of</strong> occupancy).4. Twenty-three species (37% <strong>of</strong> the total) qualified as Regionally Extinct (RE) orthreatened: 4 species were listed as RE and 19 as threatened (two Critically Endangered,eight Endangered and nine Vulnerable). A further 11 species were classified asNear Threatened. The remaining 28 species (45% <strong>of</strong> the total) were classified asLeast Concern.5. In comparison with previous assessments, we show that the number <strong>of</strong> speciesclassified as threatened has increased. This is likely to be due to a combination <strong>of</strong>refined assessment criteria, improved data, and a real increase in the extinction threatas a result <strong>of</strong> human impacts.6. The results confirm <strong>butterflies</strong> as a highly threatened group <strong>of</strong> insects in GreatBritain and the <strong>Red</strong> <strong>List</strong> provides an important foundation to define conservationpriorities.Key words. Butterflies, conservation, extinction risk, IUCN <strong>Red</strong> <strong>List</strong>, monitoring,recording, threatened species.IntroductionHuman impacts on landscape and climate during the 20th and21st centuries have led to rapid and substantial changes to thedistribution and status <strong>of</strong> <strong>butterflies</strong>, both in Britain and elsewherein Europe (e.g. Maes & Van Dyck, 2001; Warren et al.,2001; De Heer et al., 2005; Van Swaay et al., 2006; Wenzelet al., 2006; Wilson et al., 2007; Van Swaay et al., 2008; VanDyck et al., 2009). These changes have prompted concern aboutbutterfly declines and calls for a conservation response (New,1997; Thomas et al., 2004; Van Swaay et al., 2009).Correspondence: Richard Fox, <strong>Butterfly</strong> <strong>Conservation</strong>, ManorYard, East Lulworth, Wareham, Dorset BH20 5QP, UK.E-mail: rfox@butterfly-conservation.org<strong>Red</strong> <strong>List</strong>s and <strong>Red</strong> Data Books (hereafter, just called <strong>Red</strong><strong>List</strong>s) have been important tools in biodiversity conservation formany decades (Lamoreux et al., 2003; Rodrigues et al., 2006).Instigated by the International Union for <strong>Conservation</strong> <strong>of</strong> Nature(IUCN), they provide a means <strong>of</strong> identifying, in a standardisedway, species threatened with extinction (Mace et al., 2008).Although <strong>Red</strong> <strong>List</strong>s do not contain conservation objectives oractions, they <strong>of</strong>ten serve to promote the development, prioritisationand monitoring <strong>of</strong> conservation policies (Butchart et al.,2005; Fitzpatrick et al., 2007; Warren et al., 2007).<strong>Red</strong> <strong>List</strong>s <strong>of</strong> <strong>butterflies</strong> have been produced in many countriesand also at the pan-European scale (Van Swaay & Warren,1999; Van Swaay et al., 2010). Two previous <strong>Red</strong> <strong>List</strong> assessments<strong>of</strong> <strong>butterflies</strong> have been carried out in Great Britain (Shirt,1987; Warren et al., 1997). The IUCN criteria used for theseÓ 2010 The AuthorsInsect <strong>Conservation</strong> and Diversity Ó 2010 The Royal Entomological Society 1
2 Richard Fox et al.assessments differed from each other (principally with the inclusion<strong>of</strong> rate <strong>of</strong> decline as a quantitative measure <strong>of</strong> extinction riskinthelater<strong>Red</strong><strong>List</strong>)andfromthoseusedinthisstudy.Importantly,both previous assessments pre-dated a major revision <strong>of</strong>the IUCN criteria in 2000 (IUCN, 2001). This revision, which isstill in use today, introduced more quantitative and precise criteria(IUCN, 2001, 2003) and guidance on their use at the regionallevel (Ga¨rdenfors et al., 2001).Since the last <strong>Red</strong> <strong>List</strong> in 1997, considerable advances havebeen made in monitoring <strong>British</strong> <strong>butterflies</strong>. Thousands <strong>of</strong>skilled volunteers are now involved annually in a range <strong>of</strong>national schemes co-ordinated by <strong>Butterfly</strong> <strong>Conservation</strong> andthe Centre for Ecology and Hydrology. As a result, comprehensive<strong>new</strong> data have become available on both distribution andpopulation trends (Asher et al., 2001; Fox et al., 2006). It wasestablished that <strong>butterflies</strong> had declined more rapidly over thelast 30–50 years in Britain than other well-studied taxa (vascularplants and birds; Thomas et al., 2004); the rate <strong>of</strong> decline amongmacro-moths, however, has been comparable with that measuredfor <strong>butterflies</strong> (Conrad et al., 2006).The revision <strong>of</strong> the IUCN criteria and availability <strong>of</strong> <strong>new</strong>monitoring data, together with known changes in butterfly distributionsand populations, highlighted the need for an updatedbutterfly <strong>Red</strong> <strong>List</strong> and revised conservation priorities. The aim<strong>of</strong> this article is to undertake a revised assessment <strong>of</strong> <strong>British</strong><strong>butterflies</strong>.Methods and data sourcesAll resident and regularly breeding species (species that breed inGreat Britain every year) were assessed. These included threemigratory species (Clouded Yellow Colias croceus,<strong>Red</strong>AdmiralVanessa atalanta and Painted Lady Vanessa cardui) thatarecommon summer breeding species but which do not maintainsubstantial year-round populations in Britain (although see Fox& Dennis, 2010 for a recent evaluation <strong>of</strong> the <strong>Red</strong> Admiral).Other immigrant species were classified as vagrants according toIUCN guidelines (Gärdenfors et al., 2001), since they occur onlyoccasionally within Britain, and were not considered. Butterfliesthat formerly occurred as regular breeding species were assessed.In total, 62 species were included. All taxa were assessed at thespecies level.Data sourcesThe <strong>Red</strong> <strong>List</strong> assessment was carried out using data from twodifferent, but complementary schemes that exist to monitor <strong>butterflies</strong>in Britain: a national distribution recording scheme(Butterflies for the New Millennium, BNM) and a populationmonitoring scheme (UK <strong>Butterfly</strong> Monitoring Scheme,UKBMS).The BNM scheme was launched by <strong>Butterfly</strong> <strong>Conservation</strong> in1995 and has provided the impetus for 15 years <strong>of</strong> the mostintensive butterfly recording ever undertaken in Britain (andIreland). Data from the first 10 years <strong>of</strong> the BNM scheme(1995–2004) were used to develop the <strong>new</strong> <strong>Red</strong> <strong>List</strong>. In thisperiod, approximately 10 000 observers contributed 3.2 millionbutterfly distribution records for Great Britain, representing99.4% <strong>of</strong> the 10 km · 10 km grid squares in the Ordnance Surveynational grid (Fox et al., 2006). In addition, historical butterflyrecords for the period 1970–1982 (Heath et al., 1984) wereused in the assessment to provide a baseline against which tomeasure distribution change.The BNM data were used to calculate area <strong>of</strong> occupancy(AOO), a measure <strong>of</strong> distribution size, for each species, and alsoto assess long-term trends by comparing species’ distributionsin different time periods. However, such trends have to be constructedand interpreted with care as the intensity and geographicalcoverage <strong>of</strong> recording has varied over time (Denniset al., 1999). We calculated distribution change at the 10 kmgrid square resolution between the survey periods 1970–1982and 1995–2004 (duration between mid-points <strong>of</strong> surveys =25 years) by using a sub-sampling analysis (Thomas et al.,2004; Fox et al., 2006). This technique reduced the bias resultingfrom differences in recording intensity in the two periods,producing an approximate equalisation <strong>of</strong> recording effort. Thesub-sampling method has been validated by comparison withpopulation monitoring trends (Warren et al., 2001; Thomas,2005) and alternative analysis techniques (Fox et al., 2010).Since 1976, the UKBMS has undertaken detailed populationmonitoring <strong>of</strong> <strong>butterflies</strong>, primarily using a line transect method(Pollard & Yates, 1993). To date, the UKBMS has collated datafrom over 1500 site transects, representing nearly 170 000weekly walks and records <strong>of</strong> over 12.5 million individual <strong>butterflies</strong>.The UKBMS provides a standardised annual measure (index)<strong>of</strong> butterfly populations at transect sites. Transect indices relateclosely to other, more intensive, measures <strong>of</strong> population sizesuch as mark ⁄release ⁄recapture methods (Pollard et al., 1986).Indices from different sites can be combined to derive regionaland national collated indices, which can be used to generatelong- and short-term population trends. Collated indices <strong>of</strong>abundance were calculated for each species that had beenrecorded from a minimum <strong>of</strong> five sites per year. Abundance indicesand temporal trends in the indices for each species were analysedby poisson regression, as implemented in the freewareprogram Trends and Indices for Monitoring Data (TRIM)(Pannekoek & van Strien, 1996). The direction, magnitude andsignificance<strong>of</strong>trendswerecalculatedusingthetimeeffectsmodel within TRIM, incorporating year and site effects andadjustments for overdispersion and serial correlation. Trendswere calculated for 49 species over two time periods: (i) 10 years(1995–2004) and (ii) long-term (typically 1976–2004).Although these distribution and population data on <strong>butterflies</strong>are more comprehensive than for any other invertebrategroup in Britain, they do have limitations for use in <strong>Red</strong> <strong>List</strong>assessment (see next).Application <strong>of</strong> IUCN criteriaThe <strong>new</strong> IUCN criteria were used for the current assessment(IUCN, 2001), following guidance for their use at the regionalscale (Ga¨rdenfors et al., 2001). Species at risk <strong>of</strong> regionalÓ 2010 The AuthorsInsect <strong>Conservation</strong> and Diversity Ó 2010 The Royal Entomological Society, Insect <strong>Conservation</strong> and Diversity
<strong>Red</strong> <strong>List</strong> <strong>of</strong> <strong>British</strong> <strong>butterflies</strong> 3extinction in Britain were assigned to the categories RegionallyExtinct (RE), Critically Endangered (CR), Endangered (EN),Vulnerable (VU) or Near Threatened (NT). Species not assignedto one <strong>of</strong> these categories were classed as Least Concern (LC).Three additional IUCN categories (Extinct in the Wild, DataDeficient and Not Assessed) were not used in this assessment.The state <strong>of</strong> knowledge and nature <strong>of</strong> the data available on<strong>British</strong> <strong>butterflies</strong> permitted species to be assessed quantitativelyagainst two IUCN criteria: A2 (reduction in population size)and B2 (AOO).The 10-year population trends generated from the UKBMSdata set were directly applicable to the <strong>Red</strong> <strong>List</strong> assessmentunder criterion A2(b). However, inappropriate classification <strong>of</strong>species can occur if short-term population trends do not accuratelyreflect the longer term trend (Dunn, 2002). This is a particularconcern for taxa, including <strong>British</strong> <strong>butterflies</strong>, with rapidlyfluctuating population dynamics. Thelongtimeseries<strong>of</strong>datainthe UKBMS enabled short-term (i.e. 10 year) trends to be interpretedin the context <strong>of</strong> two- or threefold longer time periods.We assessed 10-year trends against the IUCN thresholds butalso used long-term trends (which varied across species from 13to 29 years, mean = 27.7 years, n = 49) to downgrade the initialcategorisation, where there was inconsistency between shortandlong-term trends.Distribution (AOO) trends derived from the BNM data wereused, with modification, under criterion A2(c). Modificationwas required on two fronts. First, trends were measured at10 km grid square scale, whereas the IUCN criteria relate topopulation level change. Distribution trends measured at 10 kmsquare resolution correlate with trends from butterfly populationmonitoring, suggesting that distribution change can be avalid surrogate for population change (Warren et al., 2001; Thomas,2005). However, trends at 10 km square resolution underestimatetrends at a finer spatial scale (which more closelyresemble population level change), and this relationship is nonlinearand taxon-specific (Thomas & Abery, 1995; Cowley et al.,1999). Thomas and Abery (1995) estimated that losses <strong>of</strong> species<strong>of</strong> intermediate rarity were underestimated by 35% on averagewhen plotted at the 10 km square scale compared with losses atthe 2 km grid square scale. To account for this, thresholdsTable 1. The IUCN threshold values for classification undercriterion A2 and the equivalent values used in this assessment.required to qualify for threat categories in this assessment wereinitially set 35% lower than those defined for population declineby IUCN. This 35% rule has been used in other recent assessments<strong>of</strong> the status <strong>of</strong> <strong>British</strong> <strong>butterflies</strong> (e.g. Warren et al., 1997;Bourn et al., 2005).Second, distribution trends were measured over 25 yearswhilst IUCN thresholds specify 10 years. Consequently, thethreshold values were further adjusted by calculating the annualrate <strong>of</strong> change using the equation (1 ) x) n = proportion <strong>of</strong>population remaining (where x is the annual rate <strong>of</strong> change andn is the number <strong>of</strong> years over which the change has taken place)and solving for the altered time periods and threshold values.The resultant thresholds, adjusted for both geographical resolutionand time scale, used in this assessment are shown inTable 1.We defined a quantitative threshold for the NT category, soas to permit objective classification across species. This was setas a 31.9% decline in AOO (i.e. a 10% band below the thresholdfor VU, see Table 1).IUCN criterion B2 (AOO) was derived for each speciesdirectly from the BNM data for 1995–2004. AOO values (andresultant <strong>Red</strong> <strong>List</strong> classifications) are influenced by the spatialresolution at which they are calculated (Gaston & Fuller, 2009).In accordance with recommended practice, AOO was calculatedat the 2 km · 2 km grid resolution by totalling the number <strong>of</strong>grid squares occupied by each species at any point during thetime period and converting to area (km 2 ) (Hartley & Kunin,2003; IUCN, 2003; Eaton et al., 2005). Although using this geographicalresolution provides a better estimate <strong>of</strong> the true range<strong>of</strong> a taxon than the coarser 10 km square resolution, in realitymany butterfly species will occupy only a proportion <strong>of</strong> the landarea within each 2 km · 2 km grid square (Cowley et al., 1999).Thus, the AOO values used in this study are likely to overestimatethe amount <strong>of</strong> land occupied by species and potentiallyunderestimate the IUCN threat category to which taxa shouldbe assigned.During previous <strong>Red</strong> <strong>List</strong> assessments <strong>of</strong> <strong>British</strong> <strong>butterflies</strong>,small geographical range was sufficient for species to be classifiedas at risk <strong>of</strong> extinction. This is not the case under the currentIUCN criteria. For this study, butterfly species only qualified asthreatened under criterion B2 if the measured AOO met thresholdvalues plus at least two <strong>of</strong> three IUCN-defined sub-criteria(severe fragmentation, continuing decline, extreme fluctuations)were satisfied (IUCN, 2001). Species were classified as NT ifThreat classIUCN criteria(A2) forpopulationdecline over10 years (%)EquivalentAOO 25-yeardecline measuredat 10 km squarescale (%)Table 2. The IUCN thresholds for classification under criterionB2.Threat classAOO (based on occupied 2 km grid squares)CR ‡80 ‡84.0EN 50–79 62.6–83.9VU 30–49 41.9–62.5NT – 31.9–41.8CRENVUNT
<strong>Red</strong> <strong>List</strong> <strong>of</strong> <strong>British</strong> <strong>butterflies</strong> 5Table 3. New <strong>Red</strong> <strong>List</strong> <strong>of</strong> <strong>British</strong> <strong>butterflies</strong>, showing available data and qualifying criteria.Species AOO km 2 under B2CategoryAOO 25-yeartrend (%)Categoryunder A2cLong-termpopulationtrend (%)10-yearpopulationtrend (%)CategoryunderA2bOverallassessmentCriteria forqualifying NotesChequeredSkipperCarterocephaluspalaemon424 EN )38 – – EN B2 ab(ii) AOO highly restricted(
6 Richard Fox et al.Table 3. (continued ).Species AOO km 2 under B2CategoryAOO 25-yeartrend (%)Categoryunder A2cLong-termpopulationtrend (%)10-yearpopulationtrend (%)CategoryunderA2bOverallassessmentCriteria forqualifying NotesWood White Leptidea sinapis 944 VU )65 EN )64 10 EN A2 c AOO trend suggests apopulation decline <strong>of</strong>50–79%Clouded Yellow Colias croceus 26 368 144 1117 1877 LC Regular breedingmigrantBrimstone Gonepteryx rhamni 52 436 )3 22 )11 LCBlack-veinedWhiteAporia crataegi – – – – RE Last record 1920sLarge White Pieris brassicae 101 852 )7 )28 18 LCSmall White Pieris rapae 103 012 )7 15 )34 VU LC VU downgraded to LCbecause 10-yearpopulation decline isnot supported bylong-term trend orAOO trendGreen-veinedWhitePieris napi 120 932 )1 11 7 LCOrange-tip Anthocharis cardamines 86 376 7 22 )8 LCGreenCallophrys rubi 14 152 )29 )25 )25 LC AOO trend close to NTHairstreakBrownHairstreakPurpleHairstreakWhite-letterHairstreakBlackHairstreakThecla betulae 3704 )43 VU – – VU A2 c AOO trend suggests apopulation decline <strong>of</strong>30–49%Neozephyrus quercus 22 784 )15 53 )23 LCSatyrium w-album 9220 )53 VU )71* )63 EN EN A2 b 10-year populationtrend is between 50and 79% declineSatyrium pruni 288 EN )43 VU – – EN B2 ab(ii) AOO highly restricted(
<strong>Red</strong> <strong>List</strong> <strong>of</strong> <strong>British</strong> <strong>butterflies</strong> 7Table 3. (continued ).Species AOO km 2 under B2CategoryAOO 25-yeartrend (%)Categoryunder A2cLong-termpopulationtrend (%)10-yearpopulationtrend (%)CategoryunderA2bOverallassessmentCriteria forqualifying NotesSmall Blue Cupido minimus 3212 )38 NT )6 121 NT A2 c AOO trend is close toVUSilver-studdedBluePlebeius argus 1660 VU )43 VU )1 )72* EN VU A2 c +B2ab(ii,v)AOO restricted (
8 Richard Fox et al.Table 3. (continued ).Species AOO km 2 under B2CategoryAOO 25-yeartrend (%)Categoryunder A2cLong-termpopulationtrend (%)10-yearpopulationtrend (%)CategoryunderA2bOverallassessmentCriteria forqualifying NotesHolly Blue Celastrina argiolus 59 292 36 281 )30 VU LC VU downgraded to LCbecause 10-yearpopulation trend part<strong>of</strong> natural cycle andnot supported bylong-term trend orAOO trendLarge Blue Glaucopsyche arion
<strong>Red</strong> <strong>List</strong> <strong>of</strong> <strong>British</strong> <strong>butterflies</strong> 9Table 3. (continued ).Species AOO km 2 under B2CategoryAOO 25-yeartrend (%)Categoryunder A2cLong-termpopulationtrend (%)10-yearpopulationtrend (%)CategoryunderA2bOverallassessmentCriteria forqualifying NotesSmallTortoiseshellAglais urticae 114 780 )3 )15 )34 VU LC VU downgraded to LCbecause 10-year trendnot supported bylong-term trend orAOO trend. 10-yeartrend not statisticallysignificant despite largesample sizeLargeNymphalis polychloros – – – – RE Last record in 1980s.TortoiseshellOnly vagrants sincePeacock Inachis io 100 952 17 90** )40 VU LC VU downgraded to LCbecause 10-year trendnot supported bylongtermtrend or AOOtrendComma Polygonia c-album 63 532 37 305*** 64 LCSmall PearlborderedFritillaryBoloria selene 9232 )34 NT )70*** )10 NT A2 c VUDecline in AOO close toPearl-borderedFritillaryHigh BrownFritillaryDark GreenFritillarySilver-washedFritillaryBoloria euphrosyne 2668 )61 VU )66** )51 EN EN A2 b 10-year populationtrend is between 50and 79% declineArgynnis adippe 552 VU )79 EN )13 )85* CR CR A2 b 10-year trend isstatistically significantdespite small samplesizeArgynnis aglaja 11 424 )30 63 )10 LC AOO trend close to NTArgynnis paphia 9048 )29 33 )14 LC AOO trend close to NTMarsh Fritillary Euphydryas aurinia 2876 )46 VU )73** 73 VU A2 c AOO trend suggestspopulation decline <strong>of</strong>30–49%GlanvilleFritillaryHeathFritillaryMelitaea cinxia 132 EN )17 – – EN B2 b(v)c(iv)Melitaea athalia 168 EN )25 )73** )46 VU EN B2 ab(ii,v)c(iv)AOO highly restricted(
10 Richard Fox et al.Table 3. (continued ).Species AOO km 2 under B2CategoryAOO 25-yeartrend (%)Categoryunder A2cLong-termpopulationtrend (%)10-yearpopulationtrend (%)CategoryunderA2bOverallassessmentCriteria forqualifying NotesSpeckled Wood Pararge aegeria 74 332 31 160*** 66* LCWall Lasiommata megera 37 600 )38 NT )65** )2 NT A2 c AOO trend close to VUMountainRingletErebia epiphron 524 NT )12 – – NT B2 b(ii) AOO restricted(
<strong>Red</strong> <strong>List</strong> <strong>of</strong> <strong>British</strong> <strong>butterflies</strong> 11Table 4. <strong>Red</strong> <strong>List</strong> <strong>of</strong> <strong>British</strong> <strong>butterflies</strong>, listed by threat categoryand then taxonomic order.SpeciesOverallassessmentBlack-veined White Aporia crataegi RELarge Copper Lycaena dispar REMazarine BluePolyommatusREsemi-argusLarge Tortoiseshell Nymphalis polychloros RELarge Blue Glaucopsyche arion CRHigh Brown Fritillary Argynnis adippe CRChequered Skipper Carterocephalus ENpalaemonWood White Leptidea sinapis ENWhite-letter Hairstreak Satyrium w-album ENBlack Hairstreak Satyrium pruni ENDuke <strong>of</strong> Burgundy Hamearis lucina ENPearl-bordered Fritillary Boloria euphrosyne ENGlanville Fritillary Melitaea cinxia ENHeath Fritillary Melitaea athalia ENDingy Skipper Erynnis tages VUGrizzled Skipper Pyrgus malvae VUBrown Hairstreak Thecla betulae VUSilver-studded Blue Plebeius argus VUNorthern Brown Argus Plebeius artaxerxes VUWhite Admiral Limenitis camilla VUMarsh Fritillary Euphydryas aurinia VUGrayling Hipparchia semele VULarge Heath Coenonympha tullia VULulworth Skipper Thymelicus acteon NTSilver-spotted Skipper Hesperia comma NTSwallowtail Papilio machaon NTSmall Blue Cupido minimus NTChalkhill Blue Polyommatus coridon NTAdonis Blue Polyommatus bellargus NTPurple Emperor Apatura iris NTSmall Pearl-bordered Boloria seleneNTFritillaryWall Lasiommata megera NTMountain Ringlet Erebia epiphron NTSmall HeathCoenonymphapamphilusNTWe consider that the current IUCN criteria provide a morevalid assessment <strong>of</strong> extinction risk than earlier versions (Maceet al., 2008) and are highly applicable to species with comprehensivequantitative data, such as <strong>British</strong> <strong>butterflies</strong>. Nevertheless,even for <strong>British</strong> <strong>butterflies</strong>, one <strong>of</strong> the most intensivelystudied invertebrate faunas in the world, the application <strong>of</strong>IUCN criteria was not straightforward. There were no speciesfor which <strong>Red</strong> <strong>List</strong> criteria C or D, which rely on knowledge<strong>of</strong> the absolute population size (i.e. the total number <strong>of</strong> individuals)<strong>of</strong> a species, could be applied. The final criterion, E,requires a quantitative analysis <strong>of</strong> the probability <strong>of</strong> extinction.Such analysis, typically referred to as population viability analysis(PVA), requires detailed information about species and, asa result, has not been used widely for <strong>butterflies</strong> or other invertebrates(Schtickzelle & Baguette, 2009). Only two <strong>butterflies</strong>Fig. 1. Summary <strong>of</strong> <strong>Red</strong> <strong>List</strong> assessment for <strong>British</strong> <strong>butterflies</strong>(RE, Regionally Extinct; CR, Critically Endangered; EN, Endangered;VU, Vulnerable; NT, Near Threatened; LC, Least Concern).Table 5. Comparison with previous <strong>Red</strong> <strong>List</strong> assessments <strong>of</strong><strong>butterflies</strong> in Britain.IUCN categoryShirt(1987)Warrenet al. (1997)Regionally Extinct 3 5 4Critically Endangered – 0 2Endangered 2 0 8Vulnerable 3 7 9Near Threatened – 7 11Least Concern – – 28Rare 3 – –Out <strong>of</strong> Danger 2 – –Total Threatened orNT (excluding LCand Out <strong>of</strong> Danger)11 19 34CurrentassessmentIUCN, International Union for <strong>Conservation</strong> <strong>of</strong> Nature; LC,Least Concern; NT, Near Threatened.in Britain have been the subject <strong>of</strong> PVA analysis incorporatinga substantial proportion <strong>of</strong> the species’ range (i.e. approachingnational scale); the Silver-spotted Skipper Hesperia comma(Hanski & Thomas, 1994; Wilson et al., 2009) and MarshFritillary Euphydryas aurinia (Bulman et al., 2007; Thomaset al., 2008), although a few others have been studied inrestricted local areas. As a result, criterion E was not suitablefor this assessment <strong>of</strong> the <strong>British</strong> butterfly fauna, and the <strong>new</strong><strong>Red</strong> <strong>List</strong> was constructed using criteria A and B only. Evenfor criterion A, the nature <strong>of</strong> the available data meant thatthresholdshadtobemodifiedtoallowfordifferenttimescalesand geographical resolution, and expert judgement used toÓ 2010 The AuthorsInsect <strong>Conservation</strong> and Diversity Ó 2010 The Royal Entomological Society, Insect <strong>Conservation</strong> and Diversity
12 Richard Fox et al.interpret 10-year population trends in the context <strong>of</strong> long-termtrends.For other invertebrate groups in Britain and, particularly,in other countries, paucity <strong>of</strong> detailed data on current rangesize or population trend makes the <strong>Red</strong> <strong>List</strong> process moredifficult (Dunn, 2005; Regan et al., 2005; Akc¸akaya et al.,2006; Warren et al., 2007). However, it does not preclude thecreation <strong>of</strong> regional or global <strong>Red</strong> <strong>List</strong>s. The two <strong>Red</strong> DataBooks <strong>of</strong> European <strong>butterflies</strong> (Van Swaay & Warren, 1999;Van Swaay et al., 2010) were completed using limited data <strong>of</strong>varying quality and a sampled <strong>Red</strong> <strong>List</strong> Index approach isbeing developed for <strong>butterflies</strong> at the global scale (Lewis &Senior, 2010).In many instances, <strong>Red</strong> <strong>List</strong>s and <strong>Red</strong> Data Books act as driversfor biodiversity conservation both at policy level and in terms<strong>of</strong> practical management for threatened species. The Europeanassessments have proved important and influential in advancingthe cause <strong>of</strong> butterfly conservation across the continent, leadingto further analyses (e.g. Konvicka et al., 2006; Van Swaay et al.,2006) and the identification <strong>of</strong> a network <strong>of</strong> priority sites for conservation(Van Swaay & Warren, 2003). In Britain, whilst theUK Biodiversity Action Plan (UK BAP) is well established asthe principle mechanism to define priorities and implement conservationaction, this <strong>new</strong> <strong>Red</strong> <strong>List</strong> assessment provides animportant foundation and shows the ongoing deterioration <strong>of</strong>many butterfly populations. Although UK BAP priorities aredrawn up using different criteria (UK Biodiversity Group, 1998;Bourn et al., 2005), both lists include many <strong>of</strong> the same speciesand highlight the serious extinction risk facing <strong>butterflies</strong> inGreat Britain.AcknowledgementsIt would have been impossible to assess the threat status <strong>of</strong> Britain’s<strong>butterflies</strong> without the efforts <strong>of</strong> thousands <strong>of</strong> skilled anddedicated volunteer recorders. We are deeply indebted to themand to the organisations that have supported butterfly recordingand monitoring, especially the Bernard Sunley Charitable Foundation,Centre for Ecology and Hydrology, Esmée FairbairnFoundation, The John Ellerman Foundation, Joint Nature<strong>Conservation</strong> Committee, Natural England, Vincent WildlifeTrust and the multi-agency consortium (led by Defra) that fundsthe UKBMS. Dr Jim Asher <strong>of</strong> <strong>Butterfly</strong> <strong>Conservation</strong> made asubstantial contribution to the development <strong>of</strong> methods andanalysis <strong>of</strong> trends utilised in this assessment. We are grateful toDr Thomas Merckx and an anonymous reviewer for commentson this article and to Deborah Procter <strong>of</strong> the Joint Nature <strong>Conservation</strong>Committee for commissioning the assessment as part<strong>of</strong> the Species Status Assessment project, which aims to assessthe threat status <strong>of</strong> the <strong>British</strong> flora and fauna using internationallyapproved IUCN criteria.ReferencesAkçakaya, H.R., Butchart, S.H.M., Mace, G.M., Stuart, S.N. &Hilton-Taylor, C. (2006) Use and misuse <strong>of</strong> the IUCN <strong>Red</strong> <strong>List</strong>Criteria in projecting climate change impacts on biodiversity.Global Change Biology, 12, 2037–2043.Asher, J., Warren, M., Fox, R., Harding, P., Jeffcoate, G. & Jeffcoate,S. (2001) The Millennium Atlas <strong>of</strong> Butterflies in Britainand Ireland. Oxford University Press, Oxford, UK.Bourn, N.A.D., McCracken, M.E., Wigglesworth, T., Brereton,T., Fox, R., Roy, D. & Warren, M.S. (2005) Proposed changesto the BAP priority species list: <strong>butterflies</strong>. <strong>Butterfly</strong> <strong>Conservation</strong>Report SO5-23, <strong>Butterfly</strong> <strong>Conservation</strong>, Wareham, UK.Bulman, C.R., Wilson, R.J., Holt, A.R., Ga´lvez Bravo, L., Early,R.I., Warren, M.S. & Thomas, C.D. (2007) Minimum viablemetapopulation size, extinction debt, and the conservation <strong>of</strong> adeclining species. Ecological Applications, 17, 1460–1473.Butchart, S.H.M., Stattersfield, A.J., Baillie, J., Bennun, L.A.,Stuart, S.N., Akçakaya, H.R., Hilton-Taylor, C. & Mace,G.M. (2005) Using <strong>Red</strong> <strong>List</strong> indices to measure progresstowards the 2010 target and beyond. Philosophical Transactions<strong>of</strong> the Royal Society B, 360, 255–268.Cheffings, C.M. & Farrell, L. (2005) The Vascular Plant <strong>Red</strong>Data <strong>List</strong> for Great Britain. Species Status 7. Joint Nature <strong>Conservation</strong>Committee, Peterborough, UK.Conrad, K.F., Warren, M., Fox, R., Parsons, M. & Woiwod, I.P.(2006) Rapid declines <strong>of</strong> common, widespread <strong>British</strong> mothsprovide evidence <strong>of</strong> an insect biodiversity crisis. Biological <strong>Conservation</strong>,132, 279–291.Cowley, M.J.R., Thomas, C.D., Thomas, J.A. & Warren, M.S.(1999) Flight areas <strong>of</strong> <strong>British</strong> <strong>butterflies</strong>: assessing species statusand decline. Proceedings <strong>of</strong> the Royal Society B, 266, 1587–1592.Daguet, C.A., French, G.C. & Taylor, P. (2008) The Odonata<strong>Red</strong> Data <strong>List</strong> for Great Britain. Species Status Assessment 11.Joint Nature <strong>Conservation</strong> Committee, Peterborough, UK.De Heer, M., Kapos, V. & ten Brink, B.J.E. (2005) Biodiversitytrends in Europe: development and testing <strong>of</strong> a species trendindicator for evaluating progress towards the 2010 target.Philosophical Transactions <strong>of</strong> the Royal Society B, 360, 297–308.Dennis, R.L.H., Sparks, T.H. & Hardy, P.B. (1999) Bias in butterflydistribution maps: the effects <strong>of</strong> sampling effort. Journal<strong>of</strong> Insect <strong>Conservation</strong>, 3, 33–42.Dunn, E.H. (2002) Using decline in bird populations to identifyneeds for conservation action. <strong>Conservation</strong> Biology, 16, 1632–1637.Dunn, R.R. (2005) Modern insect extinctions, the neglectedmajority. <strong>Conservation</strong> Biology, 19, 1030–1036.Eaton, M.A., Gregory, R.D., Noble, D.G., Robinson, J.A.,Hughes, J., Procter, D., Brown, A.F. & Gibbons, D.W. (2005)Regional IUCN <strong>Red</strong> <strong>List</strong>ing: the process as applied to birds inthe United Kingdom. <strong>Conservation</strong> Biology, 19, 1557–1570.Fitzpatrick, U., Murray, T.E., Paxton, R.J. & Brown, M.J.F.(2007) Building on IUCN regional <strong>Red</strong> <strong>List</strong>s to produce lists <strong>of</strong>species <strong>of</strong> conservation priority: a model with Irish bees. <strong>Conservation</strong>Biology, 21, 1324–1332.Fox, R., Asher, J., Brereton, T., Roy, D. & Warren, M. (2006)The State <strong>of</strong> Butterflies in Britain and Ireland. Pisces Publications,Newbury, UK.Fox, R. & Dennis, R.L.H. (2010) Winter survival <strong>of</strong> Vanessa atalanta(Linnaeus, 1758) (Lepidoptera: Nymphalidae): a <strong>new</strong> residentbutterfly for Britain and Ireland? Entomologist’s Gazette,61, 94–103.Fox, R., Roy, D.B., Dennis, R.L.H. & Asher, J. (2010) A <strong>new</strong>look at the changing distributions <strong>of</strong> <strong>British</strong> <strong>butterflies</strong>: differentanalysis, same results. Entomologist’s Gazette, 61, 225–234.Ó 2010 The AuthorsInsect <strong>Conservation</strong> and Diversity Ó 2010 The Royal Entomological Society, Insect <strong>Conservation</strong> and Diversity
<strong>Red</strong> <strong>List</strong> <strong>of</strong> <strong>British</strong> <strong>butterflies</strong> 13Gärdenfors, U., Hilton-Taylor, C., Mace, G.M. & Rodríguez,J.P. (2001) The application <strong>of</strong> IUCN <strong>Red</strong> <strong>List</strong> criteria at regionallevels. <strong>Conservation</strong> Biology, 15, 1206–1212.Gaston, K.J. & Fuller, R.A. (2009) The sizes <strong>of</strong> species’ geographicranges. Journal <strong>of</strong> Applied Ecology, 46, 1–9.Hanski, I. & Thomas, C.D. (1994) Metapopulation dynamics andconservation: a spatially explicit model applied to <strong>butterflies</strong>.Biological <strong>Conservation</strong>, 68, 167–180.Hartley, S. & Kunin, W.E. (2003) Scale dependency <strong>of</strong> rarity,extinction risk, and conservation priority. <strong>Conservation</strong> Biology,17, 1559–1570.Heath, J., Pollard, E. & Thomas, J. (1984) Atlas <strong>of</strong> Butterflies inBritain and Ireland. Viking, Harmondsworth, UK.IUCN (2001) IUCN <strong>Red</strong> <strong>List</strong> Categories and Criteria: Version3.1. IUCN Species Survival Commission, Gland, Switzerlandand Cambridge, UK.IUCN (2003) Guidelines for Using the IUCN <strong>Red</strong> <strong>List</strong> Categoriesand Criteria. IUCN Species Survival Commission, Gland, Switzerlandand Cambridge, UK.Keller, V., Zbinden, N., Schmid, H. & Volet, B. (2005) A casestudy in applying the IUCN regional guidelines for national<strong>Red</strong> <strong>List</strong>s and justifications for their modification. <strong>Conservation</strong>Biology, 19, 1827–1834.Konvicka, M., Fric, Z. & Benes, J. (2006) <strong>Butterfly</strong> extinctions inEuropean states: do socioeconomic conditions matter morethan physical geography? Global Ecology and Biogeography, 15,82–92.Lamoreux, J., Akçakaya, H.R., Bennun, L., Collar, N.J., Boitani,L., Brackett, D., Brautigam, A., Brooks, T.M., Fonseca,G.A.B. & Mittermeier, R.A. (2003) Value <strong>of</strong> the IUCN <strong>Red</strong><strong>List</strong>. Trends in Ecology & Evolution, 18, 214–215.Lewis, O.T. & Senior, M.J.M. (2010) Assessing conservation statusand trends for the world’s <strong>butterflies</strong>: the Sampled <strong>Red</strong> <strong>List</strong>Index approach. Journal <strong>of</strong> Insect <strong>Conservation</strong>, DOI: 10.1007/s10841-010-9329-8.Mace, G.M., Collar, N.J., Gaston, K.J., Hilton-Taylor, C., Akçakaya,H.R., Leader-Williams, N., Milner-Gulland, E.J. & Stuart,S.N. (2008) Quantification <strong>of</strong> extinction risk: IUCN’ssystem for classifying threatened species. <strong>Conservation</strong> Biology,22, 1424–1442.Maes, D. & Van Dyck, H. (2001) <strong>Butterfly</strong> diversity loss in Flanders(north Belgium): Europe’s worst case scenario? Biological<strong>Conservation</strong>, 99, 263–276.New, T.R. (1997) <strong>Butterfly</strong> <strong>Conservation</strong>. Oxford University Press,Oxford, UK.Pannekoek, J. & van Strien, A. (1996) TRIM (TRends & Indicesfor Monitoring Data). Statistics Netherlands, Voorburg, TheNetherlands.Pollard, E., Hall, M.L. & Bibby, T.J. (1986) Monitoring theAbundance <strong>of</strong> Butterflies 1976–1985. Nature ConservancyCouncil, Peterborough, UK.Pollard, E. & Yates, T.J. (1993) Monitoring Butterflies for Ecologyand <strong>Conservation</strong>. Chapman & Hall, London, UK.Regan, T.J., Burgman, M.A., McCarthy, M.A., Master, L.L.,Keith, D.A., Mace, G.M. & Andelman, S.J. (2005) The consistency<strong>of</strong> extinction risk classification protocols. <strong>Conservation</strong>Biology, 19, 1969–1977.Rodrigues, A.S.L., Pilgrim, J.D., Lamoreux, J.F., H<strong>of</strong>fmann, M.& Brooks, T.M. (2006) The value <strong>of</strong> the IUCN <strong>Red</strong> <strong>List</strong> forconservation. Trends in Ecology and Evolution, 21, 71–76.Schtickzelle, N. & Baguette, M. (2009) (Meta)population viabilityanalysis: a crystal ball for the conservation <strong>of</strong> endangered <strong>butterflies</strong>?Ecology <strong>of</strong> Butterflies in Europe (ed. by J. Settele, T.Shreeve, M. Konvička and H. Van Dyck), pp. 339–352. CambridgeUniversity Press, Cambridge, UK.Shirt, D.B. (1987) <strong>British</strong> red Data Books, Number 2 Insects. NatureConservancy Council, Peterborough, UK.Thomas, J.A. (2005) Monitoring change in the abundance anddistribution <strong>of</strong> insects using <strong>butterflies</strong> and other indicatorgroups. Philosophical Transactions <strong>of</strong> the Royal Society B, 360,339–357.Thomas, C.D. & Abery, J.C.G. (1995) Estimating rates <strong>of</strong> butterflydecline from distribution maps: the effect <strong>of</strong> scale. Biological<strong>Conservation</strong>, 73, 59–65.Thomas, C.D., Bulman, C.R. & Wilson, R.J. (2008) Wherewithin a geographical range do species survive best? A matter<strong>of</strong> scale Insect <strong>Conservation</strong> and Diversity, 1, 2–8.Thomas, J.A., Telfer, M.G., Roy, D.B., Preston, C.D., Greenwood,J.J.D., Asher, J., Fox, R., Clarke, R.T. & Lawton, J.H.(2004) Comparative losses <strong>of</strong> <strong>British</strong> <strong>butterflies</strong>, birds, andplants and the global extinction crisis. Science, 303, 1879–1881.UK Biodiversity Group (1998) Tranche 2 Action Plans. Volume 1– Vertebrates and Vascular Plants. English Nature, Peterborough,UK.Van Dyck, H., van Strien, A.J., Maes, D. & van Swaay, C.A.M.(2009) Declines in common, widespread <strong>butterflies</strong> in a landscapeunder intense human use. <strong>Conservation</strong> Biology, 23, 957–965.Van Swaay, C., Cuttelod, A., Collins, S., Maes, D., Lopez Munguira,M., Sˇasˇic´, M., Settele, J., Verovnik, R., Verstrael, T.,Warren, M., Wiemers, M. & Wynh<strong>of</strong>, I. (2010) European red<strong>List</strong> <strong>of</strong> Butterfies. Publications Office <strong>of</strong> the European Union,Luxembourg.Van Swaay, C.A.M., Maes, D. & Warren, M.S. (2009) <strong>Conservation</strong>status <strong>of</strong> European <strong>butterflies</strong>. Ecology <strong>of</strong> Butterflies inEurope (ed. by J. Settele, T. Shreeve, M. Konvička and H. VanDyck), pp.322–338. Cambridge University Press, Cambridge,UK.Van Swaay, C.A.M., Nowicki, P., Settele, J. & van Strien, A.J.(2008) <strong>Butterfly</strong> monitoring in Europe: methods, applicationsand perspectives. Biodiversity and <strong>Conservation</strong>, 17, 3455–3469.Van Swaay, C. & Warren, M.S. (1999) <strong>Red</strong> Data Book <strong>of</strong> EuropeanButterflies (Rhopalocera). Nature and Environment, No.99, Council <strong>of</strong> Europe, Strasbourg, France.Van Swaay, C. & Warren, M.S. (2003) Prime <strong>Butterfly</strong> Areas inEurope. National Reference Centre for Agriculture, Nature andFisheries, Ministry <strong>of</strong> Agriculture, Nature Management andFisheries, Wageningen, The Netherlands.Van Swaay, C., Warren, M.S. & Loïs, G. (2006) Biotope use andtrends <strong>of</strong> European <strong>butterflies</strong>. Journal <strong>of</strong> Insect <strong>Conservation</strong>,10, 189–209.Warren, M.S., Barnett, L.K., Gibbons, D.W. & Avery, M.I.(1997) Assessing national conservation priorities: an improvedred list <strong>of</strong> <strong>British</strong> <strong>butterflies</strong>. Biological <strong>Conservation</strong>, 82, 317–328.Warren, M.S., Bourn, N., Brereton, T., Fox, R., Middlebrook, I.& Parsons, M. (2007) What have <strong>Red</strong> <strong>List</strong>s done for us? Thevalue and limitation <strong>of</strong> protected species listing for invertebrates.Insect <strong>Conservation</strong> Biology (ed. by A.J.A. Stewart, T.R.New and O.T. Lewis), pp. 76–91. CABI publishing, Wallingford,UK.Warren, M.S., Hill, J.K., Thomas, J.A., Asher, J., Fox, R., Huntley,B., Roy, D.B., Telfer, M.G., Jeffcoate, S., Harding, P., Jeffcoate,G., Willis, S.G., Greatorex-Davies, J.N., Moss, D. &Thomas, C.D. (2001) Rapid responses <strong>of</strong> <strong>British</strong> <strong>butterflies</strong> toÓ 2010 The AuthorsInsect <strong>Conservation</strong> and Diversity Ó 2010 The Royal Entomological Society, Insect <strong>Conservation</strong> and Diversity
14 Richard Fox et al.opposing forces <strong>of</strong> climate and habitat change. Nature, 414,65–69.Wenzel, M., Schmitt, T., Weitzel, M. & Seitz, A. (2006) Thesevere decline <strong>of</strong> <strong>butterflies</strong> on western German calcareousgrasslands during the last 30 years: a conservation problem.Biological <strong>Conservation</strong>, 128, 542–552.Wilson, R.J., Davies, Z.G. & Thomas, C.D. (2009) Modellingthe effect <strong>of</strong> habitat fragmentation on range expansion in abutterfly. Proceedings <strong>of</strong> the Royal Society B, 276, 1421–1427.Wilson, R.J., Gutiérrez, D., Gutiérrez, J. & Monserrat, V.J.(2007) An elevational shift in butterfly species richness andcomposition accompanying recent climate change. GlobalChange Biology, 13, 1873–1887.Accepted 3 September 2010Editor: Simon LeatherAssociate editor: Phil DeVriesÓ 2010 The AuthorsInsect <strong>Conservation</strong> and Diversity Ó 2010 The Royal Entomological Society, Insect <strong>Conservation</strong> and Diversity