Namibia Second National Communication to UNFCCC 2011.pdf
Namibia Second National Communication to UNFCCC 2011.pdf
Namibia Second National Communication to UNFCCC 2011.pdf

Create successful ePaper yourself
Turn your PDF publications into a flip-book with our unique Google optimized e-Paper software.
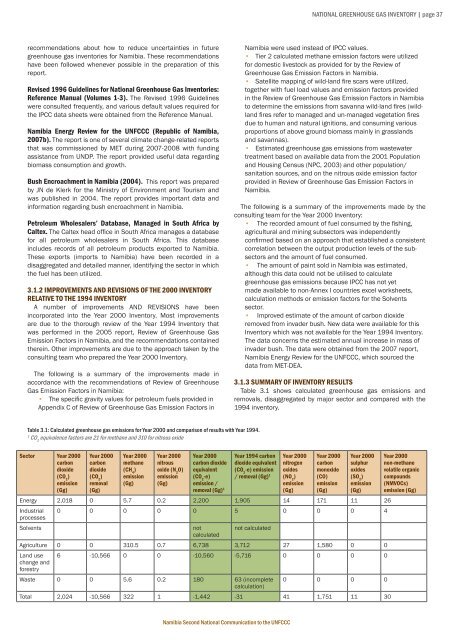
NATIONAL GREENHOUSE GAS INVENTORY | page 37recommendations about how <strong>to</strong> reduce uncertainties in futuregreenhouse gas inven<strong>to</strong>ries for <strong>Namibia</strong>. These recommendationshave been followed whenever possible in the preparation of thisreport.Revised 1996 Guidelines for <strong>National</strong> Greenhouse Gas Inven<strong>to</strong>ries:Reference Manual (Volumes 1-3). The Revised 1996 Guidelineswere consulted frequently, and various default values required forthe IPCC data sheets were obtained from the Reference Manual.<strong>Namibia</strong> Energy Review for the <strong>UNFCCC</strong> (Republic of <strong>Namibia</strong>,2007b). The report is one of several climate change-related reportsthat was commissioned by MET during 2007-2008 with fundingassistance from UNDP. The report provided useful data regardingbiomass consumption and growth.Bush Encroachment in <strong>Namibia</strong> (2004). This report was preparedby JN de Klerk for the Ministry of Environment and Tourism andwas published in 2004. The report provides important data andinformation regarding bush encroachment in <strong>Namibia</strong>.Petroleum Wholesalers’ Database, Managed in South Africa byCaltex. The Caltex head office in South Africa manages a databasefor all petroleum wholesalers in South Africa. This databaseincludes records of all petroleum products exported <strong>to</strong> <strong>Namibia</strong>.These exports (imports <strong>to</strong> <strong>Namibia</strong>) have been recorded in adisaggregated and detailed manner, identifying the sec<strong>to</strong>r in whichthe fuel has been utilized.3.1.2 IMPROVEMENTS AND REVISIONS OF THE 2000 INVENTORYRELATIVE TO THE 1994 INVENTORYA number of improvements AND REVISIONS have beenincorporated in<strong>to</strong> the Year 2000 Inven<strong>to</strong>ry. Most improvementsare due <strong>to</strong> the thorough review of the Year 1994 Inven<strong>to</strong>ry thatwas performed in the 2005 report, Review of Greenhouse GasEmission Fac<strong>to</strong>rs in <strong>Namibia</strong>, and the recommendations containedtherein. Other improvements are due <strong>to</strong> the approach taken by theconsulting team who prepared the Year 2000 Inven<strong>to</strong>ry.The following is a summary of the improvements made inaccordance with the recommendations of Review of GreenhouseGas Emission Fac<strong>to</strong>rs in <strong>Namibia</strong>:• The specific gravity values for petroleum fuels provided inAppendix C of Review of Greenhouse Gas Emission Fac<strong>to</strong>rs in<strong>Namibia</strong> were used instead of IPCC values.• Tier 2 calculated methane emission fac<strong>to</strong>rs were utilizedfor domestic lives<strong>to</strong>ck as provided for by the Review ofGreenhouse Gas Emission Fac<strong>to</strong>rs in <strong>Namibia</strong>.• Satellite mapping of wild-land fire scars were utilized,<strong>to</strong>gether with fuel load values and emission fac<strong>to</strong>rs providedin the Review of Greenhouse Gas Emission Fac<strong>to</strong>rs in <strong>Namibia</strong><strong>to</strong> determine the emissions from savanna wild-land fires (wildlandfires refer <strong>to</strong> managed and un-managed vegetation firesdue <strong>to</strong> human and natural ignitions, and consuming variousproportions of above ground biomass mainly in grasslandsand savannas).• Estimated greenhouse gas emissions from wastewatertreatment based on available data from the 2001 Populationand Housing Census (NPC, 2003) and other population/sanitation sources, and on the nitrous oxide emission fac<strong>to</strong>rprovided in Review of Greenhouse Gas Emission Fac<strong>to</strong>rs in<strong>Namibia</strong>.The following is a summary of the improvements made by theconsulting team for the Year 2000 Inven<strong>to</strong>ry:• The recorded amount of fuel consumed by the fishing,agricultural and mining subsec<strong>to</strong>rs was independentlyconfirmed based on an approach that established a consistentcorrelation between the output production levels of the subsec<strong>to</strong>rsand the amount of fuel consumed.• The amount of paint sold in <strong>Namibia</strong> was estimated,although this data could not be utilised <strong>to</strong> calculategreenhouse gas emissions because IPCC has not yetmade available <strong>to</strong> non-Annex I countries excel worksheets,calculation methods or emission fac<strong>to</strong>rs for the Solventssec<strong>to</strong>r.• Improved estimate of the amount of carbon dioxideremoved from invader bush. New data were available for thisInven<strong>to</strong>ry which was not available for the Year 1994 Inven<strong>to</strong>ry.The data concerns the estimated annual increase in mass ofinvader bush. The data were obtained from the 2007 report,<strong>Namibia</strong> Energy Review for the <strong>UNFCCC</strong>, which sourced thedata from MET-DEA.3.1.3 SUMMARY OF INVENTORY RESULTSTable 3.1 shows calculated greenhouse gas emissions andremovals, disaggregated by major sec<strong>to</strong>r and compared with the1994 inven<strong>to</strong>ry.Table 3.1: Calculated greenhouse gas emissions for Year 2000 and comparison of results with Year 1994.1CO 2equivalence fac<strong>to</strong>rs are 21 for methane and 310 for nitrous oxideSec<strong>to</strong>r Year 2000carbondioxide(CO 2)emission(Gg)Year 2000carbondioxide(CO 2)removal(Gg)Year 2000methane(CH 4)emission(Gg)Year 2000nitrousoxide (N 2O)emission(Gg)Year 2000carbon dioxideequivalent(CO 2-e)emission /removal (Gg) 1Year 1994 carbon Year 2000dioxide equivalent nitrogen(CO 2-e) emission oxides/ removal (Gg) 1 (NO 2)emission(Gg)Year 2000carbonmonoxide(CO)emission(Gg)Year 2000sulphuroxides(SO 2)emission(Gg)Energy 2,018 0 5.7 0.2 2,200 1,905 14 171 11 26IndustrialprocessesSolvents0 0 0 0 0 5 0 0 0 4notcalculatednot calculatedAgriculture 0 0 310.5 0.7 6,738 3,712 27 1,580 0 0Land usechange andforestry6 -10,566 0 0 -10,560 -5,716 0 0 0 0Waste 0 0 5.6 0.2 180 63 (incompletecalculation)0 0 0 0Total 2,024 -10,566 322 1 -1,442 -31 41 1,751 11 30Year 2000non-methanevolatile organiccompounds(NMVOCs)emission (Gg)<strong>Namibia</strong> <strong>Second</strong> <strong>National</strong> <strong>Communication</strong> <strong>to</strong> the <strong>UNFCCC</strong>