Namibia Second National Communication to UNFCCC 2011.pdf
Namibia Second National Communication to UNFCCC 2011.pdf
Namibia Second National Communication to UNFCCC 2011.pdf

You also want an ePaper? Increase the reach of your titles
YUMPU automatically turns print PDFs into web optimized ePapers that Google loves.
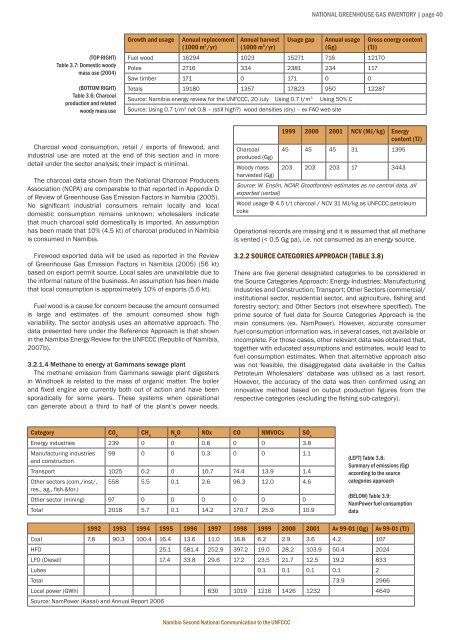
NATIONAL GREENHOUSE GAS INVENTORY | page 40(TOP RIGHT)Table 3.7: Domestic woodymass use (2004)(BOTTOM RIGHT)Table 3.6: Charcoalproduction and relatedwoody mass useGrowth and usageAnnual replacement(1000 m 3 /yr)Annual harvest(1000 m 3 /yr)Usage gapAnnual usage(Gg)Fuel wood 16294 1023 15271 716 12170Poles 2716 334 2381 234 117Saw timber 171 0 171 0 0Totals 19180 1357 17823 950 12287Source: <strong>Namibia</strong> energy review for the <strong>UNFCCC</strong>, 20 July Using 0.7 t/m 3Using 50% CSource: Using 0.7 t/m 3 not 0.8 – (still high?) wood densities (dry) – ex FAO web siteGross energy content(TJ)Charcoal wood consumption, retail / exports of firewood, andindustrial use are noted at the end of this section and in moredetail under the sec<strong>to</strong>r analysis; their impact is minimal.The charcoal data shown from the <strong>National</strong> Charcoal ProducersAssociation (NCPA) are comparable <strong>to</strong> that reported in Appendix Dof Review of Greenhouse Gas Emission Fac<strong>to</strong>rs in <strong>Namibia</strong> (2005).No significant industrial consumers remain locally and localdomestic consumption remains unknown; wholesalers indicatethat much charcoal sold domestically is imported. An assumptionhas been made that 10% (4.5 kt) of charcoal produced in <strong>Namibia</strong>is consumed in <strong>Namibia</strong>.Firewood exported data will be used as reported in the Reviewof Greenhouse Gas Emission Fac<strong>to</strong>rs in <strong>Namibia</strong> (2005) (56 kt)based on export permit source. Local sales are unavailable due <strong>to</strong>the informal nature of the business. An assumption has been madethat local consumption is approximately 10% of exports (5.6 kt).Fuel wood is a cause for concern because the amount consumedis large and estimates of the amount consumed show highvariability. The sec<strong>to</strong>r analysis uses an alternative approach. Thedata presented here under the Reference Approach is that shownin the <strong>Namibia</strong> Energy Review for the <strong>UNFCCC</strong> (Republic of <strong>Namibia</strong>,2007b).3.2.1.4 Methane <strong>to</strong> energy at Gammans sewage plantThe methane emission from Gammans sewage plant digestersin Windhoek is related <strong>to</strong> the mass of organic matter. The boilerand fixed engine are currently both out of action and have beensporadically for some years. These systems when operationalcan generate about a third <strong>to</strong> half of the plant’s power needs.Charcoalproduced (Gg)Woody massharvested (Gg)1999 2000 2001 NCV (MJ/kg) Energycontent (TJ)45 45 45 31 1395203 203 203 17 3443Source: W. Enslin, NCAP, Grootfontein estimates as no central data, allexported (verbal)Wood usage @ 4.5 t/t charcoal / NCV 31 MJ/kg as <strong>UNFCCC</strong> petroleumcokeOperational records are missing and it is assumed that all methaneis vented (< 0.5 Gg pa), i.e. not consumed as an energy source.3.2.2 SOURCE CATEGORIES APPROACH (TABLE 3.8)There are five general designated categories <strong>to</strong> be considered inthe Source Categories Approach: Energy Industries; ManufacturingIndustries and Construction; Transport; Other Sec<strong>to</strong>rs (commercial/institutional sec<strong>to</strong>r, residential sec<strong>to</strong>r, and agriculture, fishing andforestry sec<strong>to</strong>r); and Other Sec<strong>to</strong>rs (not elsewhere specified). Theprime source of fuel data for Source Categories Approach is themain consumers (ex. NamPower). However, accurate consumerfuel consumption information was, in several cases, not available orincomplete. For those cases, other relevant data was obtained that,<strong>to</strong>gether with educated assumptions and estimates, would lead <strong>to</strong>fuel consumption estimates. When that alternative approach alsowas not feasible, the disaggregated data available in the CaltexPetroleum Wholesalers’ database was utilised as a last resort.However, the accuracy of the data was then confirmed using aninnovative method based on output production figures from therespective categories (excluding the fishing sub-category).Category CO 2CH 4N 2O NOx CO NMVOCs SO xEnergy industries 239 0 0 0.6 0 0 3.8Manufacturing industriesand construction99 0 0 0.3 0 0 1.1Transport 1025 0.2 0 10.7 74.4 13.9 1.4Other sec<strong>to</strong>rs (com./inst/,res., ag., fish.&for.)558 5.5 0.1 2.6 96.3 12.0 4.6Other sec<strong>to</strong>r (mining) 97 0 0 0 0 0 0Total 2018 5.7 0.1 14.2 170.7 25.9 10.9(LEFT) Table 3.8:Summary of emissions (Gg)according <strong>to</strong> the sourcecategories approach(BELOW) Table 3.9:NamPower fuel consumptiondata1992 1993 1994 1995 1996 1997 1998 1999 2000 2001 Av 99-01 (Gg) Av 99-01 (TJ)Coal 7.8 90.3 100.4 16.4 13.6 11.0 16.8 6.2 2.9 3.6 4.2 107HFO 25.1 581.4 252.9 397.2 19.0 28.2 103.9 50.4 2024LFO (Diesel) 17.4 33.8 29.6 17.2 23.5 21.7 12.5 19.2 833Lubes 0.1 0.1 0.1 0.1 2Total 73.9 2966Local power (GWh) 630 1019 1216 1426 1232 4649Source: NamPower (Kasai) and Annual Report 2006<strong>Namibia</strong> <strong>Second</strong> <strong>National</strong> <strong>Communication</strong> <strong>to</strong> the <strong>UNFCCC</strong>