BOEING COMMERCIAL AIRPLANES Marketing June 2003
BOEING COMMERCIAL AIRPLANES Marketing June 2003
BOEING COMMERCIAL AIRPLANES Marketing June 2003

You also want an ePaper? Increase the reach of your titles
YUMPU automatically turns print PDFs into web optimized ePapers that Google loves.
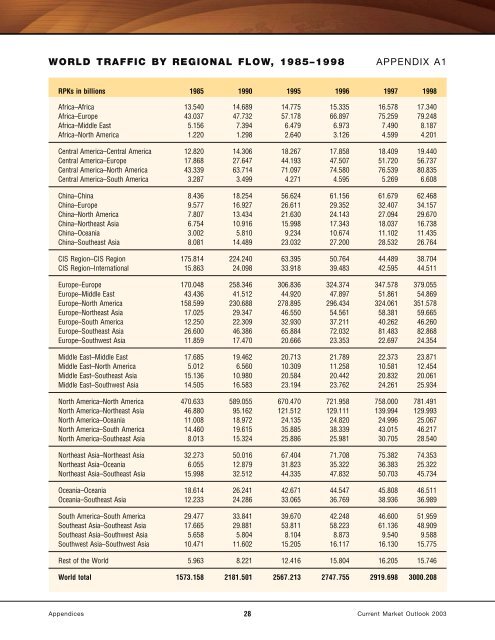
WORLD TRAFFIC BY REGIONAL FLOW, 1985–1998APPENDIX A1RPKs in billions 1985 1990 1995 1996 1997 1998Africa–Africa 13.540 14.689 14.775 15.335 16.578 17.340Africa–Europe 43.037 47.732 57.178 66.897 75.259 79.248Africa–Middle East 5.156 7.394 6.479 6.973 7.490 8.187Africa–North America 1.220 1.298 2.640 3.126 4.599 4.201Central America–Central America 12.820 14.306 18.267 17.858 18.409 19.440Central America–Europe 17.868 27.647 44.193 47.507 51.720 56.737Central America–North America 43.339 63.714 71.097 74.580 76.539 80.835Central America–South America 3.287 3.499 4.271 4.595 5.269 6.608China–China 8.436 18.254 56.624 61.156 61.679 62.468China–Europe 9.577 16.927 26.611 29.352 32.407 34.157China–North America 7.807 13.434 21.630 24.143 27.094 29.670China–Northeast Asia 6.754 10.916 15.998 17.343 18.037 16.738China–Oceania 3.002 5.810 9.234 10.674 11.102 11.435China–Southeast Asia 8.081 14.489 23.032 27.200 28.532 26.764CIS Region–CIS Region 175.814 224.240 63.395 50.764 44.489 38.704CIS Region–International 15.863 24.098 33.918 39.483 42.595 44.511Europe–Europe 170.048 258.346 306.836 324.374 347.578 379.055Europe–Middle East 43.436 41.512 44.920 47.897 51.861 54.869Europe–North America 158.599 230.688 278.895 296.434 324.061 351.578Europe–Northeast Asia 17.025 29.347 46.550 54.561 58.381 59.665Europe–South America 12.250 22.309 32.930 37.211 40.262 46.260Europe–Southeast Asia 26.600 46.386 65.884 72.032 81.483 82.868Europe–Southwest Asia 11.859 17.470 20.666 23.353 22.697 24.354Middle East–Middle East 17.685 19.462 20.713 21.789 22.373 23.871Middle East–North America 5.012 6.560 10.309 11.258 10.581 12.454Middle East–Southeast Asia 15.136 10.980 20.584 20.442 20.832 20.061Middle East–Southwest Asia 14.505 16.583 23.194 23.762 24.261 25.934North America–North America 470.633 589.055 670.470 721.958 758.000 781.491North America–Northeast Asia 46.880 95.162 121.512 129.111 139.994 129.993North America–Oceania 11.008 18.972 24.135 24.820 24.996 25.067North America–South America 14.460 19.615 35.885 38.339 43.015 46.217North America–Southeast Asia 8.013 15.324 25.886 25.981 30.705 28.540Northeast Asia–Northeast Asia 32.273 50.016 67.404 71.708 75.382 74.353Northeast Asia–Oceania 6.055 12.879 31.823 35.322 36.383 25.322Northeast Asia–Southeast Asia 15.998 32.512 44.335 47.832 50.703 45.734Oceania–Oceania 18.614 26.241 42.671 44.547 45.808 46.511Oceania–Southeast Asia 12.233 24.286 33.065 36.769 38.936 36.989South America–South America 29.477 33.841 39.670 42.248 46.600 51.959Southeast Asia–Southeast Asia 17.665 29.881 53.811 58.223 61.136 48.909Southeast Asia–Southwest Asia 5.658 5.804 8.104 8.873 9.540 9.588Southwest Asia–Southwest Asia 10.471 11.602 15.205 16.117 16.130 15.775Rest of the World 5.963 8.221 12.416 15.804 16.205 15.746World total 1573.158 2181.501 2567.213 2747.755 2919.698 3000.208Appendices28 Current Market Outlook <strong>2003</strong>