

PDF: 477 KB - Bureau of Infrastructure, Transport and Regional ...
PDF: 477 KB - Bureau of Infrastructure, Transport and Regional ...
PDF: 477 KB - Bureau of Infrastructure, Transport and Regional ...

You also want an ePaper? Increase the reach of your titles
YUMPU automatically turns print PDFs into web optimized ePapers that Google loves.
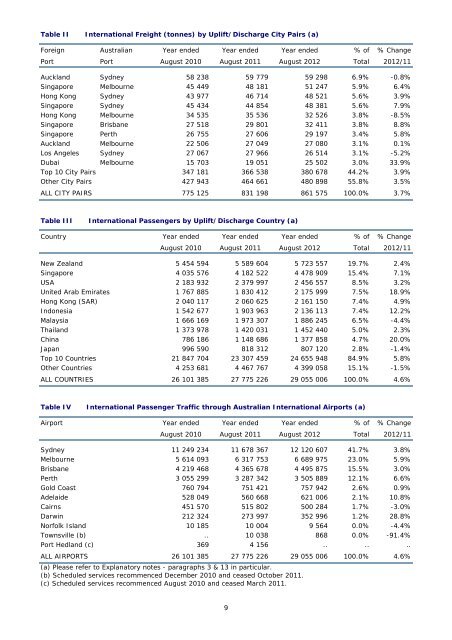
Table IIInternational Freight (tonnes) by Uplift/Discharge City Pairs (a)Foreign Australian Year ended Year ended Year ended % <strong>of</strong> % ChangePort Port August 2010 August 2011 August 2012 Total 2012/11Auckl<strong>and</strong> Sydney 58 238 59 779 59 298 6.9% -0.8%Singapore Melbourne 45 449 48 181 51 247 5.9% 6.4%Hong Kong Sydney 43 977 46 714 48 521 5.6% 3.9%Singapore Sydney 45 434 44 854 48 381 5.6% 7.9%Hong Kong Melbourne 34 535 35 536 32 526 3.8% -8.5%Singapore Brisbane 27 518 29 801 32 411 3.8% 8.8%Singapore Perth 26 755 27 606 29 197 3.4% 5.8%Auckl<strong>and</strong> Melbourne 22 506 27 049 27 080 3.1% 0.1%Los Angeles Sydney 27 067 27 966 26 514 3.1% -5.2%Dubai Melbourne 15 703 19 051 25 502 3.0% 33.9%Top 10 City Pairs 347 181 366 538 380 678 44.2% 3.9%Other City Pairs 427 943 464 661 480 898 55.8% 3.5%ALL CITY PAIRS 775 125 831 198 861 575 100.0% 3.7%Table IIIInternational Passengers by Uplift/Discharge Country (a)Country Year ended Year ended Year ended % <strong>of</strong> % ChangeAugust 2010 August 2011 August 2012 Total 2012/11New Zeal<strong>and</strong> 5 454 594 5 589 604 5 723 557 19.7% 2.4%Singapore 4 035 576 4 182 522 4 478 909 15.4% 7.1%USA 2 183 932 2 379 997 2 456 557 8.5% 3.2%United Arab Emirates 1 767 885 1 830 412 2 175 999 7.5% 18.9%Hong Kong (SAR) 2 040 117 2 060 625 2 161 150 7.4% 4.9%Indonesia 1 542 677 1 903 963 2 136 113 7.4% 12.2%Malaysia 1 666 169 1 973 307 1 886 245 6.5% -4.4%Thail<strong>and</strong> 1 373 978 1 420 031 1 452 440 5.0% 2.3%China 786 186 1 148 686 1 377 858 4.7% 20.0%Japan 996 590 818 312 807 120 2.8% -1.4%Top 10 Countries 21 847 704 23 307 459 24 655 948 84.9% 5.8%Other Countries 4 253 681 4 467 767 4 399 058 15.1% -1.5%ALL COUNTRIES 26 101 385 27 775 226 29 055 006 100.0% 4.6%Table IVInternational Passenger Traffic through Australian International Airports (a)Airport Year ended Year ended Year ended % <strong>of</strong> % ChangeAugust 2010 August 2011 August 2012 Total 2012/11Sydney 11 249 234 11 678 367 12 120 607 41.7% 3.8%Melbourne 5 614 093 6 317 753 6 689 975 23.0% 5.9%Brisbane 4 219 468 4 365 678 4 495 875 15.5% 3.0%Perth 3 055 299 3 287 342 3 505 889 12.1% 6.6%Gold Coast 760 794 751 421 757 942 2.6% 0.9%Adelaide 528 049 560 668 621 006 2.1% 10.8%Cairns 451 570 515 802 500 284 1.7% -3.0%Darwin 212 324 273 997 352 996 1.2% 28.8%Norfolk Isl<strong>and</strong> 10 185 10 004 9 564 0.0% -4.4%Townsville (b) .. 10 038 868 0.0% -91.4%Port Hedl<strong>and</strong> (c) 369 4 156 .. .. ..ALL AIRPORTS 26 101 385 27 775 226 29 055 006 100.0% 4.6%(a) Please refer to Explanatory notes - paragraphs 3 & 13 in particular.(b) Scheduled services recommenced December 2010 <strong>and</strong> ceased October 2011.(c) Scheduled services recommenced August 2010 <strong>and</strong> ceased March 2011.9


