Pricing Bank Loans and Deposits: Does Concentration Matter ...
Pricing Bank Loans and Deposits: Does Concentration Matter ...
Pricing Bank Loans and Deposits: Does Concentration Matter ...

Create successful ePaper yourself
Turn your PDF publications into a flip-book with our unique Google optimized e-Paper software.
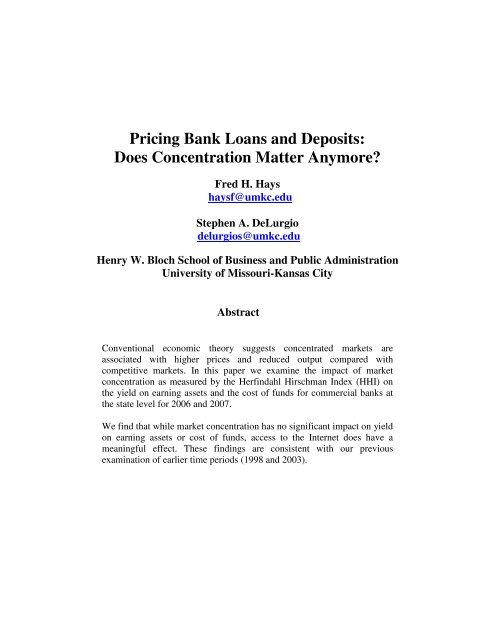
<strong>Pricing</strong> <strong>Bank</strong> <strong>Loans</strong> <strong>and</strong> <strong>Deposits</strong>:<strong>Does</strong> <strong>Concentration</strong> <strong>Matter</strong> Anymore?Fred H. Hayshaysf@umkc.eduStephen A. DeLurgiodelurgios@umkc.eduHenry W. Bloch School of Business <strong>and</strong> Public AdministrationUniversity of Missouri-Kansas CityAbstractConventional economic theory suggests concentrated markets areassociated with higher prices <strong>and</strong> reduced output compared withcompetitive markets. In this paper we examine the impact of marketconcentration as measured by the Herfindahl Hirschman Index (HHI) onthe yield on earning assets <strong>and</strong> the cost of funds for commercial banks atthe state level for 2006 <strong>and</strong> 2007.We find that while market concentration has no significant impact on yieldon earning assets or cost of funds, access to the Internet does have ameaningful effect. These findings are consistent with our previousexamination of earlier time periods (1998 <strong>and</strong> 2003).
<strong>Pricing</strong> <strong>Bank</strong> <strong>Loans</strong> <strong>and</strong> <strong>Deposits</strong>: <strong>Does</strong><strong>Concentration</strong> <strong>Matter</strong> Anymore?BackgroundOne of the important lessons learned in Principles of Economics is the relationshipbetween market concentration <strong>and</strong> the quantity <strong>and</strong> prices of goods <strong>and</strong> services. Studentsare dutifully taught that competitive markets generally result in lower prices <strong>and</strong> greaterquantities <strong>and</strong> choice for consumers compared with imperfectly competitive markets,especially monopoly <strong>and</strong> oligopoly.Historically regulators have embraced antitrust laws such as the Sherman Act (1890) <strong>and</strong>Clayton Act (1914) that address excessive market power conditions that maysubstantially lessen competition or tend to create or promote monopoly. The U.S.Department of Justice <strong>and</strong> the Federal Trade Commission have formulated HorizontalMerger Guidelines (http://www.usdoj.gov/atr/public/guidelines/hmg.htm) to evaluate theprobable impact on market concentration of mergers between firms in the same industryor business.The Federal Reserve System has adopted a similar approach in weighing the potentialanti-competitive consequences of bank mergers under the <strong>Bank</strong> Holding Company Act(1956). The Federal Reserve has historically used concentration ratio analysis along withHerfindahl Hirschman Indices (HHI) to evaluate the potential anti-competitive effects ofbank mergers. [The calculation of HHI <strong>and</strong> comparison benchmarks are discussed later inthis paper]Anecdotal evidence suggests that in the current environment dramatically different levelsof market concentration may be associated with similar prices for banking states. Forexample, based on June 30 th 2007 data, Missouri (HHI=426) was one of the mostcompetitive banking markets in the United States. [Major MSAs within Missouriincluding Kansas City <strong>and</strong> St. Louis are likewise highly competitive] By contrast SouthDakota (HHI=3409) was highly concentrated [The Sioux Falls MSA by comparison ishighly concentrated]. For the same time period, the yield on earning assets in Missouriwas 7.21% while South Dakota was 7.58%, a difference of only 47 basis points or lessthan ½%. Similarly, the cost of funds was 3.31% in Missouri <strong>and</strong> 3.24% in SouthDakota, a difference of only 7 basis points or 7/100%. These small differences are notpredicted by conventional economic theory. We suggest that a possible explanation liesin the increasing pervasiveness of Internet access to banking customers, especially inremote, thinly populated rural areas.Data from the Pew Foundation Internet <strong>and</strong> American Life Project (2003) suggestdramatic increases in both the percentage of households with computers as well as thepercentage with Internet access. In 1998 only 42.6% of consumer households hadcomputers; by 2003 this increased to 62.2%. For the same years the percentage of
households with Internet access were 26% <strong>and</strong> 54.6% respectively. The increasing trendtoward on-line banking is shown in Chart 1 below.In a recent survey (2008) the Pew Foundation found that 73% of adult Americans use theInternet. Fifty three percent use the Internet for on-line banking while 89% use a searchengine to find information.This unprecedented access to current free on-line information allows consumers to searchwebsites such as <strong>Bank</strong>rate.com for the best available rates for bank deposits includingmoney market accounts <strong>and</strong> certificates of deposit. Consumers interested in finding thebest rates on mortgage loans can search sites such as LendingTree.com, Ditech.com <strong>and</strong>Internetmortgage.com. For other types of loans consumers can access sites such aseloan.com <strong>and</strong> uswitch.com.Consumers can discover not only the best deposit <strong>and</strong> loan rates but can actually takeadvantage of those rates. On-line banking coupled with free mobility of capital acrossstate lines allows consumers in remote areas of the US to have the same access tofavorable rates as those residing in urban areas. There is pressure on banks <strong>and</strong> other nonbankfinancial institutions to be competitive on both loan <strong>and</strong> deposit rates. Economictheory suggests that this increased competition leads to the same or similar pricesespecially since most bank products are increasingly homogeneous commodities.Chart 1
Review of LiteratureIndustrial organization literature in economics contains considerable discussion of theStructure-Conduct-Performance Paradigm (SCP). Market structure relates to the level ofconcentration within a market. Structure in turn affects the conduct of firms within theindustry. As firms gain market power the impact may affect pricing, barriers to entry, <strong>and</strong>management behavior in general which in turn affects performance in terms of efficiency.Summaries of the early work in SCP may be found in the works of Caves (1964; 1980)The SCP Paradigm has been applied to commercial banking in numerous theoretical <strong>and</strong>empirical studies. Hannan (1991) develops a theoretical model of the relationshipbetween bank conduct <strong>and</strong> performance by extending the early theory of bankingadvanced by Klein (1971). Hannan finds that higher local market concentration is relatedto higher loan rates. Berger <strong>and</strong> Hannan (1989) develop an empirical model relatingbank deposit prices to the structure-performance hypothesis. They find that increasedlocal market concentration is related to lower deposit rates.Neuberger (1997) provides a comprehensive review of the literature of SCP applicationsto banking. Neely <strong>and</strong> Wheelock (1997) examine the performance differences of banksbetween states <strong>and</strong> conclude that it is explained largely by differences in state economicconditions. Moore (1998) examines the role of technology in reducing the importance ofgeographic distance in banking market competition. Radecki (1998) suggests that banksset deposit <strong>and</strong> loan rates across an entire state rather than a county or a metropolitanstatistical area (MSA). Sampler (1998) discusses the impact of advanced informationtechnology in redefining market structure <strong>and</strong> competition.Berger (2003) investigates the impact of IT <strong>and</strong> financial technologies on the bankingindustry including Internet banking <strong>and</strong> electronic payments technology as well asinformation exchanges such as credit bureaus which provide the inputs for credit scoringmodels used by banks in lending decisions. Frame <strong>and</strong> White (2004) criticize the lack ofempirical studies that test hypotheses related to financial innovation.Framing the ModelsIn this paper we develop alternative models to explain two different dependent variables:1) cost of funds (CoF) <strong>and</strong> 2) yield on earning assets (YoEA)
The Generalized ModelY= α + Β 1 HHI + Β 2 IH + Β 3 IA + Β 4 L/A +B 5 UE+ B 6 NPL (1)Where:Y= Yield on Earning Assets (YoEA) <strong>and</strong> Cost of Funds (CoF) respectivelyΑ= constantHHI= Herfindahl Hirschman Index by stateIH= % of households with Internet access at home (state level data)IA= % of households with Internet access anywhere (state level data)L/A= median loan to asset ratio by stateUE= unemployment rate by stateNPL= non-performing loans by stateIn our first model, (Model 1), Yield on Earning Assets, the dependent variable representsthe income received by banks for earning assets divided by average assets. Since loansare the primary earning asset for a bank, the yield on earning assets serves as a proxy forthe average interest rate that consumers pay on average for loans. Theory suggests thatconsumers in more concentrated markets as measured by the HHI, would pay higher loanrates than customers in more competitive markets (Hannan, 1991).The loan-to-asset ratio is a proxy for overall loan dem<strong>and</strong> <strong>and</strong> is affected by the cyclicalbehavior of consumer income. The mean loan to asset ratio increased slightly from about69% at year-end 2006 to about 70.5% at year-end 2007.Two measures are included for household Internet access: Home access as well as remoteInternet access from anywhere. We hypothesize that greater Internet access provides theconsumer with more options for acquiring loans from a larger number of competitors.This lowers search costs <strong>and</strong> produces more competition which we argue may lower loanrates.Our alternate model, Cost of Funds, measures the impact of market concentration,Internet access <strong>and</strong> economic factors on the rates that consumers pay on deposits incommercial banks.Theory again suggests that in more concentrated markets, customers are paid less forfunds, particularly deposits, than in more competitive markets (Berger <strong>and</strong> Hannan,1998). As consumers have greater access to comparative information on deposit rates,they can potentially improve their return on deposits. This is accentuated by Internetaccess which provides knowledge of rates plus a mechanism for acting on theinformation in the form of on-line banking options.Data Sources <strong>and</strong> IssuesThis paper is constrained by the availability of data on Internet access. We rely on datacollected by National Telecommunications <strong>and</strong> Information Administration as well as
from the Pew Foundation’s Internet <strong>and</strong> American Life Project. This data on householdcomputer ownership <strong>and</strong> Internet access is available at the state level. Data for bankingvariables are obtained from the FDIC website <strong>and</strong> supplemented by the SNL Corp.commercial banking relational database (also based upon Reports of Income <strong>and</strong>Condition provided to the FDIC by all insured banks).The Herfindahl Hirschman Index (HHI) data is obtained from the FDIC on-line websitehttp://www2.fdic.gov/sod/sodMarket<strong>Bank</strong>.asp?barItem=2. The data in this study iscalculated by state. HHI data is calculated from the FDIC Summary of <strong>Deposits</strong> which isonly available for the June 30th Report of Condition. Our data is for June 30, 2007.The HHI is calculated by summing the squared market shares for each major participantin the market. By convention market shares of less than 2% are ignored. The Departmentof Justice/Federal Trade Commission Horizontal Merger Guidelines provide a frameworkfor evaluating market concentration. The Federal Reserve uses similar guidelines inconsidering bank merger applications. <strong>Bank</strong> markets with HHI1,000 but100 points would raise some regulatory concerns. Markets where HHIexceeds 1,800 are highly concentrated <strong>and</strong> presume potential adverse consequences ofmarket power, especially when the change in the post-merger HHI >50.The Economic EnvironmentIn our recent research we investigated the impact of the Internet <strong>and</strong> market concentrationon bank pricing decisions for 1998 <strong>and</strong> 2003. (Hays <strong>and</strong> DeLurgio, 2007) These wereperiods of economic transition. The current study includes year-end data for 2006 <strong>and</strong>2007, periods that include rising, constant <strong>and</strong> decreasing short term interest rates as aresult of policy actions taken by the Federal Reserve’s Federal Open Market Committee(FOMC). Changes in the target rates for overnight Federal Funds are presented in Chart2. Fed funds represent short term loans by financial institutions to one another. Using2006 <strong>and</strong> 2007 also avoids much of the turbulence created by sub-prime lending <strong>and</strong>chaotic credit <strong>and</strong> equity markets.
Chart 2The behavior of short-term rates impacts both the cost of funding bank liabilities,especially deposits as well as affecting the returns on earning assets, in particular therates charged on loans. Economic theory suggests that these rates are also influenced bythe degree of concentration or competitiveness in banking markets. The differencebetween the yield on earning assets (primarily from making loans as depicted in Chart 4<strong>and</strong> the cost of funds (primarily deposit costs as shown in Chart 5) is net interest margin(NIM). This margin, combined with the volume of loans originated is the primary driverof bank revenues. The behavior of net interest margins from 2004-2008 is shown in Chart3.
Chart 3Source: FDIC Quarterly <strong>Bank</strong>ing Report, 2 nd Qtr. 2008 at www.fdic.govChart 3 shows NIM for banks above <strong>and</strong> below $1 billion. <strong>Bank</strong>s below $1 billion arefrequently referred to as “community banks” which represent the overwhelming majorityof the 7,000+ banks in the U.S. Many community banks are located in rural areaswithout significant numbers of other financial institutions as competitors. As aconsequence, they may charge somewhat higher loan rates <strong>and</strong> pay somewhat lowerdeposit rates than larger institutions in urban areas. We observe that the increasingpenetration of the Internet <strong>and</strong> the increased participation in on-line banking increasescompetition even in rural areas.Chart 4 shows the yield on earning assets from 2002-2008 for banks that are above <strong>and</strong>below $1 billion in assets. Yield on earning assets equals total interest income(annualized) as a percent of average earning assets.
Chart 4Source: FDIC Quarterly <strong>Bank</strong>ing Report, 2 nd Quarter 2008 (www.fdic.gov)Chart 5 shows the behavior of the cost of funding earning assets by bank size from 2002-2008. The cost of funds ratio represents the annualized total interest expense on deposits<strong>and</strong> other borrowed money as a percent of average earning assets on a consolidated basis.Chart 5Source: FDIC Quarterly <strong>Bank</strong>ing Report, 2 nd Quarter 2008 (www.fdic.gov)
Univariate AnalysisThis study utilizes data for both 2006 <strong>and</strong> 2007. Table 1 presents univariate paired t-testsfor several financial variables that were included in our initial investigation.Table 1Descriptive Statistics <strong>and</strong> Univariate Tests2006 vs. 2007Variables Includedin Models2006 2007 t-value SignificancelevelYield on Earning Assets 6.88 7.15 21.47 .000Cost of Funds 2.68 3.11 35.72 .000Home Internet Access --- 59.73 na ---% (2007 data only)Internet Access--- 70.53 na ---Anywhere % (2007 dataonly)HHI (6/30/07 data) --- 963.10 na ---Loan to Asset Ratio 68.98 70.46 4.52 .000Non Performing <strong>Loans</strong> 0.41 0.41 9.95 .000to <strong>Loans</strong>Unemployment Rate % 4.41 4.32 -1.90 .064*Other VariablesReturn on Avg. Assets 1.04 .88 -7.14 .000Net Interest Margin 4.21 4.08 -6.69 .000Non Interest Income to 0.65 0.63 -2.00 .050Avg. AssetsOverhead Expense to 3.05 3.10 2.47 .017Avg. AssetsLoan Charge-offs 0.06 0.09 5.68 .000Home Prices (%∆) -14.58 -23.65 -5.12 .000*not significant at 95% confidence levelOf the eleven paired variables for 2006 <strong>and</strong> 2007, only one pair, the unemployment ratevariable was not significant at the 95% confidence level. These variables weresubsequently used in our stepwise regression models.
Multivariate Regression ResultsThe univariate variables in Table 1 were initially included in a stepwise regressionanalysis using SPSS 16.0. Results for Model 1, Yield on Earning Assets are presented inTable 2 for 2006 <strong>and</strong> 2007. In general, market concentration as measured by HHI has nostatistically significant impact on explaining changes in yields on earning assets as aproxy for the price consumers pay for bank loans.Finding no relationship between concentration <strong>and</strong> return on earning assets is consistentwith the anecdotal evidence discussed earlier. The availability to consumers ofcomparison data on loan rates by different providers quickly <strong>and</strong> at a minimal search costmay offer an explanation for the convergence of the yield on earning assets. The absenceof a strong relationship between yield on earning assets <strong>and</strong> HHI, suggests that theconcern of regulators about adverse consequences of market concentration may beunwarranted.An important finding is that Internet access from anywhere (home, office, hotel, airport,public library or elsewhere) is significantly related to the yield on earning assets. Thisallows consumers to check on loan rates <strong>and</strong> even process loan applications fromanywhere.Table 2Model 1: Yield on Earning Assets 2006 <strong>and</strong> 2007 (year-end)Stepwise Regression ResultsExplanatoryVariablesYield onEarningAssets2006 Yield onEarningAssets2007Coefficient t-value p Coefficient t-value pConstant 2.681 3.036 .004 3.427 3.468 .001HHI NS --- --- NS --- ---Home Internet NS --- --- NS --- ---Access %Internet Access .028 2.804 .007 .027 2.0922 .042Anywhere%<strong>Loans</strong> to Assets .033 3.895 .003 .026 2.566 .014Unemployment NS --- --- NS --- ---Rate %Non-performing NS --- --- NS --- ---loans/loansAdj. R 2 .297 .207F statistic 11.347 7.408Significance F .000 .002Durbin Watson 1.877 1.897
The loan to asset ratio is also statistically significant in both time periods. It is animportant measure since is a driver of bank earnings representing the volume of dem<strong>and</strong>for earning assets.The findings on Cost of Funds in Table 3 likewise show that market concentration asmeasured by HHI is not significant. Home access to the Internet is statistically significantwhile Internet access from anywhere is not. A plausible explanation might be thatconsumers make infrequent loan searches but may search for deposit rates frequently,perhaps away from the office <strong>and</strong> business dem<strong>and</strong>s. The loan to asset ratio is likewisesignificant <strong>and</strong> important as cost driver.Table 3Model 2: Cost of Funds 2006 <strong>and</strong> 2007Stepwise Regression ResultsExplanatoryVariablesCost of 2006 Cost of 2007FundsFundsCoefficient t-value p Coefficient t-value pConstant 1.847 4.541 .000 2.099 4.738 .000HHI NS --- --- NS --- ---Home Internet -.015 -3.426 .001 -.017 -3.878 .000Access %Internet Access NS --- --- NS --- ---Anywhere %<strong>Loans</strong> to assets .025 4.828 .000 .029 4.938 .000Unemployment NS --- --- NS --- ---Rate %NonperformingNS --- --- NS --- ---loans/loansAdj. R 2 .368 .388F statistic 15.239 16.517Significance F .000 .000Durbin Watson 2.362 2.204
Summary <strong>and</strong> ConclusionUsing multiple regression analysis we investigate the impact of market concentration asmeasured by the Herfindahl Hirschman Index as well as the impact of Internet access onboth the yield on earning assets <strong>and</strong> the cost of funds for commercial banks for 2006 <strong>and</strong>2007.This study provides evidence that, contrary to theory, there is little or no impact on bankyield on earning assets or the cost of funds from changing market concentration, eventhough market concentration has risen over the past two decades on consolidation in thebanking industry. In 1980 there were 14,434 banks; at the end of the first quarter of 2007there were 7391 (FDIC, 2007) resulting in fewer but larger banks.Our explanation is that the diffusion of financial information through the Internet allowsbank customers, even in remote locations to compare asset rates especially on loans aswell as deposit rates between competing institutions. Moreover, on-line banking allowscustomers to act upon this information therefore creating more competitive loan <strong>and</strong>deposit rates.Using state level data from the Federal Deposit Insurance Corporation <strong>and</strong> NationalTelecommunications <strong>and</strong> Information Administration plus the Pew Foundation Internet<strong>and</strong> American Life study on the percentage of households with Internet access we findstatistically significant evidence that the Internet is compressing the differences in yieldson earning assets <strong>and</strong> cost of funds regardless whether the markets are unconcentrated orhighly concentrated. This raises issues about the conventional Structure-Conduct-Performance Paradigm that anchors the conventional microeconomic theory of firms.REFERENCES1. Berger, Allen N. & Hannan, Timothy H. (1989), The Price-<strong>Concentration</strong>Relationship in <strong>Bank</strong>ing, The Review of Economics <strong>and</strong> Statistics, 71 (2), 291-299.2. Berger, Allen N. (2003) The Economic Effects of Technological Progress:Evidence from the <strong>Bank</strong>ing Industry, Journal of Money, Credit <strong>and</strong> <strong>Bank</strong>ing, (35)(2), 141-176.3. Caves, Richard (1964) American Industry: Structure, Conduct <strong>and</strong> Performance,Englewood Cliffs, N.J., Prentice-Hall Inc.4. Caves, Richard (1980) Industrial Organization, Corporate Strategy <strong>and</strong> Structure,Journal of Economic Literature, 18 (1), 64-92.5. Frame, W. Scott & White, Lawrence J. (2004) Empirical Studies of FinancialInnovation: Lots of Talk, Little Action?, Journal of Economic Literature, (42) (1),116-144.6. Hannan, Timothy H. (1991) Foundations of the Structure-Conduct-PerformanceParadigm in <strong>Bank</strong>ing, Journal of Money, Credit <strong>and</strong> <strong>Bank</strong>ing, 23 (1), 68-84.
7. Hays, Fred H. <strong>and</strong> DeLurgio, Stephen A. (2007) Market <strong>Concentration</strong> <strong>and</strong> <strong>Bank</strong><strong>Pricing</strong>: A Paradigm Shift?, Proceedings of the Academy of Business Disciplines.8. Klein, Michael A. (1971) A Theory of the <strong>Bank</strong>ing Firm, Journal of Money,Credit <strong>and</strong> <strong>Bank</strong>ing, 3 (2), 205-218.9. Lenhart, Am<strong>and</strong>a et. al. (2003) The Ever-Shifting Internet Population, PewInternet & Life Project, (http://www.pewinternet.org).10. Moore, Robert R. (1998) <strong>Concentration</strong>, Technology, <strong>and</strong> Market Power in<strong>Bank</strong>ing: Is Distance Dead? Financial Industry Studies, Federal Reserve <strong>Bank</strong> ofDallas11. Neely, Michelle C. & Wheelock, David C. (1997) Why <strong>Does</strong> <strong>Bank</strong> PerformanceDiffer Across States? Review, Federal Reserve <strong>Bank</strong> of St. Louis.12. Neuberger, Doris (1997) Structure, Conduct <strong>and</strong> Performance in <strong>Bank</strong>ingMarkets, Working Paper No. 12, Universität Rostock (http://www.wiwi.unirostock.de/˜geld/RePEc/pdf/wp12thuenen.pdf)13. The Pew Foundation (May, 2008) “InternetTrends”,(http://www.pewinternet.org/trends/Internet_Activities_7.22.08.htm)14. Radecki, Lawrence J. (1998) The Exp<strong>and</strong>ing Geographic Reach of Retail <strong>Bank</strong>ingMarkets, Economic Policy Review, Federal Reserve <strong>Bank</strong> of New York.15. Sampler, Jeffrey L. (1998) Redefining Industry Structure in the Information Age,Strategic Management Journal, (19) (4), 343-355.