Property Crime Victimization - Media | Publications | Web
Property Crime Victimization - Media | Publications | Web
Property Crime Victimization - Media | Publications | Web
Create successful ePaper yourself
Turn your PDF publications into a flip-book with our unique Google optimized e-Paper software.
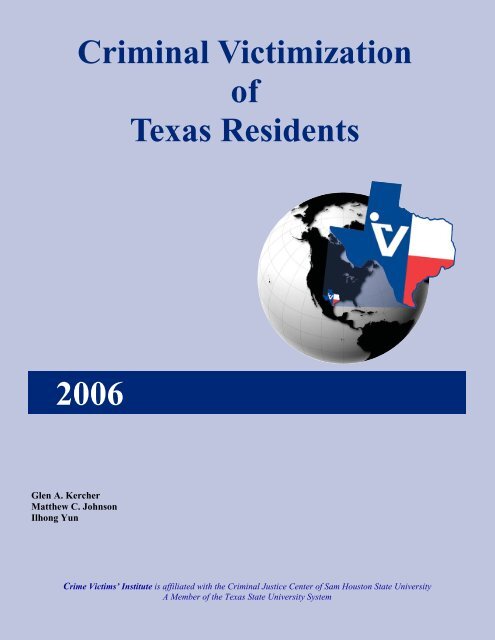
Criminal <strong>Victimization</strong>ofTexas Residents2006Glen A. KercherMatthew C. JohnsonIlhong Yun<strong>Crime</strong> Victims’ Institute is affiliated with the Criminal Justice Center of Sam Houston State UniversityA Member of the Texas State University System
Mission StatementThe Mission of the <strong>Crime</strong> Victims’ Institute is to• Conduct research to examine the impact of crime on victims of allages in order to promote a better understanding of victimization• Improve services to victims• Assist victims of crime by giving them a voice• Inform victim-related policymaking at the state and locallevels.<strong>Crime</strong> Victims’ InstituteCriminal Justice CenterSam Houston State UniversityBox 2180Huntsville, TX 77341-2180Phone: 936.294.3100Fax: 936.294.4296www.crimevictimsinstitute.org
Table of ContentsExecutive Summary 5Introduction 6Methodology 7Characteristics of Respondents 9Violent <strong>Victimization</strong> 12Age 12Gender 12Race/Ethnicity 13Marital Status 13Government Assistance 14Income 14Type of Residence 15Firearm Ownership 15Reporting to Police 15Injuries 16Emotional Responses 16Neighborhood Safety 17<strong>Property</strong> <strong>Crime</strong> <strong>Victimization</strong> 18Age 18Gender 18Race/Ethnicity 19Marital Status 19Government Assistance 20Income 20Type of Residence 20Firearm Ownership 21Neighborhood Safety 21Reporting to Police 21Conclusion 22Endnotes 23
List of TablesTable 1 Survey Methodology 7Table 2 Neighborhood Safety Perceptions, <strong>Crime</strong> Perceptions, and Firearm Ownership 11Table 3 Other Characteristics Associated with Violent <strong>Crime</strong> <strong>Victimization</strong> 17Table 4 Perceptions of Neighborhood Safety Among <strong>Property</strong> <strong>Crime</strong> Victims 22List of FiguresFigure 1 U.S. Violent <strong>Crime</strong> <strong>Victimization</strong> per 1,000 Residents 5Figure 2 U.S. <strong>Property</strong> <strong>Crime</strong> Rates per 1,000 Residents 6Figure 3 Distribution of Survey 8Figure 4 Age of Respondents 9Figure 5 Gender of Respondents 9Figure 6 Race/Ethnicity of Respondents 9Figure 7 Marital Status of Respondents 9Figure 8 Respondents Receiving Government Assistance 9Figure 9 Income of Respondents 9Figure 10 Type of Residence of Respondents 10Figure 11 Firearm Ownership among Respondents 10Figure 12 Educational Level of Respondents 10Figure 13 Employment of Respondents 10Figure 14 Comparison of <strong>Crime</strong> Victims 11Figure 15 Types of Violent <strong>Crime</strong> <strong>Victimization</strong>s 12Figure 16 Percentage of Victims in each Age Group 12Figure 17 Percentage of Victims in each Gender Group 13Figure 18 Percentage of Victims in each Race/Ethnicity Group 13Figure 19 Percentage of Victims in each Marital Group 13Figure 20 Percentage of Victims in each Government Assistance Group 14Figure 21 Percentage of Victims in each Income Group 14Figure 22 Percentage of Victims in each Type of Residence Group 15Figure 23 Percentage of Victims in each Firearm Ownership Group 15Figure 24 Satisfaction of Violent <strong>Crime</strong> Victims with Police 15Figure 25 Injuries Suffered by Violent <strong>Crime</strong> Victims 16Figure 26 Emotional Responses after Violent <strong>Victimization</strong> 16Figure 27 Type of <strong>Property</strong> <strong>Crime</strong> <strong>Victimization</strong>s 18Figure 28 Percentage of Victims in each Age Group 18Figure 29 Percentage of Victims in each Gender Group 19Figure 30 Percentage of Victims in each Race/Ethnicity Group 19Figure 31 Percentage of Victims in each Marital Group 19Figure 32 Percentage of Victims in each Government Assistance Group 20Figure 33 Percentage of Victims in each Income Group 20Figure 34 Percentage of Victims in each Type of Residence Group 20Figure 35 Percentage of Victims in each Firearm Ownership Group 21Figure 36 Satisfaction of <strong>Property</strong> <strong>Crime</strong> Victims with Police 22
Executive Summary<strong>Crime</strong> Victims’ InstituteThis report summarizes the results from the third annual Texas <strong>Crime</strong> <strong>Victimization</strong> survey conductedby the <strong>Crime</strong> Victims’ Institute at Sam Houston State University. Over 700 randomly selected Texas residentsshared their experiences during a phone interview. This report is intended to inform policymakers, service providers,and the general public about the experiences and needs of victims of crime.Safety Concerns of Respondents (N=701)• 67% of respondents believe that the incidence of crime in their neighborhood has stayed the same over thepast 2 years.• 27% of respondents believe that crime in Texas has stayed the same or decreased in the last 2 years.• 87% of respondents feel safe walking alone in their neighborhood during the day.• 67% of respondents feel safe walking alone in their neighborhood at night.• 63% of respondents report having a neighborhood watch program in their community.• 46% of respondents own a firearm.• 39% of respondents report being a victim of either a violent or property crime in the last 2 years.<strong>Property</strong> crime is the most common kind of victimization.Violent <strong>Crime</strong> <strong>Victimization</strong> (n=49)• 81 violent crime victimizations were reported.• 41% of victims were physically attacked in some way.• 33% of victims were threatened or attacked with a weapon.• Respondents between the ages of 18 and 34 are more likely to be a victim of a violent crime than are thosewho are older.• Males are more likely to be a victim of a violent crime than are females.• Minority residents are more likely to be victims of a violent crime than are Caucasian, Non-Hispanic.• Single, never married residents are more likely to be a victim of a violent crime than are married or previouslymarried persons.• Persons with an annual income below $30,000 are more likely to be victims of a violent crime than arethose who earn more.• Persons who rent a house or apartment are slightly more likely to be a victim of a violent crime than arethose who own their homes.• 43% of violent crime victims reported the offense to the police.• 63% of victims were injured during the violent incident, the most common injury being a bruise.• 73% of victims were affected emotionally by the violent incident, the most common reaction being anger.<strong>Property</strong> <strong>Crime</strong> <strong>Victimization</strong> (n=223)• 372 instances of property crime victimization were reported.• The 3 most common kinds of property victimizations were damage to property, items stolen outside thehome, and items stolen that the victim was wearing.• 6% of respondents reported that their identity was stolen through theft of credit cards or misuse of creditcard numbers.• Respondents between the ages of 18 and 34 are more likely to be a victim of a property crime than thosewho are older.• Men and women are equally likely to be victims of a property crime.• Single, never married residents are more likely to be victims of a property crime than are married or previouslymarried residents.• Minority residents are more likely to be property crime victims than Caucasians.• Persons who make more than $30,0000 per year are just as likely to be a victim of a property crime as thosewho make less than that.• Residents who rent their residences are at slightly greater risk to be victimized than are homeowners.• 52% of property crime victims reported the crime to the police.5
<strong>Crime</strong> Victims’ InstituteIntroductionOne of the most terrifying experiences a person can have is to be the victim of a crime. <strong>Crime</strong>s such asphysical and sexual assault bring untold physical and emotional suffering both to the victims and their families.Even victims of property crimes suffer, as they cope with the loss of their resources and possessions and withtheir lessened sense of security.Overall, however, there is good news about criminal victimization in the United States: “Between 1993and 2004 the violent crime rate decreased 57% from 50 to 21 victimizations per 1,000 persons age 12 or older.<strong>Property</strong> crime declined 50% from 319 to 161 per 1,000 households.” 1 In addition to an overall drop in victimizationrates, an increase in reporting crime to police has also been found. Although a comparison of National<strong>Crime</strong> <strong>Victimization</strong> Survey results between 2003 and 2004 shows a leveling off of the downward trend of victimizationrates, a 9% drop in violent crime was found between 2001 and 2004, a relatively short time span forsuch a significant decline. However, rates are still higher in the U.S. than in most industrialized nations, andthe decline may be leveling off.Even though the rate of violent crime in the United States has declined since 1993, it is clear that manyU.S. citizens are victimized each year. The following information provides an overview of the rate of criminalvictimization per 1,000 persons who are at least 12 years of age. 220181816Rate (per 1,000)141210864200.060.9Homicide Sexual Assault* Robbery Simple &Aggravated Assault*Attempted or Completed; Males & FemalesFigure 1. U.S. Violent <strong>Crime</strong> <strong>Victimization</strong> per 1,000 Residents<strong>Victimization</strong> rates are highest for persons between the ages of 12 and 24 and decline after that. Malesare more likely to be a victim (22/1,000) than are females (19/1,000). <strong>Victimization</strong> rates are higher for AfricanAmericans (12/1,000) than they are for Caucasians (7/1,000).<strong>Property</strong> crime rates have also declined since 1993 from a high of 335/1,000 in that year to 170/1,000 in2004. These rates do not reflect identity theft victimizations. It is important not only to understand the many2140123Rate (per 1,000)120100806040203090Burglary Theft Motor VehicleFigure 2. U.S. <strong>Property</strong> <strong>Crime</strong> Rates per 1,000 Residents6
<strong>Crime</strong> Victims’ Instituteways people are victimized, but also the impact those experiences have on them both immediately and in theweeks and months that follow. For many, victimization is an extremely degrading experience. It can be a violationon a number of levels:• Violation of the body,• Violation of the mind and soul,• Violation of personal property.The emotional consequences of victimization can prompt adverse reactions such as anger, fear, depression,disillusionment, and detachment from family and friends. 3 As will be shown in this report, many crime victimsstruggle to cope with that experience and return to a semblance of normalcy. However, not only is thevictim affected, but also the family and friends of a victim, who try to provide support and reassurance. Moreover,the general public can also be affected as their sense of decency and security in their community isthreatened.Some of the images that come to mind when thinking about criminal victimization are of the most heinous,violent types of acts. These images may be due in part to the way the media tends to highlight the mostserious offenses. Sometimes one’s perception of what it is like to be a victim is based on things that have happenedto him or her. In spite of the all-too-common media portrayals of victimization, most criminal victimizationsdo not involve violence. The rates of violent victimization are much lower than those of property victimization.4 Some citizens may also believe that the majority of victimizations are perpetrated by strangers.However, especially for violent offenses, it is more likely that the victim knows the offender. 5MethodologyThis third annual report by the <strong>Crime</strong> Victims’ Institute presents information about criminal victimizationamong Texas residents. Using an internet computer-assisted telephone interviewing system (ICATI), thePublic Policy Research Institute (PPRI) at Texas A&M University collected the data for the survey. TheICATI system utilizes a computer system that randomly generates phone numbers, allowing for a better representationof the Texas population. Interviews were conducted between 8:00 a.m. and 9:30 p.m. during theweek, Saturday from 10:00 a.m. to 6:00 p.m., and 1:00 p.m. to 9:30 p.m. on Sunday. The procedure for attemptingto contact a household was to place a call during each of five different interview shifts throughout theweek. Four of these calls occurred during the evening or weekend hours when respondents were most likely tobe at home. Numbers that were apparently disconnected were tried twice. Busy numbers were tried twice duringthe same shift, with repeated attempts during five different shifts. When a household had been reached,but the correct respondent was not available, as many as five more tries were made to reach the correct respondent.An attempt was made to convert virtually all refusals. Interviewers completed a special form when arefusal occurred that provided as much information as possible on the circumstances of the refusal. The respondentwas then re-contacted by interviewers specially trained to convert refusals.Over 10,000 phone numbers were called (see Table 1), but far fewer calls were answered. Many callswere not answered or were discontinued because the respondent was never available, the call was picked up byan answering machine, the phone was always busy, the number was a fax line, the number dialed was a nonworkingor disconnected number, or the number was for a business or organization.Table 1. Survey MethodologyTotal Phone Numbers Used 10,836Calls Answered 3,733Complete Interviews 701Partial Interviews 57Refusal and Break Off 2,974This response rate is not unusual for phone surveys of this length.7
<strong>Crime</strong> Victims’ InstituteFigure 3 shows the distribution of respondents across the state.Figure 3. Distribution of SurveyThe telephone protocol used for this survey was different in many respects from the one used in the twoprevious surveys. The variable of race/ethnicity was expanded to separate Asian and Native Americans fromthe Other category. Similarly the marital status and educational level variables were expanded. EmploymentStatus was changed from a yes-no question on the 2005 survey to four categories this year. Household incomewas also expanded from a single range in 2005 to four categories in this survey.Violent victimization was conceptualized differently to provide new insights into the experiences ofTexas crime victims. Victims were asked to indicate the types of injuries and the emotional reactions they experiencedas a result of the crime.A new category was added to the property crime section, which addressed identity theft and propertythat was damaged.8
Characteristics of Respondents<strong>Crime</strong> Victims’ InstituteThe average age of respondents was 45.5, which is slightly younger than that of respondents in lastyear’s survey (47). The youngest respondent was 18, and the oldest was 89 years of age at the time of the interview.The following figures present respondent characteristics for age, gender, race/ethnicity, maritalstatus, government assistance, income, residence, firearm ownership, educational level and employment(Figures 4 through 13).65 andover10.3%18-248.3%25-3418%Male38.7%50-6428.7%Fe male61.3%35-4934.6%Figure 4. Age of RespondentsFigure 5. Gender of RespondentsAmericanIndian1.4%AfricanAmerican10.1%Asian, 1.4Other0.3%SingleNeverMarried24.2%Wido wed5.6%Hispanic23.4%White63.2%SeparatedDivorced9%Married60.1%Figure 6. Race/Ethnicity of RespondentsFigure 7. Marital Status of RespondentsYes30%>$75,00027.2%
<strong>Crime</strong> Victims’ InstituteRent25.1%Yes45.5%No54.5%Own74.9%Figure 10. Type of Residence of RespondentsFigure 11. Firearm Ownership amongRespondentsThe high number of respondents without employment may be indicative of the age of the sample, which includesa high number of respondents who are at retirement age, as well as a number of students (Figure 8).The relatively high percentage of respondents who receive government assistance may reflect respondentswho were receiving social security benefits, those who are disabled, and those who were otherwise financiallyhandicapped.2523.5%Percentage of Respondents201510516.2%12.8%13.9%20.1%13.6%0Did not finishhigh schoolHigh schooldiploma/GEDSomeCollegeFigure 12. Educational Level of RespondentsAssociates orvocationaldegreeBachelor'sdegreeGraduatedegreeUnemployedRetired32.5%Full-time51.4%Student6.1%Part-time10%Figure 13. Employment of Respondents10
<strong>Crime</strong> Victims’ InstituteViolent <strong>Victimization</strong>Figure 15 shows the kinds of violent victimization experiences reported by respondents.454040.8%Attacked or threatened with weaponPercentage of Victims353025201510532.7%8.2%18.4%12.2%24.5%28.6%Attacked or threatened with otherobjectAttacked by something thrownAttacked by punching, biting,kicking, etc.Forced to have sex against willPrevented from leaving after violentincidentPursued with vehicle whenattempting to leave0Figure 15. Types of Violent <strong>Crime</strong> <strong>Victimization</strong>s n=49Note: Percentages total more than 100 due to some victims reportingmore than one type of violent crime.Overall, there were 81 instances of violent victimization reported. This is an increase in the number of victimizationsreported by respondents compared to the 2005 <strong>Victimization</strong> Survey, and reflects, at least in part, refinementof the phone protocol from the one used last year. Forty-nine persons were the victims of the 81 reportedincidents (as compared to 25 victims interviewed for the 2005 survey). 6 The highest percentage (40.8%)of victimization was for persons who reported being punched, kicked, slapped, or bitten.Many of the victimization items measured in the current study are different from those used in the previousannual surveys. This limits the ability to examine trends over time.The following figures show the characteristics of the violent victimizations of respondents.AgeFigure 16 shows that respondents who were between the ages of 18 and 34 reported being a victim of aviolent crime significantly more often than those over age 34 reported such . These findings are similar tothose reported in the national victimization surveys. 7Percentage4035302520151058.3%24.6%18%11.5%34.6%28.7%Age Breakdown among allRespondentsViolent <strong>Crime</strong> Victims10.3%3.4% 5.1% 4.2%0GenderFigure 17 shows that a higher percentage of males reported being victimized by violent crime than didwomen. Males appear to be twice as likely to be a victim than are women. This finding is consistent withwhat has been found in national victimization surveys.1218-24 25-34 35-49 50-64 65 and overFigure 16. Percentage of Victims in each Age Group
<strong>Crime</strong> Victims’ Institute70605061.3%Gender Breakdown amongall RespondentsViolent <strong>Crime</strong> VictimsPercentage403038.7%201010.1%5.2%0MaleFemaleFigure 17. Percentage of Victims in each Gender GroupRace/EthnicityWhite victims made up the largest group of violent crime victims, but given their representation in thetotal sample of respondents (63.2%) they were underrepresented, while Asians who made up only 1.4% of thetotal sample were slightly overrepresented among victims. When violent victimization is considered in termsof the racial distribution among all respondents (N=701), minority victims are at greater risk for victimizationthan are Whites. Contrary to what has been found in national victimization surveys, African American respondentsdid not report violent crime victimization more frequently than did other groups (Figure 18).Percentage706050403063.2%23.4%Race/Ethnicity Breakdownamong all RespondentsViolent <strong>Crime</strong> Victims30%201006%7.5%10.1%7.1%1.4%10%1.4%0.3% 0%White Hispanic AfricanAmericanAmericanIndianFigure 18. Percentage of Victims in each Race/Ethnicity GroupAsianOtherMarital StatusEven though single/never married respondents made up only 24% of our sample, 53% of violent crimevictims in this study were single (or 15.7% of all single respondents). This seems consistent with the abovefinding that persons under 35 years of age were the most likely victims of violent crime. On the other hand,married respondents, who comprised 60% of the survey sample, comprised only 35% of the violent crime victims(or only 4.1% of all married respondents).70605060.1%Marital Status Breakdownamong all RespondentsViolent <strong>Crime</strong> VictimsPercentage403020104.1%24.2%15.7%9%4.8%5.6%7%0Married Single-nevermarriedSeparate/DivorcedFigure 19. Percentage of Victims in each Marital GroupWidowed13
<strong>Crime</strong> Victims’ InstituteDespite small sample sizes for some of the measures, these results are generally compatible with estimatesfrom extant research. Victims of violence were more likely to be• Young*• Male*• Racial Minority*• Single** Statistically differentiated between persons who werevictims of a violent crime and those who were not.Those who did not report being a victim of a violent offense were more likely to be female, married, between35 and 49 years of age, and Caucasian (Figure 19).Government AssistanceFigure 20 shows the percentage of violent crime victims who receive government assistance. Thesepercentages suggest that victimization rates for the two groups are similar . Many in the recipient group may besenior citizens who receive social security benefits. Their lifestyles are usually such that they are less likely tobe in places where the risk of violent victimization is high. Also, disabled persons may also be receiving governmentassistance, and their lifestyles may place them at lower risk for victimization.Percentage80706050403030%70%Government AssistanceBreakdown among allRespondentsViolent <strong>Crime</strong> Victims20106.8%7.2%0YesFigure 20. Percentage of Victims in each Government Assistance GroupIncomeFigure 21 shows that respondents (N=701) reporting an annual income below $30,000 were more likelyto be violently victimized (46.9%) than were those reporting an income above $30,000 (38.8%).Those making below $30,000 per year include marginally employed persons and students. Both ofthose two groups apparently are at greater risk for victimization.NoPercentage807060504030201031.6%12.4%68.4%4.7%Income Breakdown for allRespondentsViolent <strong>Crime</strong> Victims0Under $30,000 Above $30,000Figure 21. Percentage of Victims in each Income Group14
<strong>Crime</strong> Victims’ InstituteType of ResidenceMore respondents owned their homes than rented them. The percentage of respondents whowere victims of a violent crime did not substantially differ among those who own and rent their residences.Those who rent have only a slightly greater risk of violent crime victimization than those who own theirhomes. Even though there is relatively little difference in victimization rates between home owners and renters,owning a home may create a greater sense of personal safety (Figure 22).Percentage807060504030201074.9%6.4%25.1%Type of Residence Breakdownamong all RespondentsViolent <strong>Crime</strong> Victims9.4%0OwnRentFigure 22. Percentage of Victims in each Type of Residence GroupFirearm OwnershipFigure 23 shows that there is not much difference among victims of violent crime in terms of firearmownership. Those who owned firearms were as likely to be crime victims as those who did not.605045.5%54.5%Firearm Ownership among allRespondentsViolent <strong>Crime</strong> VictimsPercentage403020106.8% 7.5%0YesNoFigure 23. Percentage of Victims in each Firearm Ownership GroupDissatisfied9.5%NeitherSatisfiednorDissatisfied4.8%VeryDissatisfied14.3%VerySatisfied38.1%Reporting to the PoliceRespondents who reported at least one violentvictimization were asked if they reported the most seriousoffense to the police. Of the victims, 42.9% reportedthe offense to the police. Of those reporting thevictimization to the police, 19% (4) stated that the offenderwas arrested. Figure 24 shows the degree of satisfactionamong those who reported the offense to theway the police handled their report.SomewhatSatisfied33.3%Figure 24. Satisfaction of Violent <strong>Crime</strong> Victims with Police15
Lost job<strong>Crime</strong> Victims’ InstituteInjuriesFigure 25 shows the percentage of victims who received injuries during their victimization. The mostcommon injury was a bruise, followed by a blackened eye. Some victims received multiple injuries and 37%reported that they were not injured.454038.8%37%8.2%Percentage of Victims35302520151052%6.1% 6.1%2%10.2%4.1% 4.1%0CutBruisedBurnedStabbedNo injuriesBroken bonesHair pulled outLost teethBlackened eyesShot by gunFigure 25. Injuries Suffered by Violent <strong>Crime</strong> Victims n=49Note: Percentages total more than 100 due to some victims reporting more than one type of injury.Emotional ResponsesPersons who had been victims of a violent crime were asked about how their lives were affected by thecrime. Figure 26 summarizes their responses. Approximately 73% of participants who reported being a victimof a violent offense reported some type of emotional response to the victimization. Anger was the most frequentresponse (55.1%), followed by fear of being alone (34.7%), loss of sleep (26.5%), and depression(24.5%). These results suggest that some victims were at least slightly traumatized by the incidents and mighthave benefited from short-term counseling or debriefing.6055.1%50Percentage of Victims4030201026.5%18.4%18.4%24.5%20.4%22.4%34.7%4.1%20.4%4.1%0AngerNightmaresDepressionLack of concentrationFeelings of helplessnessFear of being aloneLoss of appetiteLoss of SleepWanted to be aloneThoughts about suicideFigure 26. Emotional Responses after Violent <strong>Victimization</strong>Note: Percentages total more than 100 due to some victims reporting more than one type of reaction.16
<strong>Crime</strong> Victims’ InstituteNeighborhood SafetyRespondents who reported not feeling safe walking alone in their neighborhood (day or night) weremore likely to report violent victimization (Table 3). aThis may be due to prior personal victimization making them more wary or hearing of the victimizationof acquaintances. Predictably, among all respondents to the survey, those who thought they lived in a highcrimearea were more likely to report being a victim of a violent crime (21.2%) as compared to those who didnot think they lived in a high-crime area (5%). b Respondents who knew only a couple of their neighbors werethe most likely (16.8%) to report violent victimization, while those who knew more of their neighbors were theleast likely (4.7%). Also, those who reported that their community had a Neighborhood Watch program wereslightly less likely (5.6% compared to 8.2%) to report a violent victimization. Over 11% of respondentsthought crime had decreased in their neighborhood over the past 24 months, which is not far from the 12.3% ofrespondents who thought crime increased and reported a violent victimization. cTable 3. Other Characteristics Associated with Violent <strong>Crime</strong><strong>Victimization</strong>Frequency Percent of Victimsn=49How safe walking alone in neighborhood—dayPercent of RespondentsN=701Very/somewhat unsafe 10 20.4 14.7Neither unsafe nor safe 2 4.1 9.1Very/Somewhat safe 36 73.5 6How safe walking alone in neighborhood—nightVery/somewhat unsafe 17 34.7 9.1Neither unsafe nor safe 6 12.2 13.3Very/Somewhat safe 24 49 5.4Has a Neighborhood WatchYes 13 26.5 5.6No 32 65.3 8.2How well know neighborsKnow many well 14 28.6 6.8Know some well 10 20.4 4.7Know only a couple well 20 40.8 16.8Know none 5 10.2 8.3Think neighborhood high crime areaYes 18 36.7 21.2No 30 61.2 5<strong>Crime</strong> in neighborhood past 24 monthsDecreased 6 12.2 11.1Stayed the same 21 46.9 4.8Increased 20 40.8 12.3<strong>Crime</strong> in Texas past 24 monthsDecreased 3 6.1 6.7Stayed the same 4 8.2 19Increased 39 79.6 8.4a Statistically differentiated between persons who were victims of a violent crime and those who were not.b Statistically differentiated between persons who were victims of a violent crime and those who were not.c Statistically differentiated between persons who were victims of a violent crime and those who were not.17
<strong>Crime</strong> Victims’ Institute<strong>Property</strong> <strong>Crime</strong> <strong>Victimization</strong>Figure 27 displays the results for individual property victimization. Overall, there were 372 total instancesof property victimization. This increase in the number of reported property crime victimizations comparedto that reported in the 2005 Survey may be due to refinement of the phone protocol. There were a totalof 223 different victims who reported these incidents (as compared to 131 victimizations found In the 2005survey), which indicates that many victims experienced more than one type of loss. 8 The most frequently reportedproperty victimization was having property damaged (36.8%), followed by things stolen outside thehome, (34.5%), items the respondent carried or wore (34.5%), and items stolen from inside a vehicle (23.8%).It should be noted that 11.7% of property crime victims reported having their identity stolen (i.e., theft ofcredit cards or credit card numbers).Some of the differences found among violent crime victims were not evident among property crimevictims.Percentage of Victims40353025201510519.3%15.2%34.5%15.2%7.2%23.8%10.8%11.7%15.7%36.8%0ItemscarriedItemswornItemsoutsidehomeItemsinsidehomeVehicleFigure 27. Type of <strong>Property</strong> <strong>Crime</strong> <strong>Victimization</strong>ItemsinsidevehicleItemsattachedto vehicleCreditcards orcredit cardnumbersMoneyDamaged<strong>Property</strong>Note: Percentages may total more than 100 due to some victims reporting more than one item stolen or damaged.AgeIt is interesting to note that 81% of respondents between 18 and 34 years of age reported at least oneproperty victimization. Persons older than 34 were at lesser risk (Figure 28).Percentage50454035302520151043.9%18%37.1%34.6%35.4%28.7%31.5%Age Breakdown among allRespondents<strong>Property</strong> <strong>Crime</strong> Victims10.3%8.3% 8.5%5018-24 25-34 35-49 50-64 65 and overFigure 28. Percentage of Victims in each Age GroupGenderWhen the gender breakdown among all respondents is considered (N=701), it appears that men andwomen were about equally likely to be victimized (Figure 29).18
<strong>Crime</strong> Victims’ InstitutePercentage70605040302038.7%34.1%61.3%30.8%Gender Breakdownamong all Respondents<strong>Property</strong> <strong>Crime</strong> Victims100MaleFemaleFigure 29. Percentage of Victims in each Gender GroupRace/EthnicityFigure 30 shows that minority respondents were more frequently victims of property crime than wereCaucasians.Many of the above findings may reflect lifestyle differences among property crime victims. For example,single, young adults may be out in public to a greater extent than is true of the other groups and subsequentlymaking their property vulnerable because of their absence from their homes or the accessibility of theirproperty in public places (e.g., vehicles).70605063.2%Race/Ethnicity Breakdownamong all Respondents<strong>Property</strong> <strong>Crime</strong> VictimsPercentage403038.9%29.7%23.4%32.9%33.3%30%2010.1%101.4%1.4%0.3%0%0White Hispanic AfricanAmericanNativeAmericanAsianFigure 30. Percentage of Victims in each Race/Ethnicity GroupOtherMarital StatusWhen the marital status of the sample as a whole is taken into account, single/never married victimswere the most frequently victimized, followed by married respondents (Figure 31).70605060.1%Marital Status Breakdownamong all Respondents<strong>Property</strong> <strong>Crime</strong> VictimsPercentage4030201032%24.2%37.5%9%27.4%5.6%17.9%0MarriedSingle-nevermarriedS eparated/DivorcedWidowedFigure 31. Percentage of Victims in each Marital Group19
<strong>Crime</strong> Victims’ InstituteGovernment AssistanceRespondents who reported receiving government assistance were less likely to report property victimizationthan those not receiving support.The lower victimization percentage for those respondents receiving government assistance may be duein part to the number of persons who are disabled or retired in this group. As noted earlier, persons in thesecategories have lifestyles that make them less susceptible to victimization.Percentage8070605040302030%23%70%35.7%Government AssistanceBreakdown among allRespondents<strong>Property</strong> <strong>Crime</strong> Victims100YesNoFigure 32. Percentage of Victims in each Government Assistance GroupIncomeIn contrast to what was found for violent crime victimization, respondents with an annual income below$30,000 were victimized as much as those who made more than $30,000 (figure 33).Percentage8070605040302068.4%31.6% 33.7%33.9%Income Breakdown for allRespondents<strong>Property</strong> <strong>Crime</strong> Victims100Under $30,000 Above $30,000Figure 33. Percentage of Victims in each Income GroupType of ResidenceHomeowners were less likely to report property victimization than were renters (Figure 34). Associationswere explored between property victimization and property ownership, firearm ownership, neighborhoodsafety, perceptions of neighborhood safety, and perceptions of crime trends in respondents’ neighborhoods aswell as in Texas.Percentage80706050403074.9%29.5%25.1%Type of ResidenceBreakdown among allRespondents<strong>Property</strong> <strong>Crime</strong> Victims38.7%2010020OwnRentFigure 34. Percentage of Victims in each Type of Residence Group
<strong>Crime</strong> Victims’ InstituteFirearm Ownership<strong>Property</strong> crime victims were evenly divided between those who owned a firearm and those who didnot.Again, it is also important to conduct tests of statistical significance when examining factors associatedwith victimization. The following characteristics were found to be significantly associated with property victimization:• Respondent age (18-24)• Renting a home• Perception of living in a high-crime area• Respondents’ belief that crime in their area has increased605045.5%54.5%Firearm Ownership amongall Respondents<strong>Property</strong> <strong>Crime</strong> VictimsPercentage40302032.3%32.3%100YesFigure 35. Percentage of Victims in each Firearm Ownership GroupNoNeighborhood SafetyTable 4 (page 22) shows that respondents who did not feel safe walking alone in their neighborhoodduring the day were slightly less likely to report being a property crime victim. The results are reversed (withlittle difference between the two categories) when looking at feeling safe at night.Having a Neighborhood Watch program did not differentiate among those who reported being a victimof a property crime and respondents who were not victimized. Respondents who claimed to know many oftheir neighbors were least likely to report a property victimization (26.9%), followed by those who know someof their neighbors (32.2%), a couple of their neighbors (35.7%), and those who did not know any of theirneighbors (36.7%).Finally, related to perceptions of crime in the neighborhood, 52.3% of respondents who thought theylived in a high-crime area reported property victimization, compared to 29.2% of those who thought they didnot live in a high-crime area. Also, respondents who thought that crime in their neighborhood had increasedover the past 24 months were more likely to report being a victim of a property offense (44.8% compared with37% who thought crime decreased).Reporting to the PoliceOf the respondents reporting a property victimization,about half (52.2%) reported the offense tothe police. Respondents were generally satisfied withthe way they were treated by the police at the scene ofthe incident. Respondents were very satisfied with thepolice 42.7% of the time, satisfied 21.4% of the time,dissatisfied 8.5% of the time, and very dissatisfied10.3% of the time.Dissatisfied9%NeitherSatisfiednorDissatisfied11.8%SomewhatSatisfied22.7%VeryDissatisfied10.9%VerySatisfied45.4%Figure 36. Satisfaction of <strong>Property</strong> <strong>Crime</strong> Victims with Police21
<strong>Crime</strong> Victims’ InstituteTable 4. Perceptions of Neighborhood Safety Among <strong>Property</strong> <strong>Crime</strong> VictimsFrequencyPercent of VictimsN=223Percent of RespondentsN=701How safe walking alone in neighborhood—dayVery/Somewhat unsafe 25 11.2 30.1Neither unsafe nor safe 7 3.1 31.8Very/Somewhat safe 190 8.5 31.6How safe walking alone in neighborhood—nightVery/Somewhat unsafe 71 3.2 38Neither unsafe nor safe 13 5.8 37.1Very/Somewhat safe 137 61.4 30.6Has Neighborhood WatchYes 68 30.5 29.2No 123 55.1 31.5How well know neighborsKnow many well 53 23.8 26.9Know some well 29 13 32.2Know only a couple well 79 35.4 35.7Know none 22 9.9 36.7Think neighborhood high-crime areaYes 45 20.2 52.3No 174 78 29.2<strong>Crime</strong> in neighborhood past 24 monthsDecreased 20 9 37Stayed the same 119 53.4 26.9Increased 73 32.8 44.8<strong>Crime</strong> in Texas past 24 monthsDecreased 13 5.8 28.3Stayed the same 39 17.5 30.7Increased 157 70.4 33.7ConclusionThe changes made to the telephone protocol used for this survey led to a slightly younger group of respondentsand an increase in the numbers of persons who reported violent or property crimes. Overall, 35.6%of respondents reported being a victim of at least one crime in the previous 24 months, and most victimizationexperiences were associated with property crimes. This compares with 20.8% of the respondents in the 2005Survey.The findings from this survey resulted in identifying profiles for the victims of a violent or propertycrime in Texas. These profiles are largely similar to what has been reported in national crime victimizationsurveys. This information is potentially useful in devising strategies to better educate the public about thelikelihood of victimization and steps that might be taken to avoid such an occurrence. Not surprisingly, 63%of the victims of a violent crime were injured in the incident, and 73% of those victims experienced somekind of emotional reaction to their victimization. This underscores the importance of having the needed communityresources to assist victims.The finding that the age of a person is unrelated to the likelihood of victimization is consistent withprevious research in this area. It is speculated that because the lifestyles of young adults often include beingout in public more and interacting with a variety of people, this places them at greater risk than older adultswhose lifestyles are more settled.22
<strong>Crime</strong> Victims’ InstituteThe finding that a person’s marital status was related to violent crime victimization is also consistentwith much previous research. Generally speaking, persons who are married are less likely to be a victim of aviolent crime than those who are not married. It is speculated that this relationship is also related to lifestylefactors, as it is for a person’s age.The two most frequently reported property crimes were damage to property and thefts outside of aresidence. The third most common type of property crime reported was articles inside a vehicle. These resultsmay be related to the finding that being employed increases the risk that a person will be a property crime victim.That is, residences are more likely to be unattended when someone is working, and the vehicles peopleuse for transportation are more likely to be parked in public areas.Similar to what was found in last year’s survey, no relationship was found between gun ownership orthe presence of neighborhood watch programs and a person’s likelihood of victimization.The number of crime victims who reported the crime(s) to the police was lower than found in the 2005survey. Only 58% of violent and property crime victims in the sample reported the crimes to the police. It isnot surprising to find a higher reporting rate for property crime victims, since a police report may be requiredfor insurance reimbursement purposes. Those victims in the sample who reported the crimes to law enforcementofficials were largely satisfied with the way they were treated. This was true for both person and propertycrime victims.As with any research project, there are limitations to this study. Many of the demographic characteristicsof the sample were not representative of the Texas adult population. For example, the sample contained adisproportionately high number of females, Caucasians, and older citizens. This means that caution must beused when generalizing our findings to all Texas residents. The sample characteristics, however, were quitesimilar to those of the 2004 and 2005 surveys conducted by the <strong>Crime</strong> Victims’ Institute. Worth noting, however,is that there was a higher percentage of single, never married respondents (24.2%) than was true lastyear. The 2006 survey sample contained a larger percentage of persons who did not finish high school(14.1%) than was true last year. The number of people who earned less than $20,000 (20.7%) was higher inthis sample than previous ones.In future victimization surveys, continuing efforts will be made to examine the possible relationshipbetween respondent personal and situational characteristics and criminal victimization. Future surveys will addressnot only violent and property victimization, but more specific types of victimization. A focal issue in the2005 <strong>Victimization</strong> Survey was identity theft. This survey also looked at stalking. Those results will be presentedin a separate report. The 2007 Survey will address intimate partner violence.Endnotes1 Catalano, S. M. (2005). Criminal victimization, 2004. National <strong>Crime</strong> <strong>Victimization</strong> Survey. Bureau of Justice Statistics.2National <strong>Crime</strong> <strong>Victimization</strong> Survey, 2004; Uniform <strong>Crime</strong> Report, Federal Bureau of Investigation, 2004.3Marquart, supra note 2.4Catalano, supra, note 1; Patsy A. Klaus. (2004). <strong>Crime</strong> and the Nation’s Households, 2003. NCJ 206348. Washington, DC: U.S. Department ofJustice.5Catalano, supra, note 2. This is generally true, although differences exist depending on the type of offense and gender of victim.6Of those reporting multiple violent victimizations, 10 respondents reported two victimization incidents, four respondents reported 3 incidents, tworespondents reported four incidents, and two respondents reported five incidents.7National <strong>Crime</strong> <strong>Victimization</strong> Survey, 2004.8Of those reporting multiple property victimizations, 44 reported two, 19 reported three, seven reported four, seven reported five, three reported six,and one reported seven.23
Texas State University SystemCharles R. MatthewsChancellor, AustinBoard of RegentsKent AdamsChair, BeaumontBernie C. FrancisVice-Chair, CarrolltonAlan W. DreebenSan AntonioJohn E. DudleyComancheKen LuceDallasPollyanna A. StephensSan AngeloFrancis “Frank” BartleyStudent RegentSan MarcosDora G. AlcalaDel RioDionicio “Don FloresEl PasoGreg WilkinsonDallas


