Route 67 Corridor Study - Capital District Transportation Committee
Route 67 Corridor Study - Capital District Transportation Committee
Route 67 Corridor Study - Capital District Transportation Committee

Create successful ePaper yourself
Turn your PDF publications into a flip-book with our unique Google optimized e-Paper software.
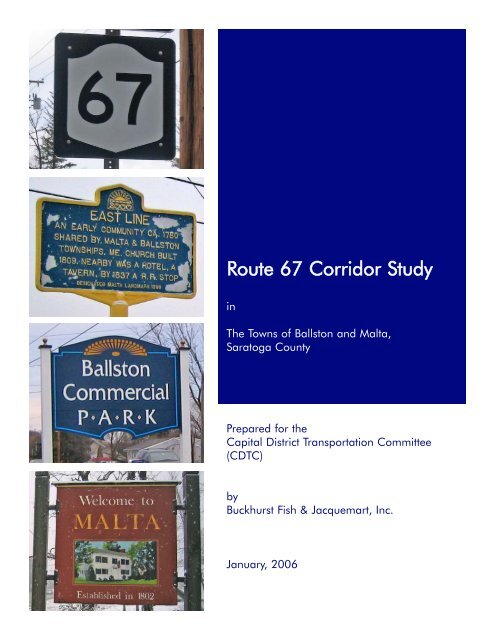
<strong>Route</strong> <strong>67</strong> <strong>Corridor</strong> <strong>Study</strong>inThe Towns of Ballston and Malta,Saratoga CountyPrepared for the<strong>Capital</strong> <strong>District</strong> <strong>Transportation</strong> <strong>Committee</strong>(CDTC)byBuckhurst Fish & Jacquemart, Inc.January, 2006
<strong>Route</strong> <strong>67</strong> <strong>Corridor</strong> <strong>Study</strong>inThe Towns of Ballston and Malta, Saratoga CountyPrepared for the:<strong>Capital</strong> <strong>District</strong> <strong>Transportation</strong> <strong>Committee</strong> (CDTC)January 2006Prepared by:Buckhurst Fish & Jacquemart Inc. (BFJ)115 Fifth AvenueNew York, NY 10003www.bfjplanning.com
TABLE OF CONTENTS1. Introduction...............................................................................................42. Existing Traffic Conditions ..........................................................................42.1. Existing Roadway Conditions ...............................................................42.2. Existing Land Uses and Zoning ............................................................62.3. Daily Traffic Volumes ..........................................................................62.4. Peak Hour Traffic Volumes ..................................................................62.5. Existing Levels of Service and Delays ..................................................132.6. Arterial Level of Service .....................................................................153. Safety......................................................................................................174. 2010 Traffic Conditions ...........................................................................204.1. 2010 No-Build Traffic Conditions ......................................................204.2. Future (2010) Build Conditions ..........................................................214.3. Future Traffic Conditions without Major Retail Centers.........................325. 2010 Traffic Management Program..........................................................365.1. <strong>Route</strong> <strong>67</strong> Within Malta.......................................................................365.2. Southerly Section of <strong>Route</strong> <strong>67</strong> in Ballston ............................................375.3. V-Corners.........................................................................................425.4. <strong>Route</strong> 50 & Brookline Rd ...................................................................425.5. Future Traffic Conditions with Improvements. .....................................426. Parallel Road...........................................................................................477. Access Management Plan.........................................................................477.1. Goals of an access management plan ...............................................477.2. Access Management Benefits.............................................................517.3. Access Management Plan..................................................................528. Bicycle / Pedestrian Circulation Plan .........................................................539. Implementing the Improvements...............................................................579.1. . Matrix of Improvements...................................................................579.2. - Implementing Town Regulatory Changes .........................................59Appendix A – Speed Delay Run Summary ........................................................61Appendix B – Detailed Traffic Forecasts............................................................63<strong>Route</strong> <strong>67</strong> <strong>Corridor</strong> <strong>Study</strong> 1
LIST OF FIGURESFigure 1.1 - <strong>Study</strong> Area .................................................................................5Figure 2.1 - Zoning Map – Towns of Ballston and Malta .................................7Figure 2.2 - Existing Land Uses Along the <strong>Route</strong> <strong>67</strong> <strong>Corridor</strong>...........................8Figure 2.3 - Properties for Sale, Under Development or Vacant along the<strong>Corridor</strong>.....................................................................................9Figure 2.4 - Daily Traffic Volumes................................................................10Figure 2.5 - Existing AM Peak Hour Turning Movements................................11Figure 2.6 - Existing PM Peak Hour Turning Movements ................................12Figure 3.1 - Intersection Accidents and Severity (1999 to 2001) .....................18Figure 3.2 - Non-Intersection Accidents Over a Three Year Period (1999 to2001) ......................................................................................19Figure 4.1 – Development Projects ...............................................................27Figure 4.2 - Build 2010 AM Peak Hour Turning Movements ..........................29Figure 4.3 - Build 2010 PM Peak Hour Turning Movements...........................30Figure 4.4 - Build 2010 AM Peak Hour Turning Movements without Major RetailCenters ....................................................................................33Figure 4.5 - Build 2010 PM Peak Hour Turning Movements without Major RetailCenters ....................................................................................34Figure 5.1 - Option A – Grade Separated Access to Curtis Lumber ................38Figure 5.2 - Option B – New Signalized Intersection at Curtis Lumber with <strong>Route</strong><strong>67</strong> Widened .............................................................................40Figure 5.3 - Option C – Two Roundabouts & New Right Turn Only Egress forCurtis Lumber...........................................................................41Figure 5.4 - Proposed Roundabout at <strong>Route</strong> <strong>67</strong> and Brookline Road ..............43Figure 5.5 - Proposed Roundabouts at V-Corners .........................................44Figure 6.1 - Southern Portion of Parallel Road ..............................................48Figure 6.2 - Northern Portion of Parallel Road ..............................................49Figure 6.3 - Cross Section of Parallel Access Road ........................................50Figure 7.1 - Percentage of Driveway Crashes by Movemen ..........................51Figure 8.1 - Proposed Connections to Zim Smith Trail ...................................55Figure 8.2 - Park and Walk Sign ..................................................................56<strong>Route</strong> <strong>67</strong> <strong>Corridor</strong> <strong>Study</strong> 2
1. IntroductionThe <strong>Route</strong> <strong>67</strong> <strong>Corridor</strong> has experienced increased traffic demand as the surrounding townshave grown. Approximately 15,000 to 18,000 vehicles travel <strong>Route</strong> <strong>67</strong> between the Northwayinterchange and <strong>Route</strong> 50 daily, up from 13,500 to 16,000 just three years ago 1 . <strong>Route</strong> <strong>67</strong> hasbecome a major east-west connector and congestion is becoming an issue. Projecteddevelopment in the surrounding Village of Ballston Spa, and Towns of Ballston and Malta isexpected to put increased pressure on the corridor.The goal of the study is to provide short-term (one to six year) solutions to improve thetransportation infrastructure. Specifically, this study will provide recommendations forintersection improvements, safe and more efficient roadway configurations and potentialparallel access road configurations. BFJ does not recommend any of the developmentmentioned within the report, but simply advises ways to mitigate some of the negative trafficimpacts if the proposed developments are built. In addition, an access management plan wasdeveloped in an effort to improve ingress/egress throughout the corridor. The study alsodeveloped a bicycle and pedestrian plan to facilitate safe crossings of the corridor. Finally,larger issues will be identified for future study considerations.The study area includes <strong>Route</strong> <strong>67</strong> from V-Corners, where <strong>Route</strong> <strong>67</strong> intersects and overlaps with<strong>Route</strong> 50 to the I-87 interchange. Brookline Road, between <strong>Route</strong>s 50 and <strong>67</strong> is also part ofthe study area (see Figure 1.1). The study area is split between two towns, the Town of Ballston,which is located to the west of Eastline Road and the Town of Malta to the east. Due toincreasing development pressures, the town of Malta enacted a building moratorium in August2004 to rewrite their master plan. Malta's moratorium was enacted prior to the beginning ofthis study, and expired in August 2005. The Town of Ballston, which is facing similarcongestion and development issues enacted a moratorium in February 2005 to update theirmaster plan and zoning. The Town of Ballston's moratorium is expected to be in place for oneyear.BFJ was retained by the <strong>Capital</strong> <strong>District</strong> <strong>Transportation</strong> <strong>Committee</strong> (CDTC) to providesuggestions on how to improve the corridor without widening <strong>Route</strong> <strong>67</strong>. As part of the studyprocess BFJ organized a series of five meetings with an advisory committee made up ofrepresentatives from the Planning Boards of the Towns of Malta & Ballston, Saratoga CountyPlanning Department, CDTC, New York State Department of <strong>Transportation</strong> (NYSDOT) Region1, and Town of Ballston Land Conservation <strong>Committee</strong>. The meetings were held both to gatherinformation and to receive feedback from specific proposals put forth.2. Existing Traffic Conditions2.1. Existing Roadway Conditions<strong>Route</strong> <strong>67</strong> runs in an east-west orientation in the eastern portion of the study area and a northsouthdirection in the western portion. The <strong>Route</strong> <strong>67</strong> <strong>Corridor</strong> which runs from the I-87interchange to the overlap with <strong>Route</strong> 50 is approximately 3 ¼ miles in length. Brookline Roadfrom <strong>Route</strong> <strong>67</strong> to <strong>Route</strong> 50 is approximately 0.5 miles in length. This two-lane urban arterial's1<strong>Capital</strong> <strong>District</strong> <strong>Transportation</strong> <strong>Committee</strong>, <strong>Route</strong> <strong>67</strong> <strong>Corridor</strong> <strong>Study</strong> RFP, November 2004, pg. 1<strong>Route</strong> <strong>67</strong> <strong>Corridor</strong> <strong>Study</strong> 4
Brookline Rd.The <strong>Route</strong> <strong>67</strong> study corridor is represented by the red lineIt begins at I-87 in the east and ends at the <strong>Route</strong> <strong>67</strong>/50overlap to the west.Brookline Road between <strong>Route</strong> <strong>67</strong> and <strong>Route</strong> 50 is alsoincluded in the study area.Property lines in the Town of Malta are yellow.Property lines in the Town of Ballston are white.FIGURE 1.1 STUDY AREA0.5 milesROUTE <strong>67</strong> CORRIDOR STUDY June 2005Source:NYS GIS Clearinghouse
surface condition is generally perceived to be good. <strong>Route</strong> <strong>67</strong> between V-Corners and EastlineRoad is 22 feet wide with 2-3 foot shoulders. The section between Eastline Road and I-87 isgenerally 24 feet wide with a two foot shoulder. There are no sidewalks along <strong>Route</strong> <strong>67</strong> withinthe study area. The speed limit along <strong>Route</strong> <strong>67</strong> is 45 MPH, while along <strong>Route</strong> 50 the speedlimit is 40 MPH. At the start of the study, traffic signals spacing was one to two miles. Some ofthe signals at the easterly end of the corridor are in the process of being replaced byroundabouts.2.2. Existing Land Uses and ZoningIn order to better understand the study area, a map was created showing the zoning in the twotowns. As seen in Figure 2.1, zoning differs greatly between the Towns of Ballston and Malta,with the Town of Ballston dominated by Industrial and Commercial Zoning. In the Town ofMalta, zoning is largely residential along the <strong>Route</strong> <strong>67</strong> corridor, with PDD (PlannedDevelopment <strong>District</strong>) being open to a variety of uses. Commercial activity is permitted alongthe <strong>Route</strong> 9 <strong>Corridor</strong>.To better understand current development patterns, a land use survey was performed inFebruary 2005. The results are shown in the existing Land Use Map (Figure 2.2). As can beseen, Malta's portion of the study area is dominated by former agricultural uses, while in theTown of Ballston, land uses are divided between vacant, industrial and residential. A "soft site"map which shows the locations where development is proposed, property is for sale or vacant isshown in Figure 2.3. As can be seen approximately 50% of the frontage along <strong>Route</strong> <strong>67</strong> fallsinto one of these categories.2.3. Daily Traffic VolumesRecent traffic volumes were obtained from NYSDOT for the study area. The traffic volumereport shows the number of vehicles passing a specific location on an hourly basis. Thereadings are taken over several days. The average weekday and weekend counts are thenmultiplied by different factors (seasonal, local conditions) to get the estimated Average AnnualDaily Traffic (AADT). Figure 2.4 shows the AADT volumes (with corresponding dates taken) forthe various portions of the study area. Other readings are listed as ADT which are simply rawaverages and have not been adjusted to compensate for seasonal variations. The AADT along<strong>Route</strong> <strong>67</strong> west of the Northway interchange is almost 18,000 for both directions together.2.4. Peak Hour Traffic VolumesBFJ gathered peak hour traffic volumes from a variety of sources, including CDTC, NYSDOTand traffic impact statements for projects within the study area. AM peak traffic volumes aredisplayed in Figure 2.5, and PM peak hour volumes in Figure 2.6. The peak hour varied byintersection as shown in Table 2.1, with the AM peak hour occurring between 7:00AM and8:30AM, and the PM peak hour between 4:15PM and 5:45PM.<strong>Route</strong> <strong>67</strong> <strong>Corridor</strong> <strong>Study</strong> 6
PDDR1Rural <strong>District</strong>PDDPDDPDDRural <strong>District</strong>R1LCFIGURE 2.1 ZONING MAP - TOWNS OF BALLSTON AND MALTA0.5 milesROUTE <strong>67</strong> CORRIDOR STUDYJune 2005Source: Town of MaltaTown of Ballston
FIGURE 2.2 EXISTING LAND USES ALONG THE ROUTE <strong>67</strong> CORRIDOR0.5 milesROUTE <strong>67</strong> CORRIDOR STUDYJune 2005Source: Land Use SurveyNYS GIS Clearinghouse
FIGURE 2.3 PROPERTIES FOR SALE, UNDER DEVELOPMENT OR VACANT ALONG THE CORRIDOR 0.5 milesROUTE <strong>67</strong> CORRIDOR STUDYJune 2005Source:Town of MaltaTown of BallstonSaratoga CountyLand Use Survey
FIGURE 2.4 DAILY TRAFFIC VOLUMES0.5 milesROUTE <strong>67</strong> CORRIDOR STUDYJune 2005Source: NYSDOT
103043411311432Rt 50/<strong>67</strong>/Ballston Ave(February 2001)61061934522912Brookline Rd/Rt <strong>67</strong>(July 2004)I-87 Northbound Ramps(November 2000)106314110375192598127322262692209523481844721681107610348327020913337702470141Brookline Rd(June 2002)Eastline Rd(October 2002)4635779852736834474201148991918613565281608428Curtis Lumber/Rt <strong>67</strong>(March 2005)Ruhle Rd/Rt <strong>67</strong>(May 2005)53258928517I-87 Southbound Ramps(October 2000)FIGURE 2.5 EXISTING AM PEAK HOUR TURNING MOVEMENTS0.5 milesROUTE <strong>67</strong> CORRIDOR STUDYMay 2005Source: CDTC, NYSDOTCreighton Manning
742133857303370523170022512001241812298986541187330229112049514010252211133226411135040127102111Rt 50/<strong>67</strong>/Ballston Ave(February 2001)26394145271108Brookline Rd(June 2002)19597115FIGURE 2.6 EXISTING PM PEAK HOUR TURNING MOVEMENTSROUTE <strong>67</strong> CORRIDOR STUDYEastline Rd(October 2002)I-87 Southbound Ramps(October 2000)I-87 Northbound Ramps(November 2000)20653608591571814717Brookline Rd/Rt <strong>67</strong>(July 2004)507385739486<strong>67</strong>3042205381Curtis Lumber/Rt <strong>67</strong>(March 2005)Ruhle Rd/Rt <strong>67</strong>(May 2005)0.5 milesMay 2005Source: CDTC, NYSDOTCreighton Manning15214411
Table 2.1 – AM and PM Peak Hour in <strong>Study</strong> AreaAM Peak Hour Intersection PM Peak Hour Intersection7:00 to 8:00AM V-Corners 4:15 to 5:15 PM Curtis LumberEastline 4:30 to 5:30PM <strong>67</strong>/BrooklineI-87 SB Ramps EastlineI-87 NB Ramps I-87 SB Ramps7:30 to 8:30 AM Curtis Lumber 50/Brookline50/Brookline 4:45 to 5:45 I-87 NB Ramps<strong>67</strong>/BrooklineV-CornersAs can be seen in Figures 2.5 and 2.6 the traffic counts were taken between the years of 2000and 2005. The numbers from prior years were increased by 2% per year to bring them up to2004 levels. The 2% per year growth was based on the information published by NYSDOT inthe 2003 Traffic Volume Report which stated that traffic growth on <strong>Route</strong> 50 in the vicinity of V-Corners over the last several years was approximately 1.6%. To be on the conservative side, abackground growth rate of 2% was applied to the traffic volumes at the study areaintersections. 2 Turning movements taken in 2005 were not factored downwards.2.5. Existing Levels of Service and DelaysBased on the peak-hour traffic volumes and on geometric measurements made during the siteevaluation, all intersections were analyzed using the Highway Capacity Manual method(<strong>Transportation</strong> Research Board, Special Report 209, Fourth Edition, 2000 Update). Trafficconditions are described in terms of level of service (LOS) with the levels ranging from LOS A,the best, to LOS F, the worst. Level of service C is generally considered the design level ofservice, while LOS D is generally considered as the acceptable limit during peak hours. Level ofservice E is typically at or near the capacity of the roadway or intersection and generallyinvolves unacceptable delays.Levels of service for signalized intersections are defined in terms of average control delay pervehicle. Delay is dependent on a number of variables including the quality of signalprogression, cycle length, green ratio and the volume/capacity ratio for the lane group orapproach in question. For signalized intersections, levels of service can be calculated andexpressed for each movement or approach and for the total intersection as a weighted averageof all movements. Specifically, level of service criteria are stated in terms of the average controldelay per vehicle for the worst 15-minute period within the peak hour, as shown in Table 2.2.Control delay includes initial deceleration delay, queue move-up time, stopped delay, and finalacceleration delay.2Traffic Impact <strong>Study</strong> – Dunkin Donuts, <strong>Route</strong> 50, Town of Ballston, Saratoga County, NY; CME Project #04-138, January 24, 2005, pg. 2<strong>Route</strong> <strong>67</strong> <strong>Corridor</strong> <strong>Study</strong> 13
Table 2.2 – Level of Service Criteria for Signalized Intersections 3Level of Average Control DelayService (seconds/vehicle)A 10.0 or lessB 10.1 to 20.0C 20.1 to 35.0D 35.1 to 55.0E 55.1 to 80.0F more than 80.0Level of service analyses for an unsignalized intersection are based on average control delay,defined as the total elapsed time from when a vehicle stops at the end of the queue until thevehicle departs from the stop line. This includes the time required for the vehicle to travel fromthe last-in-queue position to the first-in-queue position. The total delay for a particular minormovement is a function of the service rate or capacity of the approach and the degree ofsaturation. The level of service criteria for unsignalized intersections are shown in Table 2.3.Table 2.3 – Level of Service Criteria for Unsignalized Intersections 4Level of Average Control DelayService (seconds/vehicle)A 10.0 or lessB 10.1 to 15.0C 15.1 to 25.0D 25.1 to 35.0E 35.1 to 50.0F more than 50.0Using the capacity analysis methodology described above, peak-hour traffic volumes wereanalyzed to determine the existing levels of service for the six study intersections for the weekdaymorning and afternoon peak hours. Table 2.4 show the existing levels of service for eachintersection approach as well as the overall level of delay.As can be seen, nearly all of the intersections within the study area operate with good toacceptable levels of service at the peak hours analyzed, with the exception of two intersectionsduring the PM peak period - Curtis Lumber approach to <strong>Route</strong> <strong>67</strong> intersection where thenorthbound left operates at a LOS F, with a delay of 163.6 seconds and the intersection ofEastline Road and <strong>Route</strong> <strong>67</strong> which is operating at LOS E and has a delay of 69.9 seconds.3Highway Capacity Manual, TRB Special Report 209, Fourth Edition, 2000 Update.4Highway Capacity Manual, TRB Special Report 209, Fourth Edition, 2000 Update.<strong>Route</strong> <strong>67</strong> <strong>Corridor</strong> <strong>Study</strong> 14
Table 2.4 - Existing Levels of Service (LOS)AM Peak PM PeakIntersection Delay LOS Delay LOSOverall 16.B B 21.0 CRt. 50 & Eastbound 21.1 C 16.3 BBrookline Rd Westbound 31.1 C 40.0 Bsignalized Northbound 9.5 A 14.8 BV-CornerssignalizedBrookline& Rt. <strong>67</strong>unsignalizedCurtisLumber& Rt. <strong>67</strong>unsignalizedSouthbound 10.6 B 9.6 AOverall 19.3 B 48.3 DEastbound 20.3 C 19.2 BWestbound 25.2 C 101.1 FNorthbound 19.3 C 24.7 CSouthbound 16.0 B 18.3 BNorthbound Left 9.4 A 10.1 BEastboundLeft/Right33.8 D 18.0 CWestbound Left 10.9 B 9.9 ANorthbound Left <strong>67</strong>.6 F 157.9 FNorthbound Right19.5 C 17.7 COverall 30.2 C 69.9 EEastline & Eastbound 16.9 B 23.2 CRt. <strong>67</strong> Westbound 15.3 B 106.0 Fsignalized Northbound 64.9 E 100.3 FSouthbound 56.9 E 21.9 CRuhle Rd. Westbound Left 10.2 B 9.5 A& Rt. <strong>67</strong> Northboundunsignalized Left/Right23.1 C 26.0 DI-87 SBOverall 52.6 D 34.5 CRamps & Eastbound 34.6 C 46.4 DRt. <strong>67</strong> Westbound 21.7 C 16.9 Bsignalized Southbound 138.6 F 46.4 DI-87 NBOverall 26.6 C 52.2 DRamps & Eastbound 14.4 B 25.7 CRt. <strong>67</strong> Westbound 33.4 C 32.8 Csignalized Northbound 27.3 C 97.0 F2.6. Arterial Level of ServiceTo determine the arterial LOS for <strong>Route</strong> <strong>67</strong> a speed and delay timing exercise was performedby the CDTC on May 17 th , 2005 (see the appendix for raw data). The travel times and speedswere analyzed using the Highway Capacity Manual Urban Streets Methodologies (HCM 2000,Chapter 15). LOS for streets are based upon both running speeds and control delays todetermine average travel speed. This speed is then compared with the range of free-flowspeeds (FFS) of various classes of streets to determine LOS. <strong>Route</strong> <strong>67</strong> between State Farm Roadand within our study area did not fit neatly within any of the established classifications. FromState Farm Road to the V-Corners <strong>Route</strong> <strong>67</strong> has only one signal. It does not conform to either<strong>Route</strong> <strong>67</strong> <strong>Corridor</strong> <strong>Study</strong> 15
Class I or II, but it is not a rural two-lane highway either. <strong>Route</strong> <strong>67</strong> was determined to be onthe lower end of Urban Street Class I, or the upper end of Urban Street Class II. For this reason,the LOS was computed for both classes as shown in Table 2.5 and the results are not as'accurate' as they would be had the roadway fit within an established classification. If <strong>Route</strong> <strong>67</strong>is an Urban Street Class I, it generally operates at LOS C, while if it is considered Urban StreetClass II, it operates at LOS B.Table 2.5 - Existing Arterial Levels of Service (LOS)Based on Speed Delay Run - <strong>Route</strong> <strong>67</strong> from I-87 SB Ramps to <strong>Route</strong> 50AM Peak HourLOSAverageTravel SpeedUrban StreetClass ILOSUrban Street Class IIWestbound 34.8 B BEastbound 32.7 C BPM Peak HourWestbound 32.3 C BEastbound 32.2 C BMeasurements were taken on May 17th & 18th 2005Source: CDTCTo determine mid-block capacity, we relied on CDTC's research with regard to two-lane urbanand suburban arterials 5 . These numbers assume that left turns are not managed. CDTC warnsthat these numbers should not be used as justification for widening a road, as other ways ofmanaging traffic and land use must be considered.Roadway TypeSurface Arterial – Single Lane(each direction)Surface Arterial – Two LaneUndivided (each direction)Approximate LOS DCapacity (each direction)Approximate LOS ECapacity (each direction)1,000 vph 1,300 vph2,500 vph 3,120 vph 6Based on studies performed by CDTC, LOS D is reached for a single lane surface arterial at thethreshold of 1,000 vph. As all of the listed volumes in Table 2.6 are lower than 1,000 vph, allexisting volumes within the study area are LOS C or better.Table 2.6 – Existing Arterial VolumesAMPMRoadway Between Eastbound Westbound Eastbound WestboundBrookline <strong>Route</strong> <strong>67</strong> <strong>Route</strong> 50 358 213 245 376<strong>Route</strong> <strong>67</strong> V-Corners Brookline Rd 477 291 389 576<strong>Route</strong> <strong>67</strong> Brookline Eastline 819 551 740 791<strong>Route</strong> <strong>67</strong> Eastline Rd I-87 9<strong>67</strong> 563 740 8<strong>67</strong>5CDTC - Procedures for Public/Private Financing in the <strong>Capital</strong> <strong>District</strong>, September 12, 19896CDTC – Urban Arterial, Collector, Expressway, and Local Road Mid-Block Capacity Thresholds, June 10,2003<strong>Route</strong> <strong>67</strong> <strong>Corridor</strong> <strong>Study</strong> 16
3. SafetyAn accident analysis was conducted along the <strong>Route</strong> <strong>67</strong> <strong>Corridor</strong> to determine the location andseverity of accidents along the corridor. Accident information was obtained by SaratogaCounty Planning from NYSDOT for the years 1999 to 2001. During the time period there werea total of 184 accidents including one fatality and 57 injury accidents which resulted in a totalof 88 injuries. There was one accident involving a pedestrian and one involving a cyclist duringthe time period, both of which occurred north of the intersection of Brookline Road with <strong>Route</strong><strong>67</strong>. The accidents were plotted in Figure 3.1, which shows intersection accidents and theirseverity and Figure 3.2 which displays non-intersection accidents. The difference between thetotal number of accidents and total of fatality, injury and PDO crashes is the number of nonreportableaccidents. As can be seen, the location with the highest accidents and also thegreatest number of injury accidents is V-Corners, where 17 accidents occurred in a three yearperiod, of which 7 resulted in injuries. The other high accident intersections are <strong>Route</strong> I-87 / <strong>67</strong>intersection where 16 accidents occurred, two of which resulted in injuries and the intersectionof <strong>Route</strong> <strong>67</strong> / Eastline Road, where 14 accidents occurred, of which 5 resulted in injuries.Table 3.1 - Accidents Along <strong>Route</strong> <strong>67</strong> Between V-Corners and I-87 from 1999 to 2001IntersectionAccidentsNon-IntersectionAccidentsTotalAccidentsTotalAccidents 71 113 184Total Fatalities 0 1 1InjuryAccidents 19 38 57Total Injuries 26 62 88PropertyDamage Only 23 41 64Non-Reportable 29 33 62Regarding non-intersection accidents, the greatest concentration occurred along <strong>Route</strong> <strong>67</strong>between the intersections with Brookline Road and Eastline Road. This 1.2 mile stretch(including the intersections) witnessed a total of 74 7 accidents during the three year period, ofwhich 17 accidents resulted in an injury. This stretch of roadway averaged 24 accidents peryear.The accident rate for the entire corridor is 5.69 ACC/MVM (accidents per million vehicle miles),which is 156% more than the NY statewide average of 3.66 ACC/MVM for urban, undividedtwo lane State Highways. As seen in Table 3.2, breaking down the route into three segmentsresults in the highlighting of the 1.2 mile stretch between Brookline and Eastline Roads wherethe accident rate is 6.30 ACC/MVM, which is 172% of the statewide average.7The locations with fewer than four non-intersection accidents are not listed on Figure 3.2<strong>Route</strong> <strong>67</strong> <strong>Corridor</strong> <strong>Study</strong> 17
FIGURE 3.1 INTERSECTION ACCIDENTS AND SEVERITY (1999 TO 2001)0.5 milesROUTE <strong>67</strong> CORRIDOR STUDYJanuary 2005Source: NYSDOTSaratoga Co. Planning
Each number on the map represents the number of accidentsthat occurred along a tenth of a mile stretch of roadway over thepast three years.Note: Only locations with more than 3 accidents are listedThere were 32 additional accidents scattered throughout thestudy corridorFIGURE 3.2 NON-INTERSECTION ACCIDENTS OVER A THREE YEAR PERIOD (1999-2001)0.5 milesROUTE <strong>67</strong> CORRIDOR STUDYFebruary 2005Source: NYSDOTSaratoga Co. Planning
Table 3.2 - Accident Rates per segment between V-Corners and I-87 from 1999 to 2001V-Corners toBrooklineBrooklineRoad toEastline Roadto I-87Segment Road Eastline RoadLength ofSegment 0.7 1.2 1.4# of Crashes 36 74 74Rate(ACC/MVM) 5.25 6.30 5.40Increase overState Average 144% 172% 148%4. 2010 Traffic Conditions4.1. 2010 No-Build Traffic ConditionsTo calculate the future traffic conditions for the corridor a background growth rate of 1.5% peryear was applied to the base 2004 figures. This figure was based on CDTC's traffic forecasts,which predict an increase between 1.2% and 2% per year over the next several years. Althoughthe CDTC recently lowered their estimate for future growth, the 1.5% background growth ratewill be used to be conservative. The 1.5% growth per year leads to the "no build scenario".This means that if there is no new development along the <strong>Route</strong> <strong>67</strong> <strong>Corridor</strong>, the traffic will stillincrease by 1.5% per year due to vehicles traveling through the corridor. Due to the fact thatthe background growth rate is conservative, the 2010 traffic forecasts could be consideredappropriate for 2015 or even 2020 estimates. The projected LOS for the 2010 no-buildscenario are shown in Table 4.1. For the intersections of <strong>Route</strong> <strong>67</strong> and the I-87 ramps theroundabouts are assumed to be in place.Table 4.1 - 2010 No Build LOSAM Peak PM PeakIntersection Delay LOS Delay LOSOverall 20.4 C 26.4 CRt. 50 & Eastbound 22.9 C 16.5 BBrookline Westbound 50.0 D 56.3 ERd Northbound 9.8 A 16.6 BSouthbound 11.3 B 9.9 AOverall 20.9 C 60.4 EEastbound 20.6 C 19.4 BV-Corners Westbound 27.3 C 131.3 FNorthbound 19.7 B 25.9 CSouthbound 18.2 B 27.1 CBrookline& Rt. <strong>67</strong>NorthboundLeftEastboundLeft/Right9.8 A 10.7 B<strong>67</strong>.7 F 22.0 C<strong>Route</strong> <strong>67</strong> <strong>Corridor</strong> <strong>Study</strong> 20
Table 4.1 - 2010 No Build LOS (Continued)AM Peak PM PeakIntersection Delay LOS Delay LOSWestbound11.5 B 10.3 BCurtis LeftLumberNorthbound109.9 F oversaturated FLeft& Rt. <strong>67</strong>Northbound22.1 C 20.0 CRightOverall* 41.7 D 50.0 DEastbound 20.9 C 23.3 CEastline &Westbound 13.2 B 40.4 DRt. <strong>67</strong>Northbound 98.4 F 129.1 FSouthbound 91.1 F 22.3 CRuhle Rd.& Rt. <strong>67</strong>I-87 SBRamps& Rt. <strong>67</strong>I-87 NBRamps & Rt.<strong>67</strong>WestboundLeft10.7 B 9.8 ANorthboundLeft/Right26.3 D 31.8 DOverall 2.6 A 2.7 AEastbound 2.4 A 3.0 AWestbound 3.0 A 2.4 ASouthbound 2.4 A 2.4 AOverall 2.4 A 2.6 AEastbound 1.8 A 2.4 AWestbound 3.0 A 3.0 ANorthbound 1.8 A 3.0 A*Assumes STAR project is implementedTable 4.2 shows the arterial volumes for the no build scenario. Based on CDTC's thresholdcriteria LOS D is attained only for <strong>Route</strong> <strong>67</strong> eastbound between Brookline and Eastline Roadsduring the AM peak hour. All other roadway sections operate at LOS C or better.Table 4.2 - No Build Arterial Volumes (2010)AMPMRoadway Between Eastbound Westbound Eastbound WestboundBrookline <strong>Route</strong> <strong>67</strong> <strong>Route</strong> 50 385 229 264 405<strong>Route</strong> <strong>67</strong> V-Corners Brookline 513 313 419 620<strong>Route</strong> <strong>67</strong> Brookline Eastline 882 594 797 852<strong>Route</strong> <strong>67</strong> Eastline I-87 1,042* 606 797 933*Operates at LOS D (all others operate at LOS C or better)4.2. Future (2010) Build ConditionsBFJ collected information for all development projects currently in the planning stages in thetowns of Ballston and Malta (See Table 4.3). Overall 23 projects were identified ranging in sizefrom 19 homes to the development of a technology park which is expected to add millions ofsquare feet of manufacturing and office space to the area.<strong>Route</strong> <strong>67</strong> <strong>Corridor</strong> <strong>Study</strong> 21
Table 4.3 - Traffic Planning Assumptions -Approved and Proposed Developments Near the <strong>Route</strong> <strong>67</strong> <strong>Corridor</strong>1Gross Traffic Generated % Double Net Traffic Generated% Non-Project Use Size Source Trips AM Trips PMPass By 5 Counting Trips AM Trips PMEnter Exit Enter Exit Adjustment Enter Exit Enter ExitAnderson Et. AlSubdivisionSubdivision2 Wal-Mart 1 DiscountFree-StandingSuperstore34203,000SFAdirondack TrustCo 2 Bank 1,800 SFToscana AdultCommunityMobile HomePark5 Yarlin Ozbay Gas Station 6 pumps<strong>67</strong>8Rolling BrookMeadowsBrooklineCondoDevelopmentSaratoga Chapel"Weed"SF Houses 19 unitsNo project proposed, Only lays outan access roadTimes Union Article 3/16/05 - pgB4, ITE Rate (813)Distribution Chart 7/3/01 TrafficFeasibility <strong>Study</strong> ITE Trip GenHandbook (813)11/8/01 Traffic Feasibility <strong>Study</strong>Addendum for Trusco Bank - nonpassby figures191 183 386 400 75% 100% 143 137 290 30010 7 34 3420 units ITE Equation (240) 4 14 8 5 100% 85% 3 12 7 4ITE Rate (945) / ITE TripGeneration Handbook (945)3/1/2004 Rolling Brook MeadowsTraffic Impact <strong>Study</strong> w/DistributionChart30 30 40 40 45% 100% 14 14 18 184 10 12 7 100% 85% 3 9 10 6Townhouses 48 units ITE Equation (230) 5 24 22 11 100% 85% 4 20 19 9Subdivision No project proposedBallston9East LineSubdivisionSF Houses 123 units ITE Equation (210) 24 72 81 48 100% 85% 20 61 69 41SF Houses 86 units ITE Equation (210) 17 52 59 35 100% 85% 14 44 50 30Townhouses 20 units ITE Equation (230) 2 12 11 5 100% 85% 2 10 9 410 Beacon Hill Total 19 64 70 40 16 54 60 3411 Dunkin Donuts 3 2,244 SF1/24/05 Dunkin Donuts TrafficImpact <strong>Study</strong>- Contains DistributionChart116 102 38 43Approx50%62 48 18 23- 1 - May 2005
Table 4.3 - Traffic Planning Assumptions -Approved and Proposed Developments Near the <strong>Route</strong> <strong>67</strong> <strong>Corridor</strong>12Gross Traffic Generated % Double Net Traffic Generated% Non-Project Use Size Source Trips AM Trips PMPass By 5 Counting Trips AM Trips PMEnter Exit Enter Exit Adjustment Enter Exit Enter ExitSSP / Tech ParkPhase IV 4 Industrial Park 325,000SF1998 Corporate Tech Park TrafficImpact <strong>Study</strong> w/Trip DistributionChartWarehousing 16000 SF ITE Equation (150)OfficeBuilding248 55 64 239 100% 90% 223 50 58 21519 4 4 12 100% 90% 17 4 4 118,000 SF ITE Equation (715) 32 4 7 40 100% 90% 29 4 6 3613Aztech Tech.(SSP)Total 24,000 SF 51 8 11 52 46 7 10 47Office 20,124 SF ITE Equation (715) 50 6 10 55 100% 90% 45 5 9 50Light Industry 40,076 SF ITE Rates (110) 32 4 5 34 100% 90% 29 4 5 3114SKS Bottling &Office /Warehouse (SSP)Total 60,000 SF 82 10 15 89 74 9 14 8015 WidewatersShoppingCenter279,000SFITE Equation (820) The DailyGazette Pg A1, Feb, 05 ITE TripGeneration Handbook (820)177 113 591 641 75% 100% 133 85 443 481- 2 - May 2005
Table 4.3 - Traffic Planning Assumptions -Approved and Proposed Developments Near the <strong>Route</strong> <strong>67</strong> <strong>Corridor</strong>161718192021Gross Traffic Generated % Double Net Traffic Generated% Non-Project Use Size Source Trips AM Trips PMPass By 5 Counting Trips AM Trips PMEnter Exit Enter Exit Adjustment Enter Exit Enter ExitLuther ForestTechnologyCampus(Phase I)Luther ForestCondosTraversMeadowsNorthwayFellowshipKelchApartmentsMalta FarmResidentialLuther Forest Technology Campus11/4/2002 Draft Traffic Impact<strong>Study</strong>1000 200 250 1000 100% 90% 900 180 225 900Townhouses 140 units ITE Equation (230) 11 56 53 26 100% 85% 9 48 45 22SF Houses 138 units ITE Equation (210) 27 80 90 53 100% 85% 23 68 77 45Townhouses 32 units ITE Equation (230) 4 17 16 8 100% 85% 3 14 14 7ChurchTotal 31 97 106 61 26 82 90 52Apartments 136 Units ITE Equation (220) 14 56 60 32 100% 85% 12 48 51 27Townhouses 46 Units ITE Equation (230) 5 23 21 10 100% 85% 4 20 18 9SF Houses 56 Units ITE Equation (210) 12 36 40 24 100% 85% 10 31 34 20Apartments 238 Units ITE Equation (220) 24 96 97 52 100% 85% 20 82 82 44ShoppingCenter60,000 SF700 & 1500 seat roomsITE Equation (820) Trip GenHandbook equation (820)Malta70 45 214 232 75% 100% 53 34 161 174Office 55,000 SF ITE Equation (710) 95 13 23 112 100% 90% 86 12 21 10122 Park Place Total 201 190 374 420 169 158 298 33923 Blessed John Cemetery 100 Acres ITE Rate (566) 12 5 28 56 12 5 28 56NotesSF Houses = Single Family Housing1- 7/3/01 Rossi's Traffic Feasibility <strong>Study</strong> Potential Commercial Development predicted: 31 AM / 58 PM Peak Trips2- Figures from Trusco Bank and are approximate for Adirondack Bank3- Trip Generation/Pass-By Trip Estimate from 1/25/04 Dunkin Donuts Traffic Impact <strong>Study</strong> - CME#04-1384- Although the volumes for the SSP may be slightly lower, we used these figures to be conservative5- Pass-by trip estimates based on Institute of <strong>Transportation</strong> Engineers Trip Generation Handbook, 7th Edition, where available- 3 - May 2005
To estimate the number of trips generated by each project we relied on the Institute of TrafficEngineers (ITE) Trip Generation 7 th Edition or we used the figures provided by the project'sTraffic Impact <strong>Study</strong> when such a study was available. The column titled source in Table 4.3describes the source that was used. The number under the field listed as "Gross TrafficGenerated" is the base number which is provided by using these sources.In an effort to refine the trip generation estimates two additional columns were created whichreduce the "Gross Traffic Generated" figure. The first column is entitled, "% Non-Pass By", whichis used to eliminate instances where the vehicle is already on the road. The best example ishow a gas station functions. As seen in row #5, the Gross Traffic figure for the Yarlin Ozbaygas station project estimates that 30 vehicles will enter the gas station during the AM Peakperiod. A certain percentage of vehicles, the pass-by traffic, will be on the road anyway, even ifthis project is not built. Using the estimates of Pass-by trips provided by the ITE Trip GenerationHandbook, 7 th Edition, we calculate that 55% of the trips are pass-by trips. The remainingvehicles, 45% or 14 vehicles are counted as new trips generated by the presence of the gasstation.The next column titled "% Double Counting Adjustment" is used to prevent the counting of thesame vehicle twice. For example, row 9 lists the East Line Subdivision, which is expected togenerate 48 trips exiting the housing development during the PM peak hour. As a percentageof these vehicles will shop or work at the Wal-Mart (row #2), we lowered the gross figures by15% for all residential projects and 10% for office projects to eliminate the number of trips thatwould be double counted. For the East Line Subdivision, this resulted in only 41 PM peak hourtrips as the estimate.To determine which intersections these trips would impact, all the projects were geocoded asseen in Figure 4.1. It should be noted that there are nearly double the amount of projects inthe Town of Ballston (14) as compared with the Town of Malta (9). A trip distribution chart,which distributes the traffic among the most logical routes for egress and ingress to or from thedevelopment site, was then developed for each project. When available the trip distributionpercentages found in the projects' traffic impact study was used. These trips and theirdistribution percentages were then entered into a spreadsheet to determine the impact on eachintersection in the study area. Detailed tables of distribution are available in the Appendix.The traffic data for each intersection showing 2004 peak hour traffic volumes, 2010 peak hourno build traffic volumes and 2010 peak hour build traffic volumes are shown in Table 4.4. Thefirst column lists the name of the project and the corresponding project number which can befound on Figure 4.1. It should be noted that projects #1, Anderson Et. Al Subdivision is notincluded in Table 4.4 since the proposal was only to build a new road on the property nor is#19 Northway Fellowship included, as all trips are expected to occur during off-peak periods.The second column displays the total amount of vehicular trips the project is expected togenerate during the AM and PM peak hours. The remaining columns display the impact theproject will have on each intersection. For example, project #22 Park Place 169 vehicles areexpected to enter the project site during the AM peak hour. Of those trips, only two vehicles areexpect to travel through the intersection of <strong>Route</strong> 50 and Brookline, while 101 vehicles arepredicted to exit I-87 northbound at <strong>Route</strong> <strong>67</strong> on their way to Park Place in the AM peak hour.<strong>Route</strong> <strong>67</strong> <strong>Corridor</strong> <strong>Study</strong> 25
FIGURE 4.1 DEVELOPMENT PROJECTS0.5 milesROUTE <strong>67</strong> CORRIDOR STUDYMay 2005Source: Town of BallstonTown of MaltaSaratoga County
The second to last row of Table 4.4 displays the predicted 2010 build volume, which is a sumof the background traffic growth combined and all the traffic of all the specific developmentprojects. The last row in Table 4.4 shows the expected increase over the 2010 no buildscenario, which shows the increase in projected trips generated from all the developmentprojects. The greatest increase is expected to occur at V-Corners during the PM peak period,where the volume of vehicles is expected to increase by 69% as the result of all developmentprojects. Table 4.4 also shows that the most significant contributors to this increase are theWidewaters project (#15) with more than 300 vehicles in each direction and the Wal-Martproject (#2) with more than 150 vehicles in each direction.These volumes were used to develop Figures 4.2 and 4.3 which display the AM and PM peakhour build volumes, respectively. An HCS analysis was performed to determine the LOS foreach intersection based on the traffic volumes from Table 4.4. The results are displayed in the2010 Build LOS in Table 4.5.The large increase in traffic volume is expected to cause many intersections to fail given theprojected traffic volumes without any improvement to the roadway configuration. At twounsignalized intersections (Brookline/<strong>Route</strong> <strong>67</strong> & Curtis Lumber/<strong>Route</strong> <strong>67</strong>), our analysisindicates it will be extremely difficult to make a left turn out of the side street during AM and PMpeak hours.<strong>Route</strong> <strong>67</strong> <strong>Corridor</strong> <strong>Study</strong> 28
3701405115124717170Rt 50/<strong>67</strong>/Ballston Ave211293207334123Brookline Rd/Rt <strong>67</strong>I-87 Northbound Ramps2399930432385448428611566417986320<strong>67</strong>85011245727108139352476385071729317237702062579396Brookline Rd /Rt 505104891Eastline Rd)375118625415281412Curtis Lumber/Rt <strong>67</strong>Ruhle Rd/Rt <strong>67</strong>855512149519133242161590666I-87 Southbound RampsFIGURE 4.2 BUILD 2010 AM PEAK HOUR TURNING MOVEMENTS0.5 milesROUTE <strong>67</strong> CORRIDOR STUDYMay 2005Source: CDTC, NYSDOTCreighton Manning
5219340517068111106351208134611186509FIGURE 4.3 BUILD 2010 PM PEAK HOUR TURNING MOVEMENTSROUTE <strong>67</strong> CORRIDOR STUDY0.5 milesMay 2005Source: CDTC, NYSDOTCreighton Manning626354945321964Rt 50/<strong>67</strong>/Ballston Ave6326565116<strong>67</strong>9050Brookline Rd/Rt <strong>67</strong>354101151558443012118635923021071139143Brookline Rd /Rt 50201083175Eastline Rd5168730184114129I-87 Southbound RampsI-87 Northbound Ramps869612228820883461012761209344486535889Ruhle Rd/Rt <strong>67</strong>13<strong>67</strong>16122215Curtis Lumber/Rt <strong>67</strong>819
Table 4.5 - 2010 Build Levels of Service (LOS)AM PeakPM PeakIntersection Delay LOS Delay LOSOverall 100.5 F 181.1 FRt. 50 & Eastbound 27.8 C 16.9 BBrookline Westbound 398.5 F 317.2 FRdNorthbound 11.5 B 153.4 FSouthbound 18.1 B 106.9 FOverall 53.0 D 244.2 FEastbound 40.9 D 113.5 FV-Corners Westbound <strong>67</strong>.4 E 409.3 FNorthbound 23.1 C 255.9 FSouthbound 61.6 E 147.3 FBrookline& Rt. <strong>67</strong>CurtisLumber& Rt. <strong>67</strong>Eastline &Rt. <strong>67</strong>Ruhle Rd.& Rt. <strong>67</strong>I-87 SBRamps& Rt. <strong>67</strong>I-87 NBRamps & Rt.<strong>67</strong>NorthboundLeft13.4 B 20.4 CEastboundLeft/Rightoversaturated F oversaturated FWestboundLeft13.8 B 14.2 CNorthboundLeftoversaturated F oversaturated FNorthboundRight37.7 D 66.8 FOverall* 79.8 E 191.5 FEastbound 89.6 F 226.2 FWestbound 26.7 C 158.9 FNorthbound 156.2 F 224.8 FSouthbound 96.8 F 22.3 CWestboundLeft12.2 B 12.5 BNorthboundLeft/Right47.1 E 165 FOverall 3.6 A 4.6 CEastbound 3.6 A 6.0 AWestbound 3.6 A 3.6 ASouthbound 4.2 A 3.6 AOverall 3.1 A 4.5 AEastbound 2.4 A 3.6 AWestbound 3.6 A 5.4 ANorthbound 2.4 A 4.8 A*Assumes STAR project is implemented<strong>Route</strong> <strong>67</strong> <strong>Corridor</strong> <strong>Study</strong> 31
Table 4.6 – 2010 Build Arterial Volumes & LOSAMPMRoadway Between Eastbound Westbound Eastbound WestboundBrookline <strong>Route</strong> <strong>67</strong> <strong>Route</strong> 50 488 C+ 401 C+ 514 C+ 618 C+<strong>Route</strong> <strong>67</strong> V-Corners Brookline 705 C+ 455 C+ 734 C+ 909 C+<strong>Route</strong> <strong>67</strong> Brookline Eastline 1,160 D 907 C+ 1,288 D 1,334 E<strong>Route</strong> <strong>67</strong> Eastline I-87 1,313 E 1,247 D 1,247 D 1,382 EAs seen in Table 4.6, under the build scenario, the arterial volumes are expected to exceed theLOS D and E thresholds for <strong>Route</strong> <strong>67</strong> East of Brookline Road. Even though the future "build"volumes exceed the LOS E limits the arterial traffic condition does not necessarily require anyroadway widening. For instance, within the <strong>Capital</strong> <strong>District</strong>, a section of New Karner Road inColonie carries 1780 vehicles during the PM peak hour with an average speed of 24.4 MPHwhich corresponds to LOS D for a Class I arterial. 84.3. Future Traffic Conditions without Major Retail CentersIn an effort to both analyze the impact of the major retailer centers which are proposed for the<strong>Route</strong> <strong>67</strong> <strong>Corridor</strong> near V-Corners and calculate the future traffic conditions if thesedevelopments are not completed, the figures were recalculated removing both the Wal-Mart(#2) and the Widewaters project (#15). These two projects combined generate almost 1,500trips during the PM peak hour. As shown in Table 4.7, the last row, '% Increase over 2010 NoBuild' is reduced by between 4 and 47 percentage points, with the greatest reduction occurringat V-Corners. The volumes were used to develop Figures 4.4 and 4.5 which display the AMand PM peak hour build volumes, respectively for the scenario without the major retailingcenters. An HCS analysis was performed to determine the LOS for each intersection based onthe traffic volumes in the 2010 Build LOS without the major retail centers (Table 4.8). As canbe seen all intersections will operate at LOS F during the PM peak period, and still requiremitigation measures. The presence of the additional 1,500 trips exacerbates the problem andincreases delays substantially.8Pinebush <strong>Transportation</strong> <strong>Study</strong> Update, CDTC, September 2004<strong>Route</strong> <strong>67</strong> <strong>Corridor</strong> <strong>Study</strong> 32
3651204374702515170Rt 50/<strong>67</strong>/Ballston Ave81292776028914Brookline Rd/Rt <strong>67</strong>I-87 Northbound Ramps23997903583751871286115432471563184774010595727108139352476384901727817234902062572496Brookline Rd /Rt 50599380Eastline Rd)375118215415131399Curtis Lumber/Rt <strong>67</strong>Ruhle Rd/Rt <strong>67</strong>786551911589119242161557643I-87 Southbound RampsFIGURE 4.4 BUILD 2010 AM PEAK HOUR TURNING MOVEMENTS WITHOUT MAJOR RETAIL CENTERS0 0.5 milesROUTE <strong>67</strong> CORRIDOR STUDYMay 2005Source: CDTC, NYSDOTCreighton Manning
443895044406811996351179130211069431FIGURE 4.5 BUILD 2010 PM PEAK HOUR TURNING MOVEMENTS WITHOUT MAJOR RETAIL CENTERSROUTE <strong>67</strong> CORRIDOR STUDY0 0.5 milesMay 2005Source: CDTC, NYSDOTCreighton Manning17405404641529Rt 50/<strong>67</strong>/Ballston Ave18265565945452Brookline Rd/Rt <strong>67</strong>1933235Eastline Rd155844301211863563302107956143Brookline Rd /Rt 50208881365168360147114129I-87 Southbound RampsI-87 Northbound Ramps8558332432087035211056534390975345889Ruhle Rd/Rt <strong>67</strong>118416102715Curtis Lumber/Rt <strong>67</strong>819
Table 4.7 - Traffic Forecasts for <strong>Study</strong> Intersections without Major Retail Centers345DevelopmentAdirondackTrust CoToscanaMobile HomeParkYarlin Ozbay -Gas StationNet Traffic Rt. 50 &Bookline & Curtis Lmbr Eastline & Ruhle Rd. & I-87 SB & I-87 NB &Generation Brookline V-Corners Rt. <strong>67</strong> & Rt. <strong>67</strong> Rt. <strong>67</strong> Rt. <strong>67</strong> Rt. <strong>67</strong> Rt. <strong>67</strong>AM PM AM PM AM PM AM PM AM PM AM PM AM PM AM PM AM PM2004 Volume 1227 1377 1405 1898 1340 1544 1451 1618 1935 2045 1459 1630 2492 2281 1770 25122010 Volume (1.5%)* 1341 1506 1536 2075 1465 1688 1587 1769 2115 2236 1595 1782 2724 2494 1935 2747In 10 34 1 3 6 19 3 10 3 10 3 10 3 9 3 9 2 5Out 7 34 1 3 4 19 2 10 2 10 2 10 2 9 2 9 1 5In 3 7 1 2 3 6 2 4 2 4 2 4 2 4 2 4 1 3Out 12 4 4 1 11 4 7 3 7 3 7 3 7 3 7 3 2 1In 14 18 4 5 9 13 4 5 4 5 4 5 3 5 3 5 2 3Out 14 18 4 5 9 13 4 5 4 5 4 5 3 5 3 5 2 3<strong>67</strong>91012131617182021BrooklineCondoDevelop11 Dunkin Donuts14Rolling BrookMeadowsEast LineSubdivisionBeacon HillSSP/Tech ParkPhase IVAztech TechSKS Bottling &Office/WarehouseLuther Forest(Phase I)Luther ForestCondosTraversMeadowsKelch AptsMalta FarmResidential22 Park PlaceIn 3 10 1 4 0 1 2 6 2 6 2 6 2 6 2 6 1 4Out 9 6 3 2 1 1 5 4 5 4 5 4 5 4 5 4 2 1In 4 19 0 2 0 0 0 0 3 11 0 0 3 11 0 0 0 0Out 20 9 0 0 0 0 0 0 12 6 6 3 12 6 0 0 2 1In 20 69 0 1 2 6 2 7 7 7 7 24 7 7 4 14 2 7Out 61 41 1 1 5 3 6 4 6 4 21 14 6 4 12 8 12 8In 16 60 11 42 2 6 10 36 10 36 10 36 10 36 10 36 6 24Out 54 34 38 24 5 3 33 20 33 20 33 20 33 20 33 20 11 7In 62 18 6 2 34 10 19 5 19 5 19 5 16 5 16 5 9 3Out 48 23 5 2 26 13 14 7 14 7 14 7 12 6 12 6 7 3In 223 58 1<strong>67</strong> 43 78 20 <strong>67</strong> 17 <strong>67</strong> 17 <strong>67</strong> 17 <strong>67</strong> 17 <strong>67</strong> 17 45 12Out 50 215 37 161 17 75 15 65 15 65 15 65 15 65 15 65 7 32In 46 10 34 7 16 3 14 3 14 3 13 3 13 3 13 3 8 2Out 7 47 5 35 3 16 2 14 2 14 2 13 2 13 2 13 1 7In 74 14 55 10 26 5 22 4 22 4 22 4 22 4 22 4 15 3Out 9 80 7 60 3 28 3 24 3 24 3 24 3 24 3 24 1 12In 900 225 9 2 72 18 81 20 20 20 81 20 20 20 261 65 261 65Out 180 900 2 9 14 72 16 81 16 81 16 81 16 81 16 81 52 261In 9 45 0 0 1 4 1 4 0 0 1 4 4 4 3 13 3 13Out 48 22 0 0 4 2 4 2 4 4 4 2 4 2 4 2 14 6In 26 90 0 1 2 8 3 9 0 0 3 9 9 9 9 32 16 54Out 82 52 1 1 7 5 8 5 9 9 8 5 8 5 29 18 49 31In 12 51 0 1 1 5 1 5 0 0 1 5 5 5 4 18 7 31Out 48 27 0 0 4 2 5 3 5 5 5 3 5 3 17 10 29 16In 4 18 0 1 1 3 1 4 0 0 1 4 4 4 3 14 2 8Out 20 9 1 0 3 1 4 2 4 4 4 2 4 2 16 7 9 4In 169 298 2 3 15 27 17 30 0 0 17 30 30 30 59 104 101 179Out 158 339 2 3 14 31 16 34 30 30 16 34 16 34 55 119 95 20423Blessed JohnCemeteryIn 12 28 1 1 2 4 2 6 0 0 2 6 6 6 10 22 5 13Out 5 56 0 3 1 8 1 11 6 6 1 11 1 11 4 45 2 252010 Build Volume% Increase over 2010No Build1757 1960 1941 2530 1876 2174 1973 2255 2545 2748 1973 2260 3464 3317 2725 380931% 30% 26% 22% 28% 29% 24% 27% 20% 23% 24% 27% 27% 33% 41% 39%*CDTC Estimates 0.5% background growth - 1.5% is a conservative estimate May 2005
Table 4.8 - 2010 Build Levels of Service (LOS)without Major Retail CentersAM PeakPM PeakIntersection Delay LOS Delay LOSOverall 87.2 F 112.0 FRt. 50 & Eastbound 27.7 C 16.8 BBrookline Westbound 357.4 F 181.5 FRd Northbound 11.2 B 130.1 FSouthbound 15.0 B 10.6 BOverall 30.5 C 128.5 FEastbound 22.5 C 20.6 CV-Corners Westbound 39.1 D 256.6 FNorthbound 20.5 C 37.3 DSouthbound 32.3 C 101.0 FBrooklineNorthboundLeft12.2 B 13.2 B& Rt. <strong>67</strong> EastboundLeft/Rightoversaturated F 320.1 FWestbound13.1 B 12.0 BCurtisLeftLumberNorthboundoversaturated F oversaturated FLeft& Rt. <strong>67</strong>Northbound30.5 D 32.8 DRightOverall* 66.1 E 108.1 FEastbound 64.0 E 108.6 FEastline &Westbound 24.6 C 94.8 FRt. <strong>67</strong>Northbound 132.0 F 163.5 FSouthbound 100.6 F 22.5 CRuhle Rd.WestboundLeft11.8 B 11.1 B& Rt. <strong>67</strong> NorthboundLeft/Right40.2 E 68.9 F*Assumes STAR project has been implemented5. 2010 Traffic Management Program5.1. <strong>Route</strong> <strong>67</strong> Within MaltaI-87 Northbound and SouthboundIn the summer of 2005, NYSDOT is expected to break ground on a project to build five twolaneroundabouts on the eastern edge of the study area. The five roundabouts will beconstructed at the intersections of <strong>Route</strong> <strong>67</strong> with, from east to west, (1) <strong>Route</strong> 9, (2) Kelch Drive,(3) I-87 Northbound ramps, (4) I-87 Southbound ramps and (5) State Farm Entrance.Completion of the project is scheduled for the fall of 2007. These two-lane roundabouts willprovide a high level of service, effectively turning <strong>Route</strong> <strong>67</strong> into a four lane roadway, and will<strong>Route</strong> <strong>67</strong> <strong>Corridor</strong> <strong>Study</strong> 36
minimize traffic delays. As shown in Table 4.5 the two roundabouts at the I-87 interchange areprojected to operate at levels of service A during both peak hours.Eastline RoadNYSDOT recently upgraded the intersection of <strong>Route</strong> <strong>67</strong> with Eastline Road, which is located onthe border between the Towns of Malta and Ballston. The improvement was part of the ShortTerm Accident Reduction Program, also known as a STAR project. Left turn lanes were added,widening <strong>Route</strong> <strong>67</strong> from a two-lane to a three-lane road at the intersection. As can be seen inTable 4.5, even with the STAR Project improvements, this intersection is predicted to operate atLOS F during the peak PM hour for the 2010 build scenario.BFJ proposes to install a two-lane roundabout at this intersection, which would reduce delays to5.1 and 11.5 seconds and result in LOS to B during both the AM and PM peak periods. Thedevelopment of multiple roundabouts along the corridor will improve safety by minimizing theneed for left turns, into and out of adjacent sites, as vehicles can make right turns with a U-turnat the nearest roundabout.5.2. Southerly Section of <strong>Route</strong> <strong>67</strong> in BallstonCurtis LumberBFJ explored three options to provide improvements in both LOS and safety for this area: (A)grade separated roadway access, (B) at-grade signalized intersection, and (C) right-turns-inand right-turns-out with two roundabouts. All options include the addition of a left turn lane,which will be added as part of the bridge replacement project. The grade separated option(shown in Figure 5.1) provides improved access for both Curtis Lumber and the proposedindustrial park to be located on the north side of <strong>Route</strong> <strong>67</strong> across from Curtis Lumber. Thisoption will also have the greatest safety improvement, which is especially important, as CurtisLumber is in the center of a high crash area. The existing overpass has a vertical clearance of25' and a width of 96'. This overpass is structurally deficient and in need of replacement. Thecurrent plan is to lower <strong>Route</strong> <strong>67</strong> and to replace the overpass with a culvert that is high enoughfor the Zim Smith Trail to pass under <strong>Route</strong> <strong>67</strong>. Alternative A would consist in replacing theexisting overpass with a modified overpass that would be lower and narrower, and that wouldallow a two-lane roadway plus the Zim Smith Trail to pass underneath <strong>Route</strong> <strong>67</strong>. Further studyis needed to determine the viability and cost of this option. Initial review by NYSDOTdetermined that the cost of a precast concrete bridge with a 36' opening would beapproximately $1.0 million. In addition, to ensure safe sight lines on the overpass, theindustrial access roadway may need to be depressed under <strong>Route</strong> <strong>67</strong> by 5' to 10', raising thecost of the roadway to approximately $1.5 million per lane mile. A very preliminary costprovided by NYSDOT for the incremental difference between a bridge structure that wouldaccommodate an access road and multi-use path and a precast concrete structure toaccommodate a multi-use path would be approximately $2.3 million. This cost would alsoinclude the depression of the access road and trail under <strong>Route</strong> <strong>67</strong> and the work on theCounty's sanitary sewer transmission line.<strong>Route</strong> <strong>67</strong> <strong>Corridor</strong> <strong>Study</strong> 37
FIGURE 5.1 OPTION A - GRADE SEPARATED ACCESS TO CURTIS LUMBER 300 FeetROUTE <strong>67</strong> CORRIDOR STUDYJune 2005
Option B, shown in Figure 5.2, involves the installation of a traffic signal at the intersection ofthe Curtis Lumber driveway and <strong>Route</strong> <strong>67</strong> and the widening of <strong>Route</strong> <strong>67</strong> to five lanes (2 lanes ineach direction plus a left-turn lane) for a length of about 600 to 1,000 feet. Traffic wouldmerge back to one lane after the signalized intersection. The installation of a traffic signal iscontingent on meeting the warrants for signalization.Option C (Figure 5.3), would rely on roundabouts on each end of the segment at Brookline andEastline Road, and prohibition of left turns at Curtis Lumber. A new right-turn only exit wouldbe built at the easterly edge of the Curtis Lumber parking lot. All west bound vehicles would berequired to travel approximately 3,000 feet to the roundabout located at Eastline Road wherethey would make a U-turn. Vehicles coming from the east and wanting to turn into CurtisLumber would be directed to the roundabout at Brookline Road where they would make a U-turn and travel back about 1,500 feet to turn right into Curtis Lumber. Another alterative(Option C.1) – possibly a short-term solution or one for off-peak hours – would be to allowwestbound left turns into Curtis Lumber from an unsignalized left-turn lane.From a safety standpoint, Option A or C is recommended, but due to budgetary and timelineissues Option A might not be feasible at this time. Option A will lead to the greatest reductionin crashes, while Option C will also lead to a reduction in accidents in this segment of thecorridor. In conjunction with the above options, we advise that Curtis Lumber alter the currentroadway configurations on their property. At the current time, Curtis Lumber maintains twoseparate entrances, one for the industrial park and a second for the lumber yard. Werecommend that these two operations be connected by an internal roadway. Curtis Lumbershould have a connection with Eastline Road, which would provide additional options andflexibility. Access from Curtis Lumber to Eastline Road will help reduce the traffic along <strong>Route</strong><strong>67</strong>.Brookline RoadTable 5.1 - 2010 Build Levels of Service (LOS)Curtis Lumber OptionsAM Peak Hour PM Peak HourDelay LOS Delay LOSOption B Signalized 16.9 B 19.9 BOption C Exit Right Only 20.4 C Oversaturated FOptionC.1New Entrance –Left Turn In 10.7 B 15.1 CBrookline Road is currently an unsignalized intersection. As the volume of traffic increases, thisintersection will pass a threshold which will require mitigation. Even under the no-build scenario,the intersection is projected to operate at LOS F during the AM peak hour. In order toaccommodate the increased traffic volumes, there are two available options, signalization ordevelopment of a roundabout. We believe a roundabout is the most viable and safest option (seeFigure 5.4). In addition, as this intersection is located in an environmentally sensitive area due tothe wetlands and wildlife corridors, the development of a roundabout will allow the roadway tomaintain its two lane profile. Signalization will require a minimum of four lanes to<strong>Route</strong> <strong>67</strong> <strong>Corridor</strong> <strong>Study</strong> 39
FIGURE 5.2 OPTION B - NEW SIGNALIZED INTERSECTION AT CURTIS LUMBER WITH ROUTE <strong>67</strong> WIDENED0 750 feetROUTE <strong>67</strong> CORRIDOR STUDYMay 2005Source: National Wetlands InventoryNYDECNYS GIS Clearinghouse
FIGURE 5.3 OPTION C - TWO ROUNDABOUTS &NEW RIGHT TURN ONLY EGRESS FOR CURTIS LUMBER0 750 feetROUTE <strong>67</strong> CORRIDOR STUDYJune 2005Source: National Wetlands InventoryNYDECNYS GIS Clearinghouse
store vehicles while waiting at the intersection. The installation of a roundabout will result inLOS B with a delay of 14.1 seconds during the AM and a LOS D with a 26.7 second delayduring the PM peak hour. The roundabout should be constructed to enable a 4 th leg to beconnected should the proposed parallel access road be developed. The proposed roundaboutat the Brookline Road is the most logical southern terminus for the parallel access road.5.3. V-CornersThis intersection has a very difficult geometry, which leads to its distinctive name. Instead of the90° angles found in a typical intersection, this intersection is composed of two angles ofapproximately 40°, and two at approximately 135°. These angles restrict the maximumcarrying capacity of this intersection and are a significant reason for the high accident statisticsat this location. Regardless of the development plans for this area, the intersection of <strong>Route</strong> <strong>67</strong>with <strong>Route</strong> 50 and Ballston Road will need to be upgraded. In the event that the two majorshopping complexes proceed, a Wal-Mart to the east and the Widewaters shopping center tothe west, the intersection will experience significant traffic delays. In order to increase trafficflow and reduce conflicts, this intersection should be broken into two separate intersections.As shown in Figure 5.5, we recommend a single-lane roundabout at each intersection. Theroundabouts will reduce delays for through traffic as well as provide access to neighboringproperties, if they are developed. Together with right-turn bypass lanes, the single-laneroundabouts will provide an acceptable LOS, and also produce a pedestrian friendly design.They will permit <strong>Route</strong> <strong>67</strong> to remain a two-lane roadway. If these two intersections weresignalized, they would require a minimum of four lanes, and may be required to expand to fiveor six lanes to accommodate additional turning lanes. Such a configuration deters nonmotorizedusers as the crossing distances become too great.5.4. <strong>Route</strong> 50 & Brookline RdThe intersection of <strong>Route</strong> 50 and Brookline Road is located at the west end of the study area. Itis currently an actuated signalized intersection operating at LOS B during both the AM and PMpeak periods. Under the future no-build scenario, approximately 5 seconds of additionaldelay is added to both the AM and PM peak periods, reducing the LOS to C. The future LOSof the intersection deteriorates under the future build scenario to LOS F, with delays of 100 &180 seconds during the AM and PM peak periods. Adding an exclusive left-turn lane to thenorthbound, southbound and westbound approaches, along with shifting 5 seconds of greentime from the north-south phase to east-west phase, will result in a LOS of C (23.4 seconds)and D (53.2 seconds) during the AM and PM peak periods, respectively. Widening of <strong>Route</strong>50 to accommodate additional turn lanes is a recommended mitigation in the 1998 TrafficImpact <strong>Study</strong> for SSP/Tech Park 9 , which should be a source of funding.5.5. Future Traffic Conditions with Improvements.Table 5.3 contains all the proposed mitigations listed above along with the projected LOS anddelays. The suggestions are a baseline of what can be accomplished to ameliorate andimprove upon the traffic conditions. Table 5.2 still shows poor levels of service for some9Traffic Impact <strong>Study</strong> - Proposed Corporate Technology Park, NYS <strong>Route</strong> 50, Clough, Harbour & Associates,LLP, 1998, pg17<strong>Route</strong> <strong>67</strong> <strong>Corridor</strong> <strong>Study</strong> 42
FIGURE 5.4 PROPOSED ROUNDABOUT AT ROUTE <strong>67</strong> AND BROOKLINE ROAD0 50 feetROUTE <strong>67</strong> CORRIDOR STUDYMay 2005
FIGURE 5.5 PROPOSED ROUNDABOUTS AT V-CORNERSROUTE <strong>67</strong> CORRIDOR STUDY0 150 feetAugust 2005
movements. The south roundabout at the V-Corners may need an additional right-turn bypasslane. It should be noted that the above calculations do not take into consideration the effect ofthe parallel road on the V-Corners roundabouts. Also the LOS F estimate for the proposedright-turn out of Curtis Lumber does not take into consideration the traffic reduction resultingfrom the connection to Eastline Road. Since the number of vehicles exiting the Curtis Lumberdriveway is relatively low this condition can be mitigated by the connection.Table 5.2 Proposed Mitigation Measures and Resulting LOSIntersectionRt. 50 &BrooklineRdV-CornersBrookline& Rt. <strong>67</strong>Rt. <strong>67</strong> &CurtisLumberEastline &Rt. <strong>67</strong>Rt. <strong>67</strong> &Ruhle RdProposed Mitigation MeasuresWiden road to add exclusive left-turn lanes forthe northbound, southbound and westboundapproaches. During AM peak hr shift 5 secondsof green time from NS phase to EW phase.During PM peak hr increase cycle length to 90seconds and include exclusive left-turn phases forthe NS approach along Brookline Rd.AM PeakPM PeakDelay LOS Delay LOSOverall 23.4 C 53.2 DEastbound 16.0 B 32.5 CWestbound 39.9 D 56.4 DNorthbound 15.6 B 74.4 ESouthbound 22.9 C 19.3 BNorth Roundabout (#1) 10.0 B 20.2 CSouth Roundabout (#2) 8.2 B 47.5 ERoundabout 14.1 B 26.7 DOption A: Grade Separation /Option C: Two Roundabouts – no left turns*Option B. Signalized Intersection**: TwoEastbound Lanes, Two Westbound Lanesw/exclusive Left Turn LaneNorthboundright turnoutWestboundleft turn in20.4 C oversaturated F10.7 B 15.1 COverall 16.9 B 19.9 BEastbound 9.2 A 12.7 BWestbound 21.6 C 27.2 CNorthbound 21.2 C 21.0 CProposed 2-lane Roundabout 5.1 B 11.5 BNorthbound left turns made via roundaboutat State Farm approximately 3,500 feet tothe eastNorthboundright turnoutWestboundleft turn in27.9 D 29.0 D12.2 B 12.5 B*Assumes no road widening. Only 147 vehicles are expected to exit from Curtis Lumber, a portion of which willuse the proposed connection at Eastline Road. The remaining vehicles will operate at LOS A**Assumes road will be widened by at least 24' to accommodate signalizationWe also prepared the mitigation analysis without the presence of the major retail centers (Wal-Mart and Widewaters), the results of which are shown in Table 5.4. As can be seen, due to thelower volumes, the required mitigations would be reduced. In the case of Brookline Road and<strong>Route</strong> 50 intersection, the full build-out requires the addition of three new lanes (northbound,southbound and westbound), while without the shopping centers, the road only needs to bewidened by one lane (westbound). At V-Corners, due to increased volumes, major re-constructionwould be required at full buildout, but without the major retailers traffic delays only require the<strong>Route</strong> <strong>67</strong> <strong>Corridor</strong> <strong>Study</strong> 45
intersection to be widened by one lane (westbound) and the signal needs to be retimed. From thestandpoint of safety the roundabouts should be developed at V-Corners regardless of the shoppingcenter development. In addition, the intersection at Eastline Road would be able to handle trafficvolumes without the major retailers by adding two additional left-turn lanes (northbound andsouthbound) as well as retiming the signal. The intersection of Brookline and <strong>Route</strong> <strong>67</strong> would stilloperate at LOS F and a roundabout is recommended.Table 5.3 - Proposed Mitigation Measures and Resulting LOSwithout Major Retail CentersAM Peak PM PeakIntersection Proposed Mitigation Measures Delay LOS Delay LOSWiden Road to add exclusive left-turn lane for Overall 30.2 C 45.1 Dthe WB approach along Brookline Road.Eastbound 61.9 E 25.8 CDuring AM peak hr, provide a phase for WBRt. 50 &movement only by reducing the green time for Westbound 28.4 C 37.8 DBrookline Rdthe EW & NS phase by 4 sec each. During PMNorthbound 14.6 B 68.3 Epeak hr, shift 4 seconds of green time from EWphase to NS phase. Southbound 21.5 C 7.9 AV-CornersBrookline &Rt. <strong>67</strong>Rt. <strong>67</strong> &CurtisLumberEastline & Rt.<strong>67</strong>Add exclusive right-turn lane for the WBapproach along Rt <strong>67</strong>. Reduce green time forEW movement by 2 sec & for NS movement by4 sec and provide and add it to the SBmovement only phase.Additional lane added on Brookline Rd. Notpossible to improve LOS without signalizationor roundabout.Option A: Grade Separation /Option C: Two Roundabouts*Add exclusive left-turn lanes along the NB & SBapproach on Eastline Road. During AM peak,increase cycle length from 73 sec to 80 sec,provide WB movement only phase and add 3sec of green time for the EW phase. During PMpeak, increase cycle length to 97 sec, provideWB movement only phase and add 17 sec ofgreen time to EW movement.Overall 22.3 C 33.9 CEastbound 21.6 C 21.4 CWestbound 6.5 A 7.3 ANorthbound 25.8 C 63.3 ESouthbound 28.9 C 42.8 DEastbound Left 110.6 F 301.2 FEastbound Right 459.6 F 57.1 FNorthbound Left 12.2 B 13.2 BNorthboundright turn out18.3 C 85.3 FWestbound leftturn in10.3 B 12.6 BOverall 30.2 C 51.2 DEastbound 74.4 E 75.3 EWestbound 13.5 B 22.8 CNorthbound 33.4 C 65.4 ESouthbound 51.2 D 43.0 DRt. <strong>67</strong> &Ruhle RdNorthbound left turns out prohibitedNorthboundright or left turnoutWestbound leftturn in25.8 D 22.0 C11.8 B 11.1 B*Assumes no road widening. Only 147 vehicles are expected to exit from Curtis Lumber, a portion of which will use theproposed connection at Eastline Road. The remaining vehicles will operate at LOS A<strong>Route</strong> <strong>67</strong> <strong>Corridor</strong> <strong>Study</strong> 46
6. Parallel RoadOne method to improve the traffic flow in the area around V-Corners, where build volumesmay increase by nearly 70%, is the development of a parallel access road. The development ofa parallel access road was explored since the improvements proposed at V-Corners would onlyachieve a LOS E during the PM peak hour. This access road should be added to the officialmap for the Town. This road will serve to both improve traffic flow by providing an alternativeroadway, and also open up new areas for development, which will increase traffic demand inthis area.As seen in Figures 6.1 and 6.2, the northern portion of the access road would connect to theRossi Property. The building plans filed with the Town of Ballston show a loop road servingdevelopment sites within the Rossi property. The roadway within the Rossi property should beconnected to the parallel access road. The roadway would then travel south and would beparallel to <strong>Route</strong> <strong>67</strong>, avoiding the wetlands. The southern terminus would be the proposedroundabout at Brookline Road. The road would be approximately one mile in length, with aproposed speed limit of 35 MPH.We recommend a 60' right-of-way (ROW), which is the width proposed in the Rossi plan. Asshown in the cross-section (Figure 6.3), the roadway should be 41' curb to curb. The travellanes should be 11' wide, with a 4' shoulder which can accommodate cycling. A 5' sidewalkshould be present along the entire west side. The center median will serve as a location for aturning lane and will also serve as a pedestrian refuge in certain sections where we may have apedestrian or trail crossing. At the pedestrian/trail crossing locations the median lane could beraised possibly with landscaping that does not obstruct sight lines (either high-canopy trees orlow-level plantings).The parallel road would have a more commercial and service function as compared to <strong>Route</strong><strong>67</strong>. Traffic to the commercial uses east of <strong>Route</strong> <strong>67</strong> would be directed to the parallel road.Vehicles leaving the commercial uses located east of <strong>Route</strong> <strong>67</strong> could leave via <strong>Route</strong> <strong>67</strong> if theywill go northbound (right-turn only exits on <strong>Route</strong> <strong>67</strong>) or they could leave via the parallel road.It is expected that the current <strong>Route</strong> <strong>67</strong> would continue to function as the state route, but that itstraffic volumes would be reduced.7. Access Management Plan7.1. Goals of an access management planOne of the best ways to improve traffic flow along <strong>Route</strong> <strong>67</strong> would be by employing accessmanagement strategies, which aim to alleviate the inherent conflicts between the function ofthrough traffic of an arterial or state highway, and the local function of access to abuttingproperties. As traffic volumes increase along these types of roads, these conflicts become moreand more problematic in terms of congestion and accidents, and will eventually hamper theeconomic well being, as well as the quality of life along the corridor. Access managementattempts to group some of the turning movements in and out of properties, or shift them to sidestreets or service roads or to minimize the more problematic turns, i.e. the left turns. As shownin the figure below, left turns in and out of driveways are the main culprits for crashes.<strong>Route</strong> <strong>67</strong> <strong>Corridor</strong> <strong>Study</strong> 47
CHURCHBALLSTONSARATOGASTATEROUTE<strong>67</strong>Zim Smith TrailBROOKLINETIFFAULTFIGURE 6.1 SOUTHERN PORTION OF PARALLEL ROADROUTE <strong>67</strong> CORRIDOR STUDYFigure # 6.10 1000 feetJune 2005Source: National Wetlands InventoryNYDECNYS GIS Clearinghouse
FIGURE 6.3 CROSS SECTION OF PARALLEL ACCESS ROADROUTE <strong>67</strong> CORRIDOR STUDYAugust 2005
Figure 7.1 -Percentage of Driveway Crashes by Movement 10The basic goal is to improve traffic flow and safety along the arterial without reducing access.The elimination or discouragement of certain turns in and out driveways is often seen as areduction in accessibility. However, this potential reduction is generally offset by increasedaccessibility to the property from side streets or from adjacent properties. By facilitating trafficflow along <strong>Route</strong> <strong>67</strong> these actions will make it easier for the volume of vehicles to grow in thiscorridor, which will be beneficial in the long term and will increase property values. Accidentrates along arterials such as <strong>Route</strong> <strong>67</strong> are related to the density of driveways. Studies haveshown that for every ten additional access points per mile, there is an approximate 24%increase in the number of crashes 11 .It is important to understand that the municipality has a responsibility for access managementalong <strong>Route</strong> <strong>67</strong> even though it is a State Highway. The right of way is maintained by the State,and the property owners have to obtain a highway access permit from the State to build adriveway. However, the State has limited authority to control and manage access along a Statehighway, and the municipality maintains all land-use authority. The land-use authority of themunicipality offers the best regulatory means to manage access along an arterial. By preparingan access management program, the Town can work to minimize and possibly eliminate themost hazardous movements (left turns in and out) along the corridor.7.2. Access Management BenefitsStudies have shown that an effective access management program can reduce crashes by asmuch as 50%, increase roadway capacity by 23% to 45%, and reduce travel time and delay asmuch as 40% to 60%. Among the many benefits of a managed roadway are increased publicsafety, reduction of congestion, extended life of the roadway and improved appearance of thebuilt environment. Access management also serves to preserve the transportation functions ofroadways as well as the long-term property values and the economic viability of abutting10Access Management Manual, <strong>Transportation</strong> Research Board, Washington, D.C. 2003, pg 1011Access Management Manual, <strong>Transportation</strong> Research Board, Washington, D.C. 2003, pg 16<strong>Route</strong> <strong>67</strong> <strong>Corridor</strong> <strong>Study</strong> 51
development. A further benefit is the ability to concentrate commercial activity in a smaller area,which is less damaging to landscapes and the environment.Access management strategies have beneficial impacts on pedestrian circulation because theyencourage more walking between adjacent properties (by providing connections) and bymaking walking more pleasant along sidewalks, due to reduced numbers of driveways andvehicular turns. Aesthetics are generally also improved by access management plans.BFJ recommends the installation of four roundabouts in the study area. Roundabouts havebeen found to reduce vehicle delays, increase capacity of the intersection, improve safety, andimprove aesthetics. A recent nation-wide study of roundabout safety, comparing before andafter crashes for various roundabout installations, has shown that roundabouts reduce totalcrashes by 47% and injury crashes by 72%. This study included 5 roundabouts that replacedtraffic lights. This group of conversions showed a 37% reduction in total crashes and a 75%reduction in injury crashes 12 . Safety statistics from Europe have shown also that single-laneroundabouts are significantly safer for pedestrians than other types of intersections. In addition,roundabouts are excellent in allowing U-turns, which permit drivers to minimize hazardous leftturns. They are, therefore, an ideal access management tool. Roundabouts also serve as atraffic calming device, acting as a gateway to the commercial corridors for the Towns forBallston and Malta.7.3. Access Management PlanThe principles of access management should be considered whenever a property owner appliesfor development or redevelopment. It is recommended that all commercial parcels along <strong>Route</strong><strong>67</strong> be required to connect to the adjacent commercial parcels. The goal is to develop acontinuous connection system, equivalent to a service road that can be used for trafficcirculating from parcel to parcel.It is recognized that it will take the cooperation of both property owners to implement theconnections between two parcels, and that at the time of the application by one owner it maynot be possible to gain approval from the abutting owner. In this case the applicant should berequired to provide an easement for future connection. The location of the easement should becoordinated with the adjacent property owner. The connection will then be required if andwhen the abutting owner applies for a change on his parcel.As the area is expected to develop rapidly over the next decade, there is a significantopportunity to develop the corridor in a manner that complies with access managementprinciples. Separate pedestrian connections should be provided between adjacent commerciallots. This will permit a patron to walk from one commercial property to another, reducing thenumber of vehicle trips. These connected parking lots provide the added benefit of 'sharedparking', which generally can reduce the amount of required parking in each separate parkinglot. At the current time, there are few instances were commercial properties abut, offering thepotential to design the community with access management principles in mind.The proposed parallel access road is in compliance with access management principles. Forthe property owners, the roadway represents an opportunity for higher density development for12Toolbox on Intersection Safety and Design (Chapter 8), Institute of <strong>Transportation</strong> Engineers and FederalHighway Administration, September 2004<strong>Route</strong> <strong>67</strong> <strong>Corridor</strong> <strong>Study</strong> 52
the properties located between <strong>Route</strong> <strong>67</strong> and the parallel access road, and also between theparallel access road and the railroad tracks. In exchange for being permitted to construct at ahigher density, the community benefits by requiring these properties to meet accessmanagement requirements. Specific requirements include: 1) All properties/parking lots mustinterconnect; 2) All properties with frontage along <strong>Route</strong> <strong>67</strong> must only permit right turns in andright turns out, left turns will be prohibited along <strong>Route</strong> <strong>67</strong>. This also applies to the propertieson either side of V-Corners, as all turns must be right turns in and out. Anyone wishing tomake a left turn will be required to make right turn followed by a U-turn at the proposedroundabouts. Left turns will be allowed along the parallel road.As mentioned earlier the Curtis Lumber yard and the Curtis Industrial Park should provide aninternal road network that is also connected to Eastline Road. Developing a redundant roadnetwork will improve safety, reliability and capacity of <strong>Route</strong> <strong>67</strong>.The other main opportunity along the corridor is the prohibition of cul-de-sac styledevelopments with the sole connection to <strong>Route</strong> <strong>67</strong>. These cul-de-sac developments should allbe required to interconnect (or to provide the right-of-way or easement for future connections)so that more flexible road networks are created.8. Bicycle / Pedestrian Circulation PlanBy installing single-lane roundabouts, rather than signalizing intersections, the <strong>Route</strong> <strong>67</strong><strong>Corridor</strong> will be able to maintain largely its current two-lane profile and provide a morepedestrian friendly atmosphere. The area surrounding V-Corners would be best served if it isdeveloped with retail frontage along <strong>Route</strong> <strong>67</strong> between the two roundabouts. The parking forthese stores should be provided in the rear of the lot, with access via the parallel access road.By placing the parking in the rear of the lots, drivers will be encouraged to make use of theparallel road. The roundabouts will reduce travel speeds along this portion of <strong>Route</strong> <strong>67</strong> to amaximum of 30 MPH in the V-Corners area, which will create a more bicycle-friendly area.Speed is the most dangerous factor in collisions, therefore lower speeds will result in less severecollisions. To improve bicycle opportunities along <strong>Route</strong> <strong>67</strong> consistent shoulders should beprovided with a width of at least 5 feet. At the current time the shoulders in the corridor rangebetween 3 to 4 1/2 feet. To offer the maximum flexibility and opportunities to bicyclists both<strong>Route</strong> <strong>67</strong> and the parallel access road should be designed for bicycles.As the Zim Smith Trail provides an excellent off-street pathway from just outside the Village ofBallston Spa to the Town of Halfmoon, efforts should be made to integrate it with the on-streetnetwork. Specifically, east-west connections between the Zim Smith Trail and the section of<strong>Route</strong> <strong>67</strong> to the south of V-Corners should be developed. At a minimum east-west accessshould connect Zim Smith with Brookline Road, V-Corners and the High School (See Figure 8.1).East-west connections will provide the opportunity for greater access to the commercial centerand Ballston School. Another excellent location for an east-west connection is the existingschool bus depot. All east-west connections which connect to the Zim Smith Trail need to crossthe active rail line and therefore be coordinated with the railroad. In addition, the sewer lineright-of-way should also be investigated for an east-west connection between <strong>Route</strong> <strong>67</strong> and theZim Smith Trail.The Zim Smith Trail, near the intersection with <strong>Route</strong> <strong>67</strong> is located at the crossroads of fourmajor greenway systems the Ballston Lake / Alplaus Kill north-south greenway the Mourning Kill<strong>Route</strong> <strong>67</strong> <strong>Corridor</strong> <strong>Study</strong> 53
Kayaderosseras north-south greenway and east-west corridors. Effort should be made tomaintain greenway linkages through the area. A linked trail corridor will attract more users, asit will provide embarkation points and destinations in multiple towns and villages. To establisha trail loop linking Schenectady with Saratoga Springs, right-of-way is required to beestablished through the industrially zoned area in and around Curtis Lumber. An easementshould be provided through this area which would improve pedestrian and cycling access forthe region.In conjunction with the access management strategies mentioned above, the municipalitiesshould also require that developers build pedestrian connections between adjacent commercialsites as well as sidewalks adjacent to the street. These connections could occur via sidewalksadjacent to the roadway, as long as the building entrances are close to the sidewalks, or theycould be located further back from the roadway. Other pedestrian-friendly actions includepark-and-walk strategies in the more central area of the corridor, particularly the V-Corners.Park-and-walk strategies would imply allowing off-site parking and shared parking. Sharedparking allows two different uses with different parking pattern and peaks to share someparking spaces in common. For instance, an office building and a retail facility or a movietheatre have different peaks and can share some of their parking supply, thereby reducing theoverall number of spaces required and encouraging more walking. Manchester Center, asuccessful retail outlet village in Southwestern Vermont has adopted this concept. The privateparking areas at the edge of the commercial center have park-and-walk signs inviting shoppersto park in the private lot and walk to their destination. These parking strategies move awayfrom the typical suburban model where each use has its own independent parking and makethe area more attractive and pedestrian friendly. The applicant needs to demonstrate thatshared parking is feasible by following the calculation methodologies suggested by the UrbanLand Institute or the Institute of <strong>Transportation</strong> Engineers.<strong>Route</strong> <strong>67</strong> <strong>Corridor</strong> <strong>Study</strong> 54
BALLSTON AVE TIFFAULT RDFollow Property LineCHURCH AVEFollow Property LineSARATOGA RDUse Bus DepotZim Smith TrailSTATE ROUTE <strong>67</strong>TOMASELLI CTFollow Existing TrailZim Smith TrailBROOKLINE RDUNDERPASS RDFIGURE 8.1 PROPOSED CONNECTIONS TO ZIM SMITH TRAILROUTE <strong>67</strong> CORRIDOR STUDY500 feetJune 2005Source: NYS GIS Clearinghouse
Figure 8.2 - Park and Walk SignIThe large commercial establishments should also be required to provide bicycle parking inaddition to the standard automobile parking. A suggested standard may be 3 bicycle parkingspots for every 100 car spots. The bicycle spots should be located at the most convenientplaces on site. During the winter time the bicycle parking spaces can be used for snow storage.<strong>Route</strong> <strong>67</strong> <strong>Corridor</strong> <strong>Study</strong> 56
9. Implementing the Improvements9.1. . Matrix of ImprovementsTable 9.1 shows all of the proposed improvements for the <strong>Route</strong> <strong>67</strong> <strong>Corridor</strong>, together withorder-of-magnitude cost estimates for each improvement. These estimates are 'ballpark' figureswhich will require detailed engineering analysis to develop more precise estimates. The tablealso mentions the most logical funding source for each improvement, as well as their linkage tospecific developments and their priority.Short-term projects are those scheduled for the next two to three years, mid-term for the nextthree to five years and long-term for the years six and beyond. The phasing will depend on thestrength of the local economy and the related development pressure and also on the availabilityof funding at the state and federal levels.In terms of implementation responsibility there are three basic categories of projects:1) TIP or State Funded, 2) front door improvements and 3) major off-site mitigation projects, i.e.the parallel service road.TIP or State Funded are defined as being on State highways, being affected significantly by ahigh proportion of through traffic and not located at the front doors of major developments.These projects include the improvements of Brookline Road/Rte 50 intersection, the BrooklineRoad/Rte <strong>67</strong> intersection and the Rte <strong>67</strong>/Eastline Road intersection and the provision ofconsistent five foot shoulders along Rte <strong>67</strong>. These are all projects that could not easily beassigned to any other party. Identified projects could be submitted to CDTC by NYSDOT or themunicipality as candidates for inclusion in the <strong>Transportation</strong> Improvement Program (TIP). Theyare also of a scale that could be considered by NYSDOT for state funding.Front door improvements are those projects that are required to provide access to major newdevelopments. The two roundabouts proposed at V-Corners can be funded by thedevelopment that may occur at the abutting properties. These improvements include theroundabouts as well as the connections between the two roundabouts. The owners of thosedevelopment parcels should be made aware of these improvements so that they can beincorporated into their plans. The other front-door improvement is related to any futurechanges in the Curtis Lumber yard or industrial park. Improving access to and from (especiallythe left-turns out of) the lumber yard becomes critical as traffic volumes along <strong>Route</strong> <strong>67</strong> and thelumber yard traffic increase.Several options are proposed for access to the lumber yard and to the connected industrial yard.One is related to the current proposal to rebuild and lower the overpass over the abandonedrail tracks. The overpass is proposed to be replaced with a culvert large enough to permitpedestrians and bicyclists to pass. The first option (A) involves rebuilding the overpass at aheight and width that would allow truck traffic underneath (14-foot vertical clearance instead ofthe current 24-foot clearance). The cost estimate indicated for this project (item #7) in Table9.1 reflects only the estimate for the incremental costs beyond the costs of the plan that iscurrently under consideration. All three options for this improvement could become a sharedresponsibility among NYSDOT and Curtis Lumber/Industrial Yard.<strong>Route</strong> <strong>67</strong> <strong>Corridor</strong> <strong>Study</strong> 57
Table 9.1 - Matrix of Improvement Projects# Location Project12<strong>Route</strong> 50 and Brookline RoadIntersectionWiden intersection, adding left-turn lanes for thenorthbound, southbound and westboundhV-Corners Southern Roundabout - provides access toundeveloped land to the west and for through trafficOrder ofMagnitudeCost EstimateFunding Source DevelopmentLinkagePhasing$150,000 TIP or State Various mid-term$400,000 TIP, State or propertydeveloper to the westAdjacent property tothe westshort-term3V-Corners Northern Roundabout -provides access forundeveloped land to the east and for through traffic$400,000 TIP, State or propertydeveloper to the eastAdjacent property tothe eastshort-term456V-Corners Cross Road linking Roundabouts $300,000 TIP, State or propertydeveloper to the eastand westV-Corners Area Build a sidewalk network for commercial core $100,000 TIP or State/CDTC/AdjacentDevelopers/ OthersEast of <strong>Route</strong> <strong>67</strong> BetweenBrookline Road and V-CornersDevelopment of a parallel access/service Road,including sidewalk$4,000,000 Property developers ofadjacent propertyAdjacent development short-termAdjacent development short-termProperty developers ofadjacent propertieslong-termEast of <strong>Route</strong> <strong>67</strong> Between Zim Smith Trail East-West Connections $200,000 TIP or State/None mid-term7 Brookline Road and V-CornersCDTC/AdjacentDevelopers/ Others8 Brookline Road / <strong>Route</strong> <strong>67</strong> Install Roundabout $300,000 TIP or State None short-term9Rebuild overpass mid-termCurtis Lumber Option A - Grade Separation - build roadwayunderneath <strong>Route</strong> <strong>67</strong> overpass$750,000 TIP or State/ CurtisLumber11 Curtis Lumber Add new exit at the eastern end of the property $100,000 Curtis Lumber Curtis Lumber mid-term$500,000 TIP or State / Curtis Curtis Lumber mid-term12Lumber13Curtis Lumber Option B - Install traffic signal, widen roadway, neweastbound lane, exclusive left turn lane toaccommodate signal.Curtis Lumber Build an internal access road that connects withEastline Road$200,000 Curtis Lumber Curtis Lumber short-term14 Eastline Road / <strong>Route</strong> <strong>67</strong> Install Roundabout $400,000 TIP or State None mid-term15Prohibit northbound left turns - Install Sign Town of Malta mid-termRhule Road and <strong>Route</strong> <strong>67</strong>intersection16 <strong>Corridor</strong> WideWiden Shoulder to a width of 5 feet to accommodatecycling$500,000 TIP or State None short-termShort Term - One to Five Years, Mid-Term - Five to Ten Years, Long Term - Beyond Ten YearsOrder of Magnitude Cost - Rough estimates that will require detailed engineering analysis for more precise estimates.TIP - <strong>Transportation</strong> Improvement ProgramNote: Above Estimates do not include Right-Of-Way costs<strong>Route</strong> <strong>67</strong> <strong>Corridor</strong> <strong>Study</strong> BFJ Planning
The Parallel Service Road that is proposed east of <strong>Route</strong> <strong>67</strong> involves several participants andcontributors. The first group includes the larger traffic generators that need this improvementso that the increased traffic flows can be accommodated in the north-south corridor. These arethe Wal-Mart and the Widewaters retail projects or the replacement projects proposed on thesesites. Other developments may also be included in this group. The second group consists ofthe land-owners that would benefit from the improved accessibility provided by the new road.A SEQRA-based contribution mechanism is proposed. All new projects in the <strong>Route</strong> <strong>67</strong>/<strong>Route</strong>50 corridor between the Village border in the north and Brookline Road in the south should berequired to estimate their traffic generation and traffic impacts as part of their applicationprocess and pursuant to State Environmental Quality Review requirements. A contributionmechanism should be developed whereby each commercial project will mitigate its trafficimpacts by contributing towards the costs of the parallel road in proportion to the amount oftraffic generated during the afternoon peak hour. Those developers that will provide the rightof-wayfor sections of the parallel road would be credited for the value of the right-of-way. TheTown would set up a corridor improvement fund that would be the recipient of the mitigationcontributions by the developers. The Town may advance funds to the corridor improvementfund to implement this new road at a reasonable pace even if the development slows down. Ifthe funds are not spent within a certain number of years on the corridor improvements, thecontributions would revert back to the developers.Another similar method is CDTC's capacity based approach to public/private financing policywhich is documented in "Procedures for Public/Private Highway Financing in the <strong>Capital</strong><strong>District</strong>" 13 . This approach requires each developer to pay a fair share of the cost towardsimprovements when their project necessitates capacity upgrades. This method has beensuccessfully implemented in the Town of Colonie.The next step in this process would be a more detailed design of the parallel road and a costestimation, including the right-of-way costs. A mitigation contribution per pm vehicle trip canthen be calculated. The Town can then use that mechanism to fund the needed improvement.The critical elements for this process will be that the mitigation contribution is in proportion toeach project's impacts, that all beneficiaries contribute (either funds or right-of-way) and that allcontributors benefit from the improvement. Front-door improvements will not count in thismechanism.9.2. - Implementing Town Regulatory ChangesIndependent of any zoning changes that the Towns may consider in terms of uses and densities,the Towns (both Ballston and Malta) should consider requiring access management strategiesas part of their zoning regulations. The regulations may refer to this study as well as to theTown of Malta's linkage study. The municipalities should consider the following actions for allproperties along <strong>Route</strong> <strong>67</strong> and 50:• Any subdivision plan must include side streets connecting to the State highway, and nodriveways are allowed onto the State highways. The side streets (collectors) must connect asmuch as possible to other local streets to form a road network that allows flexibility anddistributes the traffic loads over several roads. If no connection can be achieved in theshort term, the applicant must provide easements for future connections.13Procedures for Public/Private Highway Financing in the <strong>Capital</strong> <strong>District</strong>, <strong>Capital</strong> <strong>District</strong> <strong>Transportation</strong><strong>Committee</strong>, September 21, 1989<strong>Route</strong> <strong>67</strong> <strong>Corridor</strong> <strong>Study</strong> 59
• All commercial properties along <strong>Route</strong> <strong>67</strong> and 50 must provide a vehicular connection toadjacent properties to allow vehicles to drive from one to the other without driving onto theState highway. If no connection can be provided in the short term, the applicant mustprovide an easement for a future connection. When the neighboring property owner comesto the Town for a site plan approval or building approval, the Town can then require theconnection. These interconnections may eventually lead to the equivalent of a service roadbetween the commercial properties.• Property owners along <strong>Route</strong> <strong>67</strong> and 50 should be encouraged to combine and share theirdriveways.• All driveways along <strong>Route</strong> <strong>67</strong> require a special permit and are allowed on a temporarybasis only. If and when an alternate access can be found in the future the driveway wouldthen be discontinued.The above actions seem restrictive, however, they are required in the long term to maintain a safeand efficient highway. The access limitation off <strong>Route</strong> <strong>67</strong> will be more than offset by the accessimprovements from side streets and from adjacent properties. Businesses will benefit from theconnections to adjacent properties, since a person in the adjacent property is more likely topatronize the business than the drivers on <strong>Route</strong> <strong>67</strong>. Property owners along similar state highwayswith higher traffic volumes have learned that there is no other alternative to manage traffic alongthese arterials, and that eventually the left turns become very difficult anyway.The access management plan along <strong>Route</strong> <strong>67</strong> does not require any municipal intervention in theshort term, other than adopting the above policies and regulations. It is a long-term action planrequiring diligence and attention on the part of the Planning Boards. Access management getsimplemented gradually as new development applications come in front of the Planning Boards.The regulations should also mention that off-site and shared parking is allowed, but applicantshave to obtain the approval by the Town Planning Board. The regulations should mention that theapplicant has to submit shared-parking calculations to the Planning Board so that the Board canreview the calculations.<strong>Route</strong> <strong>67</strong> <strong>Corridor</strong> <strong>Study</strong> 60
Appendix A – Speed Delay Run Summary<strong>Route</strong> <strong>67</strong> <strong>Corridor</strong> <strong>Study</strong> 61
CDTC Speed Delay Run Summary<strong>Route</strong> <strong>67</strong> from I-87 SB Ramps to Saratoga Rd (<strong>Route</strong> 50)AM COUNT18-May-05EastboundAverage Average Total 18-May-05 WestboundStarting Overall Running Stopped Average Average TotalTime Speed Speed Delay* Starting Overall Running StoppedTime Speed Speed Delay*7:21-7:28 30 36 68 7:14-7:20 33 40 607:29-7:35 33 41 707:36-7:42 33 39 62 7:44-7:50 36 39 317:50-7:56 34 40 49Average 32 38 60 Average 34 40 54* 49 of the total stopped delay occurred at * 54 of the total stopped delay occurred at<strong>Route</strong> <strong>67</strong> <strong>Route</strong> <strong>67</strong>PM COUNT17-May-05 Eastbound 17-May-05 WestboundAverage Average Total Average Average TotalStarting Overall Running Stopped Starting Overall Running StoppedTime Speed Speed Delay Time Speed Speed Delay4:42-4:48 31 35 54 4:34-4:40 24 34 245:00-5:05 38 40 14 4:53-4:58 39 39 05:14-5:21 29 37 80 5:06-5:13 30 37 <strong>67</strong>5:34-5:40 35 38 20 5:26-5:33 30 38 865:49-5:56 28 37 100 5:42-5:48 35 39 39Average 32 37 54 Average 32 37 43* 54 of the total stopped delay occurred at * 43 of the total stopped delay occurred at<strong>Route</strong> <strong>67</strong> <strong>Route</strong> <strong>67</strong>
Appendix B – Detailed Traffic Forecasts<strong>Route</strong> <strong>67</strong> <strong>Corridor</strong> <strong>Study</strong> 63
2345<strong>67</strong>9101112131415161718202123DevelopmentWal-MartAdirondackTrust CoToscanaMobile HomeParkYarlin Ozbay -Gas StationRolling BrookMeadowsBrooklineCondoDevelopEast LineSubdivisionBeacon HillDunkinDonutsSSP/TechPark Phase IVAztech TechSKS Bottling& Office/WarehouseWidewatersLuther Forest(Phase I)Luther ForestCondosTraversMeadowsKelch AptsMalta FarmResidential22 Park PlaceBlessed JohnCemeteryAM PM AM PM AM PM AM PM AM PM AM PM AM PM AM PM AM PM AM PM AM PM AM PM AM PM AM PM2004 Volume 19 11 375 264 10 32 141 113 63 221 10 25 9 26 220 394 95 145 32 27 226 110 26 8 1227 13772010 Volume (1.5%)* 20 13 410 289 11 35 155 124 69 241 11 27 10 28 240 431 104 158 35 30 247 121 28 9 1341 1506Inbound % 10% 10%Outbound % 10% 10%Inbound 0 0 0 0 0 0 0 0 0 0 0 0 0 0 0 0 0 0 0 0 0 0 0 0 0 0 0 0Outbound 0 0 0 0 0 0 0 0 0 0 0 0 0 0 0 0 0 0 0 0 0 0 0 0 0 0 0 0Inbound % 10% 10%Outbound % 10% 10%Inbound 10 34 0 0 0 0 0 0 0 0 0 0 0 0 0 0 1 3 0 0 0 0 0 0 0 0 1 3Outbound 7 34 0 0 1 3 0 0 0 0 0 0 0 0 0 0 0 0 0 0 0 0 0 0 0 0 1 3Inbound % 30% 30%Outbound % 30% 30%Inbound 3 7 0 0 0 0 0 0 0 0 0 0 0 0 0 0 1 2 0 0 0 0 0 0 0 0 1 2Outbound 12 4 0 0 4 1 0 0 0 0 0 0 0 0 0 0 0 0 0 0 0 0 0 0 0 0 4 1Inbound % 10% 10% 20% 20%Outbound % 20% 20% 10% 10%Inbound 14 18 0 0 0 0 0 0 0 0 1 2 3 4 0 0 0 0 0 0 0 0 0 0 0 0 4 5Outbound 14 18 3 4 1 2 0 0 0 0 0 0 0 0 0 0 0 0 0 0 0 0 0 0 0 0 4 5Inbound % 10% 10% 30% 30%Outbound % 30% 30% 10% 10%Inbound 3 10 0 1 0 0 0 0 0 0 0 0 0 0 0 0 0 0 1 3 0 0 0 0 0 0 1 4Outbound 9 6 0 0 0 0 0 0 3 2 0 0 1 1 0 0 0 0 0 0 0 0 0 0 0 0 3 2Inbound % 10% 10% 30% 30%Outbound % 30% 30% 10% 10%Inbound 4 19 0 2 0 0 0 0 0 0 0 0 0 0 0 0 0 0 1 6 0 0 0 0 0 0 2 7Outbound 20 9 0 0 0 0 0 0 6 3 0 0 2 1 0 0 0 0 0 0 0 0 0 0 0 0 8 4Inbound % 2% 2%Outbound % 2% 2%Inbound 20 69 0 0 0 0 0 0 0 0 0 0 0 0 0 0 0 0 0 1 0 0 0 0 0 0 0 1Outbound 61 41 0 0 0 0 0 0 1 1 0 0 0 0 0 0 0 0 0 0 0 0 0 0 0 0 1 1Inbound % 10% 10% 60% 60%Outbound % 10% 10% 60% 60%Inbound 16 60 0 0 2 6 0 0 10 36 0 0 0 0 0 0 0 0 0 0 0 0 0 0 0 0 11 42Outbound 54 34 0 0 0 0 0 0 0 0 0 0 0 0 0 0 5 3 33 20 0 0 0 0 0 0 38 24Inbound % 10% 10%Outbound % 10% 10%Inbound 62 18 0 0 0 0 0 0 0 0 0 0 0 0 0 0 6 2 0 0 0 0 0 0 0 0 6 2Outbound 48 23 0 0 5 2 0 0 0 0 0 0 0 0 0 0 0 0 0 0 0 0 0 0 0 0 5 2Inbound % 35% 35% 30% 30% 10% 10%Outbound % 10% 10% 35% 35% 30% 30%Inbound 223 58 0 0 78 20 0 0 <strong>67</strong> 17 0 0 0 0 0 0 0 0 0 0 0 0 0 0 22 6 1<strong>67</strong> 43Outbound 50 215 0 0 0 0 0 0 0 0 0 0 0 0 5 22 17 75 15 65 0 0 0 0 0 0 37 161Inbound % 35% 35% 30% 30% 10% 10%Outbound % 10% 10% 35% 35% 30% 30%Inbound 46 10 0 0 16 3 0 0 14 3 0 0 0 0 0 0 0 0 0 0 0 0 0 0 5 1 34 7Outbound 7 47 0 0 0 0 0 0 0 0 0 0 0 0 1 5 3 16 2 14 0 0 0 0 0 0 5 35Inbound % 35% 35% 30% 30% 10% 10%Outbound % 10% 10% 35% 35% 30% 30%Inbound 74 14 0 0 26 5 0 0 22 4 0 0 0 0 0 0 0 0 0 0 0 0 0 0 7 1 55 10Outbound 9 80 0 0 0 0 0 0 0 0 0 0 0 0 1 8 3 28 3 24 0 0 0 0 0 0 7 60Inbound % 10% 10% 20% 20%Outbound % 20% 20% 10% 10%Inbound 0 0 0 0 0 0 0 0 0 0 0 0 0 0 0 0 0 0 0 0 0 0 0 0 0 0 0 0Outbound 0 0 0 0 0 0 0 0 0 0 0 0 0 0 0 0 0 0 0 0 0 0 0 0 0 0 0 0Inbound % 1% 1%Outbound % 1% 1%Inbound 900 225 0 0 0 0 0 0 0 0 0 0 0 0 0 0 0 0 9 2 0 0 0 0 0 0 9 2Outbound 180 900 0 0 0 0 0 0 2 9 0 0 0 0 0 0 0 0 0 0 0 0 0 0 0 0 2 9Inbound % 1% 1%Outbound % 1% 1%Inbound 9 45 0 0 0 0 0 0 0 0 0 0 0 0 0 0 0 0 0 0 0 0 0 0 0 0 0 0Outbound 48 22 0 0 0 0 0 0 0 0 0 0 0 0 0 0 0 0 0 0 0 0 0 0 0 0 0 0Inbound % 1% 1%Outbound % 1% 1%Inbound 26 90 0 0 0 0 0 0 0 0 0 0 0 0 0 0 0 0 0 1 0 0 0 0 0 0 0 1Outbound 82 52 0 0 0 0 0 0 1 1 0 0 0 0 0 0 0 0 0 0 0 0 0 0 0 0 1 1Inbound % 1% 1%Outbound % 1% 1%Inbound 12 51 0 0 0 0 0 0 0 0 0 0 0 0 0 0 0 0 0 1 0 0 0 0 0 0 0 1Outbound 48 27 0 0 0 0 0 0 0 0 0 0 0 0 0 0 0 0 0 0 0 0 0 0 0 0 0 0Inbound % 5% 5%Outbound % 5% 5%Inbound 4 18 0 0 0 0 0 0 0 0 0 0 0 0 0 0 0 0 0 1 0 0 0 0 0 0 0 1Outbound 20 9 0 0 0 0 0 0 1 0 0 0 0 0 0 0 0 0 0 0 0 0 0 0 0 0 1 0Inbound % 1% 1%Outbound % 1% 1%Inbound 169 298 0 0 0 0 0 0 0 0 0 0 0 0 0 0 0 0 2 3 0 0 0 0 0 0 2 3Outbound 158 339 0 0 0 0 0 0 2 3 0 0 0 0 0 0 0 0 0 0 0 0 0 0 0 0 2 3Inbound % 5% 5%Outbound % 5% 5%Inbound 12 28 0 0 0 0 0 0 0 0 0 0 0 0 0 0 0 0 1 1 0 0 0 0 0 0 1 1Outbound 5 56 0 0 0 0 0 0 0 3 0 0 0 0 0 0 0 0 0 0 0 0 0 0 0 0 0 32010 Build Volume% Increase over 2010No BuildNet TrafficGeneration<strong>Route</strong> 50 & Brookline RoadRt. 50Brookline RoadRt. 50Brookline RoadFrom NorthFrom EastFrom SouthFrom WestLeft Thru Right Left Thru Right Left Thru Right Left Thru RightRt. 50 &Brookline24 19 543 332 11 35 286 208 71 243 18 33 17 63 278 563 172 302 35 30 247 121 63 18 1757 196017% 52% 33% 15% 0% 0% 85% 68% 2% 1% 54% 21% <strong>67</strong>% 121% 16% 31% 66% 91% 0% 0% 0% 0% 122% 92% 31% 30%*CDTC Estimates 0.5% background growth - 1.5% is a conservative estimate- 1 -
2345<strong>67</strong>9101112131415161718202123DevelopmentWal-MartAdirondackTrust CoToscanaMobile HomeParkYarlin Ozbay -Gas StationRolling BrookMeadowsBrooklineCondoDevelopEast LineSubdivisionBeacon HillDunkinDonutsSSP/TechPark Phase IVAztech TechSKS Bottling& Office/WarehouseWidewatersLuther Forest(Phase I)Luther ForestCondosTraversMeadowsKelch AptsMalta FarmResidential22 Park PlaceBlessed JohnCemeteryNet TrafficGeneration Left Thru Right Left Thru Right Left Thru Right Left Thru Right V-CornersAM PM AM PM AM PM AM PM AM PM AM PM AM PM AM PM AM PM AM PM AM PM AM PM AM PM AM PM2004 Volume 341 299 304 330 10 7 6 15 106 214 193 411 45 51 229 401 12 0 13 1 114 120 32 49 1405 18982010 Volume (1.5%)* 373 327 332 361 11 8 7 16 116 234 211 449 49 56 250 438 13 0 14 1 125 131 35 54 1536 2075Inbound %Outbound %30% 30% 10% 10% 15% 15%30% 30% 10% 10% 15% 15%Inbound 0 0 0 0 0 0 0 0 0 0 0 0 0 0 0 0 0 0 0 0 0 0 0 0 0 0 0 0Outbound 0 0 0 0 0 0 0 0 0 0 0 0 0 0 0 0 0 0 0 0 0 0 0 0 0 0 0 0Inbound %30% 30% 10% 10% 15% 15%Outbound %Inbound 10 3430%030%010%010%015%015%0 0 0 0 0 3 10 0 0 1 3 0 0 2 5 0 0 0 0 6 19Outbound 7 34 2 10 1 3 1 5 0 0 0 0 0 0 0 0 0 0 0 0 0 0 0 0 0 0 4 19Inbound %Outbound %Inbound 3 760%060%030%030%0 0 0 0 0 0 060%260%4 0 030%130%2 0 0 0 0 0 0 0 0 3 6Outbound 12 4 7 3 4 1 0 0 0 0 0 0 0 0 0 0 0 0 0 0 0 0 0 0 0 0 11 4Inbound %45% 45% 10% 10% 15% 15%Outbound %15% 15% 45% 45% 10% 10%Inbound 14 18 0 0 6 8 0 0 1 2 0 0 0 0 0 0 0 0 0 0 0 0 2 3 0 0 9 13Outbound 14 18 0 0 0 0 0 0 0 0 0 0 0 0 2 3 6 8 1 2 0 0 0 0 0 0 9 13Inbound %Outbound %Inbound 3 10 0 08%08%1 0 0 0 0 0 0 0 03%03%08%08%0 0 0 0 0 0 03%03%0 0 1Outbound 9 6 0 0 0 0 0 0 0 0 0 0 0 0 0 0 1 0 0 0 0 0 0 0 0 0 1 1Inbound %Outbound %Inbound 4 19 0 08%08%1 0 0 0 0 0 0 0 03%03%08%08%0 0 0 0 0 0 03%03%0 0 2Outbound 20 9 0 0 0 0 0 0 0 0 0 0 0 0 1 0 2 1 0 0 0 0 0 0 0 0 2 1Inbound %Outbound %Inbound 20 696%16%4 0 0 0 0 0 02%02%06%06%0 0 0 0 0 0 0 0 02%02%1 0 0 2 6Outbound 61 41 0 0 0 0 0 0 0 0 1 1 4 2 0 0 0 0 0 0 0 0 0 0 0 0 5 3Inbound %Outbound %Inbound 16 60 0 08%18%4 0 0 0 0 0 0 0 03%03%08%08%0 0 0 0 0 0 03%03%1 2 6Outbound 54 34 0 0 0 0 0 0 0 0 0 0 0 0 1 1 4 3 0 0 0 0 0 0 0 0 5 3Inbound %Outbound %Inbound 62 1830%030%010%010%015%015%0 0 0 0 030%1930%5 0 010%610%2 0 015%915%3 0 0 0 0 34 10Outbound 48 23 14 7 5 2 7 3 0 0 0 0 0 0 0 0 0 0 0 0 0 0 0 0 0 0 26 13Inbound %Outbound %Inbound 223 58 0 025%5625%14 0 0 0 0 0 0 0 010%010%025%025%0 0 0 0 0 0 010%2210%6 78 20Outbound 50 215 0 0 0 0 0 0 0 0 0 0 0 0 5 22 12 54 0 0 0 0 0 0 0 0 17 75Inbound %Outbound %Inbound 46 10 0 025%1125%2 0 0 0 0 0 0 0 010%010%025%025%0 0 0 0 0 0 010%510%1 16 3Outbound 7 47 0 0 0 0 0 0 0 0 0 0 0 0 1 5 2 12 0 0 0 0 0 0 0 0 3 16Inbound %Outbound %Inbound 74 14 0 025%1825%3 0 0 0 0 0 0 0 010%010%025%025%0 0 0 0 0 0 010%710%1 26 5Outbound 9 80 0 0 0 0 0 0 0 0 0 0 0 0 1 8 2 20 0 0 0 0 0 0 0 0 3 28Inbound %45% 45% 10% 10% 15% 15%Outbound %15% 15% 45% 45% 10% 10%Inbound 0 0 0 0 0 0 0 0 0 0 0 0 0 0 0 0 0 0 0 0 0 0 0 0 0 0 0 0Outbound 0 0 0 0 0 0 0 0 0 0 0 0 0 0 0 0 0 0 0 0 0 0 0 0 0 0 0 0Inbound %Outbound %Inbound 900 2256%546%14 0 0 0 0 0 02%02%06%06%0 0 0 0 0 0 0 0 02%182%5 0 0 72 18Outbound 180 900 0 0 0 0 0 0 0 0 4 18 11 54 0 0 0 0 0 0 0 0 0 0 0 0 14 72Inbound %Outbound %Inbound 9 456%16%3 0 0 0 0 0 02%02%06%06%0 0 0 0 0 0 0 0 02%02%1 0 0 1 4Outbound 48 22 0 0 0 0 0 0 0 0 1 0 3 1 0 0 0 0 0 0 0 0 0 0 0 0 4 2Inbound %Outbound %Inbound 26 907%27%6 0 0 0 0 0 02%02%07%07%0 0 0 0 0 0 0 0 02%12%2 0 0 2 8Outbound 82 52 0 0 0 0 0 0 0 0 2 1 6 4 0 0 0 0 0 0 0 0 0 0 0 0 7 5Inbound %Outbound %Inbound 12 517%17%4 0 0 0 0 0 02%02%07%07%0 0 0 0 0 0 0 0 02%02%1 0 0 1 5Outbound 48 27 0 0 0 0 0 0 0 0 1 1 3 2 0 0 0 0 0 0 0 0 0 0 0 0 4 2Inbound %Outbound %Inbound 4 1810%010%2 0 0 0 0 0 05%05%010%010%0 0 0 0 0 0 0 0 05%05%1 0 0 1 3Outbound 20 9 0 0 0 0 0 0 0 0 1 0 2 1 0 0 0 0 0 0 0 0 0 0 0 0 3 1Inbound %Outbound %Inbound 169 2987%127%21 0 0 0 0 0 02%02%07%07%0 0 0 0 0 0 0 0 02%32%6 0 0 15 27Outbound 158 339 0 0 0 0 0 0 0 0 3 7 11 24 0 0 0 0 0 0 0 0 0 0 0 0 14 31Inbound %Outbound %Inbound 12 2810%110%3 0 0 0 0 0 05%05%010%010%0 0 0 0 0 0 0 0 05%15%1 0 0 2 4Outbound 5 56 0 0 0 0 0 0 0 0 0 3 1 6 0 0 0 0 0 0 0 0 0 0 0 0 1 82010 Build Volume% Increase over 2010No BuildRts. 50/<strong>67</strong>From NorthRt. <strong>67</strong>From EastV-CornersRt. 50From SouthBallston Ave.From West470 404 437 405 20 17 8 18 129 265 277 565 60 94 289 545 14 2 25 9 151 152 70 64 1941 253026% 24% 32% 12% 80% 118% 24% 12% 11% 13% 31% 26% 22% 69% 15% 24% 10% NA 79% 754% 21% 16% 101% 20% 26% 22%*CDTC Estimates 0.5% background g- 2 -
2345<strong>67</strong>9101112131415161718202123DevelopmentWal-MartAdirondackTrust CoToscanaMobile HomeParkYarlin Ozbay -Gas StationRolling BrookMeadowsBrooklineCondoDevelopEast LineSubdivisionBeacon HillDunkinDonutsSSP/TechPark Phase IVAztech TechSKS Bottling& Office/WarehouseWidewatersLuther Forest(Phase I)Luther ForestCondosTraversMeadowsKelch AptsMalta FarmResidential22 Park PlaceBlessed JohnCemetery2010 Build Volume% Increase over 2010No BuildNet TrafficGenerationLeftRt. <strong>67</strong>From NorthBrookline & Rt. <strong>67</strong>Rt. <strong>67</strong>From SouthC.R. 60 Brookline Rd.From WestThru Right Left Thru Right Left Thru RightBookline &Rt. <strong>67</strong>AM PM AM PM AM PM AM PM AM PM AM PM AM PM AM PM AM PM AM PM AM PM2004 Volume NA NA 483 421 3 7 209 385 270 507 0 0 7 4 NA NA 368 220 1340 15442010 Volume (1.5%)* NA NA 528 460 3 8 229 421 295 554 0 0 8 4 NA NA 402 241 1465 1688Inbound %Outbound %30% 30%30% 30%Inbound 0 0 NA NA 0 0 0 0 0 0 0 0 0 0 0 0 NA NA 0 0 0 0Outbound 0 0 NA NA 0 0 0 0 0 0 0 0 0 0 0 0 NA NA 0 0 0 0Inbound %Outbound %Inbound 10 34 NA NA30%030%0 0 0 0 030%330%10 0 0 0 0 NA NA 0 0 3 10Outbound 7 34 NA NA 2 10 0 0 0 0 0 0 0 0 0 0 NA NA 0 0 2 10Inbound %Outbound %Inbound 3 7 NA NA60%060%0 0 0 0 060%260%4 0 0 0 0 NA NA 0 0 2 4Outbound 12 4 NA NA 7 3 0 0 0 0 0 0 0 0 0 0 NA NA 0 0 7 3Inbound %Outbound %Inbound 14 18 NA NA10%010%0 0 020%320%410%110%2 0 0 0 0 NA NA20%020%0 4 5Outbound 14 18 NA NA 1 2 0 0 0 0 0 0 0 0 0 0 NA NA 3 4 4 5Inbound %Outbound %Inbound 3 10 NA NA 0 0 0 060%260%6 0 0 0 0 0 0 NA NA60%060%0 2 6Outbound 9 6 NA NA 0 0 0 0 0 0 0 0 0 0 0 0 NA NA 5 4 5 4Inbound %Outbound %Inbound 4 19 NA NA 0 0 0 060%360%11 0 0 0 0 0 0 NA NA60%060%0 3 11Outbound 20 9 NA NA 0 0 0 0 0 0 0 0 0 0 0 0 NA NA 12 6 12 6Inbound %Outbound %Inbound 20 69 NA NA8%28%6 0 02%02%08%08%0 0 0 0 0 NA NA2%02%1 2 7Outbound 61 41 NA NA 0 0 0 0 1 1 5 3 0 0 0 0 NA NA 0 0 6 4Inbound %Outbound %Inbound 16 60 NA NA 0 0 0 060%1060%36 0 0 0 0 0 0 NA NA60%060%0 10 36Outbound 54 34 NA NA 0 0 0 0 0 0 0 0 0 0 0 0 NA NA 33 20 33 20Inbound %Outbound %Inbound 62 18 NA NA30%030%0 0 0 0 030%1930%5 0 0 0 0 NA NA 0 0 19 5Outbound 48 23 NA NA 14 7 0 0 0 0 0 0 0 0 0 0 NA NA 0 0 14 7Inbound %Outbound %Inbound 223 58 NA NA 0 0 0 030%<strong>67</strong>30%17 0 0 0 0 0 0 NA NA30%030%0 <strong>67</strong> 17Outbound 50 215 NA NA 0 0 0 0 0 0 0 0 0 0 0 0 NA NA 15 65 15 65Inbound %Outbound %30% 30%30% 30%Inbound 46 10 NA NA 0 0 0 0 14 3 0 0 0 0 0 0 NA NA 0 0 14 3Outbound 7 47 NA NA 0 0 0 0 0 0 0 0 0 0 0 0 NA NA 2 14 2 14Inbound %Outbound %Inbound 74 14 NA NA 0 0 0 030%2230%4 0 0 0 0 0 0 NA NA30%030%0 22 4Outbound 9 80 NA NA 0 0 0 0 0 0 0 0 0 0 0 0 NA NA 3 24 3 24Inbound %Outbound %Inbound 0 0 NA NA10%010%0 0 020%020%010%010%0 0 0 0 0 NA NA20%020%0 0 0Outbound 0 0 NA NA 0 0 0 0 0 0 0 0 0 0 0 0 NA NA 0 0 0 0Inbound %Outbound %8% 8%1% 1% 8% 8%1% 1%Inbound 900 225 NA NA 72 18 0 0 0 0 0 0 0 0 0 0 NA NA 9 2 81 20Outbound 180 900 NA NA 0 0 0 0 2 9 14 72 0 0 0 0 NA NA 0 0 16 81Inbound %Outbound %8% 8%1% 1% 8% 8%1% 1%Inbound 9 45 NA NA 1 4 0 0 0 0 0 0 0 0 0 0 NA NA 0 0 1 4Outbound 48 22 NA NA 0 0 0 0 0 0 4 2 0 0 0 0 NA NA 0 0 4 2Inbound %Outbound %Inbound 26 90 NA NA9%29%8 0 01%01%09%09%0 0 0 0 0 NA NA1%01%1 3 9Outbound 82 52 NA NA 0 0 0 0 1 1 7 5 0 0 0 0 NA NA 0 0 8 5Inbound %Outbound %Inbound 12 51 NA NA9%19%5 0 01%01%09%09%0 0 0 0 0 NA NA1%01%1 1 5Outbound 48 27 NA NA 0 0 0 0 0 0 4 2 0 0 0 0 NA NA 0 0 5 3Inbound %Outbound %Inbound 4 18 NA NA15%115%3 0 05%05%015%015%0 0 0 0 0 NA NA5%05%1 1 4Outbound 20 9 NA NA 0 0 0 0 1 0 3 1 0 0 0 0 NA NA 0 0 4 2Inbound %Outbound %9% 9%1% 1% 9% 9%1% 1%Inbound 169 298 NA NA 15 27 0 0 0 0 0 0 0 0 0 0 NA NA 2 3 17 30Outbound 158 339 NA NA 0 0 0 0 2 3 14 31 0 0 0 0 NA NA 0 0 16 34Inbound %Outbound %15% 15%5% 5% 15% 15%5% 5%Inbound 12 28 NA NA 2 4 0 0 0 0 0 0 0 0 0 0 NA NA 1 1 2 6Outbound 5 56 NA NA 0 0 0 0 0 3 1 8 0 0 0 0 NA NA 0 0 1 11NA NA 651 558 3 8 358 521 375 703 0 0 8 4 NA NA 490 390 1876 2174NA NA 23% 21% 0% 0% 57% 24% 27% 27% NA NA 0% 0% NA NA 22% 62% 28% 29%*CDTC Estimates 0.5% background g- 3 -
2345<strong>67</strong>9101112131415161718202123DevelopmentWal-MartAdirondackTrust CoToscanaMobile HomeParkYarlin Ozbay -Gas StationRolling BrookMeadowsBrooklineCondoDevelopEast LineSubdivisionBeacon HillDunkinDonutsSSP/TechPark Phase IVAztech TechSKS Bottling& Office/WarehouseWidewatersLuther Forest(Phase I)Luther ForestCondosTraversMeadowsKelch AptsMalta FarmResidential22 Park PlaceBlessed JohnCemeteryNet TrafficGeneration Left Thru Right Left Thru Right Left Thru RightAM PM AM PM AM PM AM PM AM PM AM PM AM PM AM PM AM PM AM PM AM PM2004 Volume 57 48 798 6<strong>67</strong> NA NA 34 53 NA NA 47 81 NA NA 463 739 52 30 1451 16182010 Volume (1.5%)* 62 52 873 729 NA NA 37 58 NA NA 51 89 NA NA 506 808 57 33 1587 1769Inbound %30% 30%Outbound %30% 30%Inbound 0 0 0 0 0 0 NA NA 0 0 NA NA 0 0 NA NA 0 0 0 0 0 0Outbound 0 0 0 0 0 0 NA NA 0 0 NA NA 0 0 NA NA 0 0 0 0 0 0Inbound %30% 30%Outbound %30% 30%Inbound 10 34 0 0 3 10 NA NA 0 0 NA NA 0 0 NA NA 0 0 0 0 3 10Outbound 7 34 0 0 0 0 NA NA 0 0 NA NA 0 0 NA NA 2 10 0 0 2 10Inbound %Outbound %Inbound 3 7 0 060%260%4 NA NA 0 0 NA NA 0 0 NA NA60%060%0 0 0 2 4Outbound 12 4 0 0 0 0 NA NA 0 0 NA NA 0 0 NA NA 7 3 0 0 7 3Inbound %30% 30%Outbound %30% 30%Inbound 14 18 0 0 4 5 NA NA 0 0 NA NA 0 0 NA NA 0 0 0 0 4 5Outbound 14 18 0 0 0 0 NA NA 0 0 NA NA 0 0 NA NA 4 5 0 0 4 5Inbound %Outbound %Inbound 3 10 0 060%260%6 NA NA 0 0 NA NA 0 0 NA NA60%060%0 0 0 2 6Outbound 9 6 0 0 0 0 NA NA 0 0 NA NA 0 0 NA NA 5 4 0 0 5 4Inbound %Outbound %Inbound 4 19 0 060%360%11 NA NA 0 0 NA NA 0 0 NA NA60%060%0 0 0 3 11Outbound 20 9 0 0 0 0 NA NA 0 0 NA NA 0 0 NA NA 12 6 0 0 12 6Inbound %Outbound %Inbound 20 69 0 010%010%0 NA NA 0 0 NA NA 0 0 NA NA10%710%7 0 0 7 7Outbound 61 41 0 0 6 4 NA NA 0 0 NA NA 0 0 NA NA 0 0 0 0 6 4Inbound %Outbound %Inbound 16 60 0 060%1060%36 NA NA 0 0 NA NA 0 0 NA NA60%060%0 0 0 10 36Outbound 54 34 0 0 0 0 NA NA 0 0 NA NA 0 0 NA NA 33 20 0 0 33 20Inbound %Outbound %Inbound 62 18 0 030%1930%5NA NA 0 0NA NA 0 0NA NA30%030%0 0 0 19 5Outbound 48 23 0 0 0 0 NA NA 0 0 NA NA 0 0 NA NA 14 7 0 0 14 7Inbound %30% 30%Outbound %30% 30%Inbound 223 58 0 0 <strong>67</strong> 17 NA NA 0 0 NA NA 0 0 NA NA 0 0 0 0 <strong>67</strong> 17Outbound 50 215 0 0 0 0 NA NA 0 0 NA NA 0 0 NA NA 15 65 0 0 15 65Inbound %2% 2% 28% 28%Outbound %28% 28% 2% 2%Inbound 46 10 1 0 13 3NA NA 0 0NA NA 0 0NA NA 0 0 0 0 14 3Outbound 7 47 0 0 0 0 NA NA 0 0 NA NA 0 0 NA NA 2 13 0 1 2 14Inbound %30% 30%Outbound %30% 30%Inbound 74 14 0 0 22 4NA NA 0 0NA NA 0 0NA NA 0 0 0 0 22 4Outbound 9 80 0 0 0 0 NA NA 0 0 NA NA 0 0 NA NA 3 24 0 0 3 24Inbound %30% 30%Outbound %30% 30%Inbound 0 0 0 0 0 0 NA NA 0 0 NA NA 0 0 NA NA 0 0 0 0 0 0Outbound 0 0 0 0 0 0 NA NA 0 0 NA NA 0 0 NA NA 0 0 0 0 0 0Inbound %9% 9%Outbound %Inbound 900 225 0 09%09%0 NA NA 0 0 NA NA 0 0 NA NA 20 20 0 0 20 20Outbound 180 900 0 0 16 81 NA NA 0 0 NA NA 0 0 NA NA 0 0 0 0 16 81Inbound %Outbound %Inbound 9 45 0 09%09%0 NA NA 0 0 NA NA 0 0 NA NA9%49%4 0 0 4 4Outbound 48 22 0 0 4 2 NA NA 0 0 NA NA 0 0 NA NA 0 0 0 0 4 2Inbound %10% 10%Outbound %Inbound 26 90 0 010%010%0 NA NA 0 0 NA NA 0 0 NA NA 9 9 0 0 9 9Outbound 82 52 0 0 8 5 NA NA 0 0 NA NA 0 0 NA NA 0 0 0 0 8 5Inbound %10% 10%Outbound %Inbound 12 51 0 010%010%0 NA NA 0 0 NA NA 0 0 NA NA 5 5 0 0 5 5Outbound 48 27 0 0 5 3 NA NA 0 0 NA NA 0 0 NA NA 0 0 0 0 5 3Inbound %20% 20%Outbound %Inbound 4 18 0 020%020%0 NA NA 0 0 NA NA 0 0 NA NA 4 4 0 0 4 4Outbound 20 9 0 0 4 2 NA NA 0 0 NA NA 0 0 NA NA 0 0 0 0 4 2Inbound %10% 10%Outbound %Inbound 169 298 0 010%010%0 NA NA 0 0 NA NA 0 0 NA NA 30 30 0 0 30 30Outbound 158 339 0 0 16 34 NA NA 0 0 NA NA 0 0 NA NA 0 0 0 0 16 34Inbound %20% 20%Outbound %Inbound 12 28 0 020%020%0 NA NA 0 0 NA NA 0 0 NA NA 6 6 0 0 6 6Outbound 5 56 0 0 1 11 NA NA 0 0 NA NA 0 0 NA NA 0 0 0 0 1 112010 Build Volume% Increase over 2010No BuildRt. <strong>67</strong>From EastCurtis Lumber & Rt. <strong>67</strong>Curtis LumberFrom SouthRt. <strong>67</strong>From WestCurtis Lmbr& Rt. <strong>67</strong>63 53 1081 978 NA NA 37 58 NA NA 51 89 0 0 693 1054 57 34 1973 22552% 0% 24% 34% NA NA 0% 0% NA NA 0% 0% NA NA 37% 30% 0% 3% 24% 27%*CDTC Estimates 0.5% background g- 4 -
2345<strong>67</strong>9101112131415161718202123DevelopmentWal-MartAdirondackTrust CoToscanaMobile HomeParkYarlin Ozbay -Gas StationRolling BrookMeadowsBrooklineCondoDevelopEast LineSubdivisionBeacon HillDunkinDonutsSSP/TechPark Phase IVAztech TechSKS Bottling& Office/WarehouseWidewatersLuther Forest(Phase I)Luther ForestCondosTraversMeadowsKelch AptsMalta FarmResidential22 Park PlaceBlessed JohnCemeteryNet TrafficGeneration Left Thru Right Left Thru Right Left Thru Right Left Thru RightAM PM AM PM AM PM AM PM AM PM AM PM AM PM AM PM AM PM AM PM AM PM AM PM AM PM AM PM2004 Volume 127 40 98 50 25 13 84 118 481 654 23 98 99 127 19 102 186 111 4 19 721 597 68 115 1935 20452010 Volume (1.5%)* 139 44 107 54 27 15 92 129 526 715 25 107 108 139 20 112 203 121 5 20 788 653 74 125 2115 2236Inbound %Outbound %25% 25% 5% 5%25% 25% 5% 5%Inbound 0 0 0 0 0 0 0 0 0 0 0 0 0 0 0 0 0 0 0 0 0 0 0 0 0 0 0 0Outbound 0 0 0 0 0 0 0 0 0 0 0 0 0 0 0 0 0 0 0 0 0 0 0 0 0 0 0 0Inbound %Outbound %Inbound 10 34 0 0 0 0 0 0 0 025%325%9 0 05%15%2 0 0 0 0 0 025%025%05%05%0 3 10Outbound 7 34 0 0 0 0 0 0 0 0 0 0 0 0 0 0 0 0 0 0 0 0 2 9 0 2 2 10Inbound %Outbound %Inbound 3 7 0 0 0 0 0 0 0 060%260%4 0 0 0 0 0 0 0 0 0 060%060%0 0 0 2 4Outbound 12 4 0 0 0 0 0 0 0 0 0 0 0 0 0 0 0 0 0 0 0 0 7 3 0 0 7 3Inbound %Outbound %Inbound 14 18 0 0 0 0 0 0 0 025%325%5 0 05%15%1 0 0 0 0 0 025%025%05%05%0 4 5Outbound 14 18 0 0 0 0 0 0 0 0 0 0 0 0 0 0 0 0 0 0 0 0 3 5 1 1 4 5Inbound %Outbound %Inbound 3 10 0 0 0 0 0 0 0 060%260%6 0 0 0 0 0 0 0 0 0 060%060%0 0 0 2 6Outbound 9 6 0 0 0 0 0 0 0 0 0 0 0 0 0 0 0 0 0 0 0 0 5 4 0 0 5 4Inbound %Outbound %Inbound 4 19 0 0 0 0 0 0 0 060%360%11 0 0 0 0 0 0 0 0 0 060%060%0 0 0 3 11Outbound 20 9 0 0 0 0 0 0 0 0 0 0 0 0 0 0 0 0 0 0 0 0 12 6 0 0 12 6Inbound %Outbound %Inbound 20 69 0 05%15%3 0 020%420%14 0 0 0 010%010%05%05%020%020%0 0 0 0 010%210%7 7 24Outbound 61 41 0 0 0 0 0 0 0 0 0 0 0 0 6 4 3 2 12 8 0 0 0 0 0 0 21 14Inbound %Outbound %Inbound 16 60 0 0 0 0 0 0 0 060%1060%36 0 0 0 0 0 0 0 0 0 060%060%0 0 0 10 36Outbound 54 34 0 0 0 0 0 0 0 0 0 0 0 0 0 0 0 0 0 0 0 0 33 20 0 0 33 20Inbound %Outbound %Inbound 62 18 0 0 0 0 0 0 0 025%1625%5 0 05%35%1 0 0 0 0 0 025%025%05%05%0 19 5Outbound 48 23 0 0 0 0 0 0 0 0 0 0 0 0 0 0 0 0 0 0 0 0 12 6 2 1 14 7Inbound %Outbound %Inbound 223 58 0 0 0 0 0 0 0 030%<strong>67</strong>30%17 0 0 0 0 0 0 0 0 0 030%030%0 0 0 <strong>67</strong> 17Outbound 50 215 0 0 0 0 0 0 0 0 0 0 0 0 0 0 0 0 0 0 0 0 15 65 0 0 15 65Inbound %Outbound %Inbound 46 10 0 0 0 0 0 0 0 028%1328%3 0 0 0 0 0 0 0 0 0 028%028%0 0 0 13 3Outbound 7 47 0 0 0 0 0 0 0 0 0 0 0 0 0 0 0 0 0 0 0 0 2 13 0 0 2 13Inbound %Outbound %Inbound 74 14 0 0 0 0 0 0 0 030%2230%4 0 0 0 0 0 0 0 0 0 030%030%0 0 0 22 4Outbound 9 80 0 0 0 0 0 0 0 0 0 0 0 0 0 0 0 0 0 0 0 0 3 24 0 0 3 24Inbound %Outbound %Inbound 0 0 0 0 0 0 0 0 0 025%025%0 0 05%05%0 0 0 0 0 0 025%025%05%05%0 0 0Outbound 0 0 0 0 0 0 0 0 0 0 0 0 0 0 0 0 0 0 0 0 0 0 0 0 0 0 0 0Inbound %Outbound %Inbound 900 225 0 0 0 0 0 0 0 09%09%0 0 0 0 0 0 0 0 0 0 09%819%20 0 0 81 20Outbound 180 900 0 0 0 0 0 0 0 0 16 81 0 0 0 0 0 0 0 0 0 0 0 0 0 0 16 81Inbound %Outbound %Inbound 9 45 0 0 0 0 0 0 0 09%09%0 0 0 0 0 0 0 0 0 0 09%19%4 0 0 1 4Outbound 48 22 0 0 0 0 0 0 0 0 4 2 0 0 0 0 0 0 0 0 0 0 0 0 0 0 4 2Inbound %Outbound %Inbound 26 90 0 0 0 0 0 0 0 010%010%0 0 0 0 0 0 0 0 0 0 010%310%9 0 0 3 9Outbound 82 52 0 0 0 0 0 0 0 0 8 5 0 0 0 0 0 0 0 0 0 0 0 0 0 0 8 5Inbound %Outbound %Inbound 12 51 0 0 0 0 0 0 0 010%010%0 0 0 0 0 0 0 0 0 0 010%110%5 0 0 1 5Outbound 48 27 0 0 0 0 0 0 0 0 5 3 0 0 0 0 0 0 0 0 0 0 0 0 0 0 5 3Inbound %Outbound %Inbound 4 18 0 0 0 0 0 0 0 020%020%0 0 0 0 0 0 0 0 0 0 020%120%4 0 0 1 4Outbound 20 9 0 0 0 0 0 0 0 0 4 2 0 0 0 0 0 0 0 0 0 0 0 0 0 0 4 2Inbound %Outbound %Inbound 169 298 0 0 0 0 0 0 0 010%010%0 0 0 0 0 0 0 0 0 0 010%1710%30 0 0 17 30Outbound 158 339 0 0 0 0 0 0 0 0 16 34 0 0 0 0 0 0 0 0 0 0 0 0 0 0 16 34Inbound %Outbound %Inbound 12 28 0 0 0 0 0 0 0 020%020%0 0 0 0 0 0 0 0 0 0 020%220%6 0 0 2 6Outbound 5 56 0 0 0 0 0 0 0 0 1 11 0 0 0 0 0 0 0 0 0 0 0 0 0 0 1 112010 Build Volume% Increase over 2010No BuildEastlineFrom NorthRt. <strong>67</strong>From EastEastline Rd. & Rt. <strong>67</strong>C.R. 82 (Eastline Rd.)From SouthRt. <strong>67</strong>From WestEastline &Rt. <strong>67</strong>139 44 108 58 27 15 96 143 724 956 25 107 119 147 24 114 216 129 5 20 993 888 80 136 2545 27480% 0% 1% 6% 0% 0% 5% 11% 38% 34% 0% 0% 10% 6% 15% 2% 6% 7% 0% 0% 26% 36% 8% 9% 20% 23%*CDTC Estimates 0.5% background g- 5 -
2345<strong>67</strong>9101112131415161718202123DevelopmentWal-MartAdirondackTrust CoToscanaMobile HomeParkYarlin Ozbay -Gas StationRolling BrookMeadowsBrooklineCondoDevelopEast LineSubdivisionBeacon HillDunkinDonutsSSP/TechPark Phase IVAztech TechSKS Bottling& Office/WarehouseWidewatersLuther Forest(Phase I)Luther ForestCondosTraversMeadowsKelch AptsMalta FarmResidential22 Park PlaceBlessed JohnCemeteryNet TrafficGeneration Left Thru Right Left Thru Right Left Thru RightAM PM AM PM AM PM AM PM AM PM AM PM AM PM AM PM AM PM AM PM AM PM2004 Volume 5 15 532 859 NA NA 5 7 NA NA 17 17 NA NA 892 718 8 14 1459 16302010 Volume (1.5%)* 5 16 582 939 NA NA 5 8 NA NA 19 19 NA NA 975 785 9 15 1595 1782Inbound %25% 25%Outbound %25% 25%Inbound 0 0 0 0 0 0 NA NA 0 0 NA NA 0 0 NA NA 0 0 0 0 0 0Outbound 0 0 0 0 0 0 NA NA 0 0 NA NA 0 0 NA NA 0 0 0 0 0 0Inbound %25% 25%Outbound %25% 25%Inbound 10 34 0 0 3 9 NA NA 0 0 NA NA 0 0 NA NA 0 0 0 0 3 9Outbound 7 34 0 0 0 0 NA NA 0 0 NA NA 0 0 NA NA 2 9 0 0 2 9Inbound %Outbound %Inbound 3 7 0 060%260%4 NA NA 0 0 NA NA 0 0 NA NA60%060%0 0 0 2 4Outbound 12 4 0 0 0 0 NA NA 0 0 NA NA 0 0 NA NA 7 3 0 0 7 3Inbound %25% 25%Outbound %25% 25%Inbound 14 18 0 0 3 5 NA NA 0 0 NA NA 0 0 NA NA 0 0 0 0 3 5Outbound 14 18 0 0 0 0 NA NA 0 0 NA NA 0 0 NA NA 3 5 0 0 3 5Inbound %Outbound %Inbound 3 10 0 060%260%6 NA NA 0 0 NA NA 0 0 NA NA60%060%0 0 0 2 6Outbound 9 6 0 0 0 0 NA NA 0 0 NA NA 0 0 NA NA 5 4 0 0 5 4Inbound %Outbound %Inbound 4 19 0 060%360%11 NA NA 0 0 NA NA 0 0 NA NA60%060%0 0 0 3 11Outbound 20 9 0 0 0 0 NA NA 0 0 NA NA 0 0 NA NA 12 6 0 0 12 6Inbound %Outbound %Inbound 20 69 0 010%010%0 NA NA 0 0 NA NA 0 0 NA NA10%710%7 0 0 7 7Outbound 61 41 0 0 6 4 NA NA 0 0 NA NA 0 0 NA NA 0 0 0 0 6 4Inbound %Outbound %Inbound 16 60 0 060%1060%36 NA NA 0 0 NA NA 0 0 NA NA60%060%0 0 0 10 36Outbound 54 34 0 0 0 0 NA NA 0 0 NA NA 0 0 NA NA 33 20 0 0 33 20Inbound %Outbound %Inbound 62 18 0 025%1625%5NA NA 0 0NA NA 0 0NA NA25%025%0 0 0 16 5Outbound 48 23 0 0 0 0 NA NA 0 0 NA NA 0 0 NA NA 12 6 0 0 12 6Inbound %30% 30%Outbound %30% 30%Inbound 223 58 0 0 <strong>67</strong> 17 NA NA 0 0 NA NA 0 0 NA NA 0 0 0 0 <strong>67</strong> 17Outbound 50 215 0 0 0 0 NA NA 0 0 NA NA 0 0 NA NA 15 65 0 0 15 65Inbound %28% 28%Outbound %28% 28%Inbound 46 10 0 0 13 3NA NA 0 0NA NA 0 0NA NA 0 0 0 0 13 3Outbound 7 47 0 0 0 0 NA NA 0 0 NA NA 0 0 NA NA 2 13 0 0 2 13Inbound %30% 30%Outbound %30% 30%Inbound 74 14 0 0 22 4NA NA 0 0NA NA 0 0NA NA 0 0 0 0 22 4Outbound 9 80 0 0 0 0 NA NA 0 0 NA NA 0 0 NA NA 3 24 0 0 3 24Inbound %25% 25%Outbound %25% 25%Inbound 0 0 0 0 0 0 NA NA 0 0 NA NA 0 0 NA NA 0 0 0 0 0 0Outbound 0 0 0 0 0 0 NA NA 0 0 NA NA 0 0 NA NA 0 0 0 0 0 0Inbound %9% 9%Outbound %Inbound 900 225 0 09%09%0 NA NA 0 0 NA NA 0 0 NA NA 20 20 0 0 20 20Outbound 180 900 0 0 16 81 NA NA 0 0 NA NA 0 0 NA NA 0 0 0 0 16 81Inbound %Outbound %Inbound 9 45 0 09%09%0 NA NA 0 0 NA NA 0 0 NA NA9%49%4 0 0 4 4Outbound 48 22 0 0 4 2 NA NA 0 0 NA NA 0 0 NA NA 0 0 0 0 4 2Inbound %10% 10%Outbound %Inbound 26 90 0 010%010%0 NA NA 0 0 NA NA 0 0 NA NA 9 9 0 0 9 9Outbound 82 52 0 0 8 5 NA NA 0 0 NA NA 0 0 NA NA 0 0 0 0 8 5Inbound %10% 10%Outbound %Inbound 12 51 0 010%010%0 NA NA 0 0 NA NA 0 0 NA NA 5 5 0 0 5 5Outbound 48 27 0 0 5 3 NA NA 0 0 NA NA 0 0 NA NA 0 0 0 0 5 3Inbound %20% 20%Outbound %Inbound 4 18 0 020%020%0 NA NA 0 0 NA NA 0 0 NA NA 4 4 0 0 4 4Outbound 20 9 0 0 4 2 NA NA 0 0 NA NA 0 0 NA NA 0 0 0 0 4 2Inbound %10% 10%Outbound %Inbound 169 298 0 010%010%0 NA NA 0 0 NA NA 0 0 NA NA 30 30 0 0 30 30Outbound 158 339 0 0 16 34 NA NA 0 0 NA NA 0 0 NA NA 0 0 0 0 16 34Inbound %20% 20%Outbound %Inbound 12 28 0 020%020%0 NA NA 0 0 NA NA 0 0 NA NA 6 6 0 0 6 6Outbound 5 56 0 0 1 11 NA NA 0 0 NA NA 0 0 NA NA 0 0 0 0 1 112010 Build Volume% Increase over 2010No BuildRt. <strong>67</strong>From EastRuhle Rd. & Rt. <strong>67</strong>Ruhle Rd.From SouthRt. <strong>67</strong>From WestRuhle Rd. &Rt. <strong>67</strong>5 16 786 1184 NA NA 5 8 NA NA 19 19 0 0 1158 1027 9 15 1973 22600% 0% 35% 26% NA NA 0% 0% NA NA 0% 0% NA NA 19% 31% 0% 0% 24% 27%*CDTC Estimates 0.5% background g- 6 -
2345<strong>67</strong>9101112131415161718202123DevelopmentWal-MartAdirondackTrust CoToscanaMobile HomeParkYarlin Ozbay -Gas StationRolling BrookMeadowsBrooklineCondoDevelopEast LineSubdivisionBeacon HillDunkinDonutsSSP/TechPark Phase IVAztech TechSKS Bottling& Office/WarehouseWidewatersLuther Forest(Phase I)Luther ForestCondosTraversMeadowsKelch AptsMalta FarmResidential22 Park PlaceBlessed JohnCemeteryAM PM2004 Volume2010 Volume (1.5%)*Inbound %Outbound %Inbound 0 0Outbound 0 0Inbound %Outbound %Inbound 10 34Outbound 7 34Inbound %Outbound %Inbound 3 7Outbound 12 4Inbound %Outbound %Inbound 14 18Outbound 14 18Inbound %Outbound %Inbound 3 10Outbound 9 6Inbound %Outbound %Inbound 4 19Outbound 20 9Inbound %Outbound %Inbound 20 69Outbound 61 41Inbound %Outbound %Inbound 16 60Outbound 54 34Inbound %Outbound %Inbound 62 18Outbound 48 23Inbound %Outbound %Inbound 223 58Outbound 50 215Inbound %Outbound %Inbound 46 10Outbound 7 47Inbound %Outbound %Inbound 74 14Outbound 9 80Inbound %Outbound %Inbound 0 0Outbound 0 0Inbound %Outbound %Inbound 900 225Outbound 180 900Inbound %Outbound %Inbound 9 45Outbound 48 22Inbound %Outbound %Inbound 26 90Outbound 82 52Inbound %Outbound %Inbound 12 51Outbound 48 27Inbound %Outbound %Inbound 4 18Outbound 20 9Inbound %Outbound %Inbound 169 298Outbound 158 339Inbound %Outbound %Inbound 12 28Outbound 5 562010 Build Volume% Increase over 2010No BuildNet TrafficGenerationI-87 Southbound Exit RampFrom NorthRt. <strong>67</strong>From EastI-87 Southbound Exit Ramp & Rt. <strong>67</strong>I-87 SB Entrance Ramp -From SouthRt. <strong>67</strong>From WestI-87 SB &Left Thru Right Left Thru Right Left Thru Right Left Thru Right Rt. <strong>67</strong>AM PM AM PM AM PM AM PM AM PM AM PM AM PM AM PM AM PM AM PM AM PM AM PM AM PM148 124 1 0 420 120 428 225 608 700 1 1 0 0 0 0 0 0 1 1 356 812 528 298 2492 2281162 135 1 0 460 132 468 246 664 765 1 1 0 0 0 0 0 0 1 1 389 888 577 326 2724 249410% 10% 15% 15%15% 15% 10% 10%0 0 0 0 0 0 0 0 0 0 0 0 0 0 0 0 0 0 0 0 0 0 0 0 0 00 0 0 0 0 0 0 0 0 0 0 0 0 0 0 0 0 0 0 0 0 0 0 0 0 010% 10% 15% 15%15% 15% 10% 10%0 0 0 0 1 3 0 0 2 5 0 0 0 0 0 0 0 0 0 0 0 0 0 0 3 90 0 0 0 0 0 0 0 0 0 0 0 0 0 0 0 0 0 0 0 1 5 1 3 2 910% 10% 50% 50%20% 20% 40% 40%0 0 0 0 0 1 0 0 2 3 0 0 0 0 0 0 0 0 0 0 0 0 0 0 2 40 0 0 0 0 0 0 0 0 0 0 0 0 0 0 0 0 0 0 0 2 1 5 2 7 310% 10% 15% 15%15% 15% 10% 10%1 2 0 0 0 0 0 0 2 3 0 0 0 0 0 0 0 0 0 0 0 0 0 0 3 50 0 0 0 0 0 0 0 0 0 0 0 0 0 0 0 0 0 0 0 2 3 1 2 3 510% 10% 50% 50%20% 20% 40% 40%0 0 0 0 0 1 0 0 2 5 0 0 0 0 0 0 0 0 0 0 0 0 0 0 2 60 0 0 0 0 0 0 0 0 0 0 0 0 0 0 0 0 0 0 0 2 1 3 2 5 410% 10% 50% 50%20% 20% 40% 40%0 0 0 0 0 2 0 0 2 9 0 0 0 0 0 0 0 0 0 0 0 0 0 0 3 110 0 0 0 0 0 0 0 0 0 0 0 0 0 0 0 0 0 0 0 4 2 8 4 12 610% 10% 10% 10%20% 20%0 0 0 0 2 7 0 0 2 7 0 0 0 0 0 0 0 0 0 0 0 0 0 4 140 0 0 0 0 0 0 0 0 0 0 0 0 0 0 0 0 0 0 0 12 8 0 0 12 810% 10% 50% 50%20% 20% 40% 40%0 0 0 0 2 6 0 0 8 30 0 0 0 0 0 0 0 0 0 0 0 0 0 0 10 360 0 0 0 0 0 0 0 0 0 0 0 0 0 0 0 0 0 0 0 11 7 22 14 33 2010% 10% 15% 15%15% 15% 10% 10%0 0 0 0 6 2 0 0 9 3 0 0 0 0 0 0 0 0 0 0 0 0 0 0 16 50 0 0 0 0 0 0 0 0 0 0 0 0 0 0 0 0 0 0 0 7 3 5 2 12 610% 10% 20% 20%15% 15% 15% 15%0 0 0 0 22 6 0 0 45 12 0 0 0 0 0 0 0 0 0 0 0 0 0 0 <strong>67</strong> 170 0 0 0 0 0 0 0 0 0 0 0 0 0 0 0 0 0 0 0 7 32 7 32 15 6510% 10% 18% 18%14% 14% 14% 14%0 0 0 0 5 1 0 0 8 2 0 0 0 0 0 0 0 0 0 0 0 0 0 0 13 30 0 0 0 0 0 0 0 0 0 0 0 0 0 0 0 0 0 0 0 1 7 1 7 2 1310% 10% 20% 20%15% 15% 15% 15%0 0 0 0 7 1 0 0 15 3 0 0 0 0 0 0 0 0 0 0 0 0 0 0 22 40 0 0 0 0 0 0 0 0 0 0 0 0 0 0 0 0 0 0 0 1 12 1 12 3 2410% 10% 15% 15%15% 15% 10% 10%0 0 0 0 0 0 0 0 0 0 0 0 0 0 0 0 0 0 0 0 0 0 0 0 0 00 0 0 0 0 0 0 0 0 0 0 0 0 0 0 0 0 0 0 0 0 0 0 0 0 020% 20% 9% 9%9% 9%180 45 0 0 0 0 0 0 0 0 0 0 0 0 0 0 0 0 0 0 81 20 0 0 261 650 0 0 0 0 0 0 0 16 81 0 0 0 0 0 0 0 0 0 0 0 0 0 0 16 8120% 20% 9% 9%9% 9%2 9 0 0 0 0 0 0 0 0 0 0 0 0 0 0 0 0 0 0 1 4 0 0 3 130 0 0 0 0 0 0 0 4 2 0 0 0 0 0 0 0 0 0 0 0 0 0 0 4 225% 25% 10% 10%25% 25% 10% 10%7 23 0 0 0 0 0 0 0 0 0 0 0 0 0 0 0 0 0 0 3 9 0 0 9 320 0 0 0 0 0 21 13 8 5 0 0 0 0 0 0 0 0 0 0 0 0 0 0 29 1825% 25% 10% 10%25% 25% 10% 10%3 13 0 0 0 0 0 0 0 0 0 0 0 0 0 0 0 0 0 0 1 5 0 0 4 180 0 0 0 0 0 12 7 5 3 0 0 0 0 0 0 0 0 0 0 0 0 0 0 17 1035% 35% 45% 45%45% 45% 35% 35%0 0 0 0 1 6 0 0 2 8 0 0 0 0 0 0 0 0 0 0 0 0 0 0 3 140 0 0 0 0 0 0 0 0 0 0 0 0 0 0 0 0 0 0 0 9 4 7 3 16 725% 25% 10% 10%25% 25% 10% 10%42 74 0 0 0 0 0 0 0 0 0 0 0 0 0 0 0 0 0 0 17 30 0 0 59 1040 0 0 0 0 0 39 85 16 34 0 0 0 0 0 0 0 0 0 0 0 0 0 0 55 11935% 35% 45% 45%45% 45% 35% 35%0 0 0 0 4 10 0 0 5 13 0 0 0 0 0 0 0 0 0 0 0 0 0 0 10 220 0 0 0 0 0 0 0 0 0 0 0 0 0 0 0 0 0 0 0 2 25 2 20 4 45399 302 1 0 513 179 541 351 821 996 1 1 0 0 0 0 0 0 1 1 557 1069 643 431 3464 3317146% 123% 0% NA 12% 36% 16% 43% 24% 30% 0% 0% NA NA NA NA NA NA 0% 0% 43% 20% 11% 32% 27% 33%*CDTC Estimates 0.5% background g- 7 -
2345<strong>67</strong>9101112131415161718202123DevelopmentWal-MartAdirondackTrust CoToscanaMobile HomeParkYarlin Ozbay -Gas StationRolling BrookMeadowsBrooklineCondoDevelopEast LineSubdivisionBeacon HillDunkinDonutsSSP/TechPark Phase IVAztech TechSKS Bottling& Office/WarehouseWidewatersLuther Forest(Phase I)Luther ForestCondosTraversMeadowsKelch AptsMalta FarmResidential22 Park PlaceBlessed JohnCemetery2010 Build Volume% Increase over 2010No BuildNet TrafficGenerationI-87 Northbound Exit Ramp & Rt. <strong>67</strong>I-87 Northbound Exit RampRt. <strong>67</strong>I-87 Northbound Entrance Ramp -Rt. <strong>67</strong>From NorthFrom EastFrom SouthFrom WestLeft Thru Right Left Thru Right Left Thru Right Left ThruAM PM AM PM AM PM AM PM AM PM AM PM AM PM AM PM AM PM AM PM AM PM AM PM AM PM AM PM2004 Volume 0 0 0 0 0 0 0 0 761 536 110 206 247 337 0 0 141 523 133 338 377 573 0 0 1770 25122010 Volume (1.5%)* 0 0 0 0 0 0 0 0 833 586 120 226 270 368 0 0 154 571 146 369 413 627 0 0 1935 2747Inbound %Outbound %5% 5% 10% 10%10% 10% 5% 5%Inbound 0 0 0 0 0 0 0 0 0 0 0 0 0 0 0 0 0 0 0 0 0 0 0 0 0 0 0 0Outbound 0 0 0 0 0 0 0 0 0 0 0 0 0 0 0 0 0 0 0 0 0 0 0 0 0 0 0 0Inbound %Outbound %Inbound 10 34 0 0 0 0 0 0 0 05%15%2 0 010%110%3 0 0 0 010%010%05%05%0 0 0 2 5Outbound 7 34 0 0 0 0 0 0 0 0 0 0 0 0 0 0 0 0 0 0 1 3 0 2 0 0 1 5Inbound %Outbound %Inbound 3 7 0 0 0 0 0 0 0 0 0 0 0 040%140%3 0 0 0 010%010%010%010%0 0 0 1 3Outbound 12 4 0 0 0 0 0 0 0 0 0 0 0 0 0 0 0 0 0 0 1 0 1 0 0 0 2 1Inbound %Outbound %Inbound 14 18 0 0 0 0 0 0 0 05%15%1 0 010%110%2 0 0 0 010%010%05%05%0 0 0 2 3Outbound 14 18 0 0 0 0 0 0 0 0 0 0 0 0 0 0 0 0 0 0 1 2 1 1 0 0 2 3Inbound %Outbound %Inbound 3 10 0 0 0 0 0 0 0 0 0 0 0 040%140%4 0 0 0 010%010%010%010%0 0 0 1 4Outbound 9 6 0 0 0 0 0 0 0 0 0 0 0 0 0 0 0 0 0 0 1 1 1 1 0 0 2 1Inbound %Outbound %Inbound 4 19 0 0 0 0 0 0 0 0 0 0 0 040%240%7 0 0 0 010%010%010%010%0 0 0 2 7Outbound 20 9 0 0 0 0 0 0 0 0 0 0 0 0 0 0 0 0 0 0 2 1 2 1 0 0 4 2Inbound %Outbound %Inbound 20 69 0 0 0 0 0 0 0 010%210%7 0 0 0 0 0 0 0 010%010%010%010%0 0 0 2 7Outbound 61 41 0 0 0 0 0 0 0 0 0 0 0 0 0 0 0 0 0 0 6 4 6 4 0 0 12 8Inbound %Outbound %Inbound 16 60 0 0 0 0 0 0 0 0 0 0 0 040%640%24 0 0 0 010%010%010%010%0 0 0 6 24Outbound 54 34 0 0 0 0 0 0 0 0 0 0 0 0 0 0 0 0 0 0 5 3 5 3 0 0 11 7Inbound %Outbound %Inbound 62 18 0 0 0 0 0 0 0 05%35%1 0 010%610%2 0 0 0 010%010%05%05%0 0 0 9 3Outbound 48 23 0 0 0 0 0 0 0 0 0 0 0 0 0 0 0 0 0 0 5 2 2 1 0 0 7 3Inbound %Outbound %Inbound 223 58 0 0 0 0 0 0 0 05%115%3 0 015%3315%9 0 0 0 010%010%05%05%0 0 0 45 12Outbound 50 215 0 0 0 0 0 0 0 0 0 0 0 0 0 0 0 0 0 0 5 22 2 11 0 0 7 32Inbound %Outbound %Inbound 46 10 0 0 0 0 0 0 0 04%24%0 0 014%614%1 0 0 0 010%010%04%04%0 0 0 8 2Outbound 7 47 0 0 0 0 0 0 0 0 0 0 0 0 0 0 0 0 0 0 1 5 0 2 0 0 1 7Inbound %Outbound %Inbound 74 14 0 0 0 0 0 0 0 05%45%1 0 015%1115%2 0 0 0 010%010%05%05%0 0 0 15 3Outbound 9 80 0 0 0 0 0 0 0 0 0 0 0 0 0 0 0 0 0 0 1 8 0 4 0 0 1 12Inbound %Outbound %Inbound 0 0 0 0 0 0 0 0 0 05%05%0 0 010%010%0 0 0 0 010%010%05%05%0 0 0 0 0Outbound 0 0 0 0 0 0 0 0 0 0 0 0 0 0 0 0 0 0 0 0 0 0 0 0 0 0 0 0Inbound %Outbound %Inbound 900 225 0 0 0 0 0 0 0 09%09%020%020%0 0 0 0 0 0 0 0 029%26129%65 0 0 261 65Outbound 180 900 0 0 0 0 0 0 0 0 16 81 36 180 0 0 0 0 0 0 0 0 0 0 0 0 52 261Inbound %Outbound %Inbound 9 45 0 0 0 0 0 0 0 09%09%020%020%0 0 0 0 0 0 0 0 029%329%13 0 0 3 13Outbound 48 22 0 0 0 0 0 0 0 0 4 2 10 4 0 0 0 0 0 0 0 0 0 0 0 0 14 6Inbound %Outbound %Inbound 26 90 0 0 0 0 0 0 0 035%035%025%025%0 0 0 0 025%725%23 0 035%935%32 0 0 16 54Outbound 82 52 0 0 0 0 0 0 0 0 29 18 21 13 0 0 0 0 0 0 0 0 0 0 0 0 49 31Inbound %Outbound %Inbound 12 51 0 0 0 0 0 0 0 035%035%025%025%0 0 0 0 025%325%13 0 035%435%18 0 0 7 31Outbound 48 27 0 0 0 0 0 0 0 0 17 10 12 7 0 0 0 0 0 0 0 0 0 0 0 0 29 16Inbound %Outbound %Inbound 4 18 0 0 0 0 0 0 0 010%010%2 0 035%135%6 0 0 0 035%035%010%010%0 0 0 2 8Outbound 20 9 0 0 0 0 0 0 0 0 0 0 0 0 0 0 0 0 0 0 7 3 2 1 0 0 9 4Inbound %Outbound %Inbound 169 298 0 0 0 0 0 0 0 035%035%025%025%0 0 0 0 025%4225%74 0 035%5935%104 0 0 101 179Outbound 158 339 0 0 0 0 0 0 0 0 55 119 39 85 0 0 0 0 0 0 0 0 0 0 0 0 95 204Inbound %Outbound %Inbound 12 28 0 0 0 0 0 0 0 010%110%3 0 035%435%10 0 0 0 035%035%010%010%0 0 0 5 13Outbound 5 56 0 0 0 0 0 0 0 0 0 0 0 0 0 0 0 0 0 0 2 20 1 6 0 0 2 250 0 0 0 0 0 0 0 979 836 239 516 349 444 0 0 206 681 184 443 774 895 0 0 2725 3809NA NA NA NA NA NA NA NA 18% 43% 99% 129% 29% 21% NA NA 34% 19% 26% 20% 87% 43% NA NA 41% 39%RightI-87 NB &Rt. <strong>67</strong>*CDTC Estimates 0.5% background g- 8 -