ONSHORE GULF COAST - Advanced Resources International, Inc.
ONSHORE GULF COAST - Advanced Resources International, Inc.
ONSHORE GULF COAST - Advanced Resources International, Inc.

You also want an ePaper? Increase the reach of your titles
YUMPU automatically turns print PDFs into web optimized ePapers that Google loves.
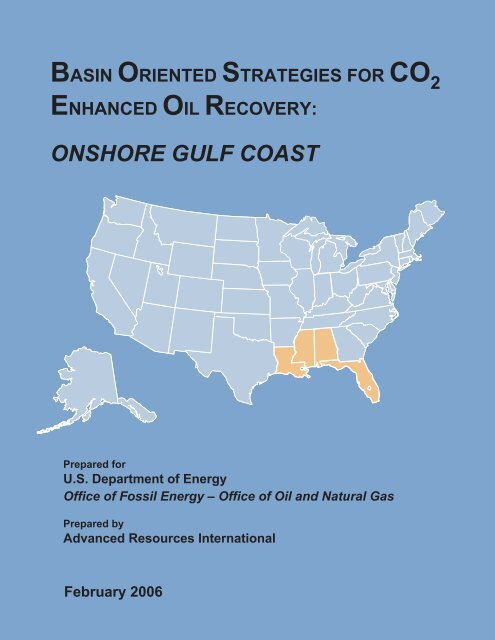
BASIN ORIENTED STRATEGIES FOR CO 2ENHANCED OIL RECOVERY:<strong>ONSHORE</strong> <strong>GULF</strong> <strong>COAST</strong>Prepared forU.S. Department of EnergyOffice of Fossil Energy – Office of Oil and Natural GasPrepared by<strong>Advanced</strong> <strong>Resources</strong> <strong>International</strong>February 2006
DisclaimerThis report was prepared as an account of work sponsored by an agency of the United StatesGovernment. Neither the United States nor the United States Department of Energy, nor any oftheir employees, makes any warranty, express or implied, or assumes any legal liability orresponsibility of the accuracy, completeness, or usefulness of any information, apparatus,product, or process disclosed, or represents that its use would not infringe privately owned rights.The findings and conclusions in this report are those of the authors and do not necessarilyrepresent the views of the Department of Energy.
BASIN ORIENTED STRATEGIES FORCO2 ENHANCED OIL RECOVERY:<strong>ONSHORE</strong> <strong>GULF</strong> <strong>COAST</strong> REGION OF ALABAMA,FLORIDA, LOUISIANA AND MISSISSIPPIPrepared forU.S. Department of EnergyPrepared by<strong>Advanced</strong> <strong>Resources</strong> <strong>International</strong>February 2006
TABLE OF CONTENTS1. SUMMARY OF FINDINGS1.1 INTRODUCTION1.2 ALTERNATIVE OIL RECOVERY STRATEGIES AND SCENARIOS1.3 OVERVIEW OF FINDINGS1.4. ACKNOWLEDGEMENTS2. INTRODUCTION2.1 CURRENT SITUATION2.2 BACKGROUND2.3 PURPOSE2.4 KEY ASSUMPTIONS2.5 TECHNICAL OBJECTIVES2.6 OTHER ISSUES3. OVERVIEW OF <strong>GULF</strong> <strong>COAST</strong> OIL PRODUCTION3.1 HISTORY OF OIL PRODUCTION3.2 EXPERIENCE WITH IMPROVED OIL RECOVERY3.3 THE “STRANDED OIL” PRIZE3.4 REVIEW OF PRIOR STUDIES4. MECHANISMS OF CO 2 -EOR4.1 MECHANISMS OF MISCIBLE CO 2 -EOR.4.2 MECHANISMS OF IMMISCIBLE CO 2 -EOR4.3 INTERACTIONS BETWEEN INJECTED CO 2 AND RESERVOIR OIL.5. STUDY METHODOLOGY5.1 OVERVIEW5.2 ASSEMBLING THE MAJOR OIL RESERVOIRS DATA BASE5.3 SCREENING RESERVOIRS FOR CO 2 -EOR.5.4 CALCULATING MINIMUM MISCIBILITY PRESSURE5.5 CALCULATING OIL RECOVERY5.6 ASSEMBLING THE COST MODEL5.7 CONSTRUCTING AN ECONOMICS MODEL5.8 PERFORMING SCENARIO ANALYSES6. RESULTS BY STATE6.1 LOUISIANA6.2 MISSISSIPPI6.3 ALABAMA6.4 FLORIDAi February 2006
Figure 1Figure 2Figure 3LIST OF FIGURESImpact of Technology and Financial Conditions on EconomicallyRecoverable Oil from the Gulf Coast Region’s Major Reservoirs UsingCO 2 -EOR (Million Barrels)Location of Major Gulf Coast Oil FieldsLocation of Existing and Planned CO 2 Supply Pipelines in Mississippiand LouisianaFigure 4 Gulf Coast Production since 1950Figure 5 One-Dimensional Schematic Showing the CO 2 Miscible ProcessFigure 6A Carbon Dioxide, CH 4 and N 2 densities at 105ºFFigure 6B Carbon Dioxide, CH 4 and N 2 viscosities at 105ºFFigure 7A Relative Oil Volume vs. Pressure for a Light West Texas Reservoir FluidFigure 7B Oil Swelling Factor vs. Pressure for a Heavy Oil in TurkeyFigure 8 Viscosity Reduction Versus Saturation PressureFigure 9 Estimating CO 2 Minimum Miscibility PressureFigure 10 Correlation of MW C5+ to Tank Oil GravityFigure 11 Large Louisiana Oil FieldsFigure 12 Large Mississippi Oil FieldsFigure 13 Large Alabama Oil FieldsFigure 14 Large Florida Oil FieldsLIST OF TABLESTable 1 Size and Distribution of the Gulf Coast Region’s Oil Reservoirs DataBaseTable 2 The Gulf Coast Region’s “Stranded Oil” Amenable to CO 2 -EORTable 3 Technically Recoverable Oil <strong>Resources</strong> from Miscible and ImmiscibleCO 2 -EORTable 4 Economically Recoverable <strong>Resources</strong> - Scenario #1: “TraditionalPractices” CO 2 -EORTable 5 Economically Recoverable <strong>Resources</strong> - Alternative ScenariosTable 6 Potential CO 2 Supply Requirements in the Gulf Coast Region: Scenario#4 (“Ample Supplies of CO 2 ”)Table 7 Matching of CO 2 -EOR Technology with the Gulf Coast’s Oil ReservoirsTable 8 Crude Oil Annual Production, Ten Largest Gulf Coast Oil Fields, 2000-2002 (Million Barrels per Year)Table 9 Selected Major Oil Fields of the Gulf Coast RegionTable 10 Reservoir Data Format: Major Oil Reservoirs Data BaseTable 11 Gulf Coast Oil Reservoirs Screened Amenable for CO 2 -EORTable 12 Economic Model Established by the StudyTable 13 Recent History of Louisiana Onshore Oil ProductionTable 14 Status of Large Louisiana Oil Fields/Reservoirs (as of 2002)Table 15 Reservoir Properties and Improved Oil Recovery Activity, LargeLouisiana Oil Fields/ReservoirsTable 16 Economic Oil Recovery Potential Under Two Technologic Conditions,Louisiana.ii February 2006
Table 17 Economic Oil Recovery Potential with More Favorable FinancialConditions, LouisianaTable 18 Recent History of Mississippi Onshore Oil ProductionTable 19 Status of Large Mississippi Oil Fields/Reservoirs as of 2002Table 20 Reservoir Properties and Improved Oil Recovery Activity, LargeMississippi Oil Fields/ReservoirsTable 21 Reservoir Properties and Improved Oil Recovery Activity Potential,Mississippi “Immiscible-CO 2 ” Oil Fields/ReservoirsTable 22 Economic Oil Recovery Potential Under Two Technologic Conditions,MississippiTable 23 Economic Oil Recovery Potential with More Favorable FinancialConditions, MississippiTable 24 Recent History of Alabama Onshore Oil ProductionTable 25 Status of Large Alabama Oil Fields/Reservoirs (as of 2004)Table 26 Reservoir Properties and Improved Oil Recovery Activity, Large AlabamaOil Fields/ReservoirsTable 27 Economic Oil Recovery Potential Under Two Technologic Conditions,AlabamaTable 28 Economic Oil Recovery Potential with More Favorable FinancialConditions, AlabamaTable 29 Recent History of Florida Onshore Oil ProductionTable 30 Status of Large Florida Oil Fields/Reservoirs, 2004Table 31 Reservoir Properties and Improved Oil Recovery Activity, Large FloridaOil Fields/ReservoirsTable 32 Economic Oil Recovery Potential Under Two Technologic Conditions,FloridaTable 33 Economic Oil Recovery Potential with More Favorable FinancialConditions, Floridaiii February 2006
1. SUMMARY OF FINDINGS1.1 INTRODUCTION. The onshore Gulf Coast oil and gas producing region ofLouisiana, Mississippi, Alabama and Florida have an original oil endowment of over 44billion barrels. Of this, nearly 17 billion barrels or 38% will be recovered with primaryand secondary (waterflooding) oil recovery. As such, nearly 28 billion barrels of oil willbe left in the ground, or “stranded”, following the use of traditional oil recovery practices.A major portion of this “stranded oil” is in reservoirs technically and economicallyamenable to enhanced oil recovery (EOR) using carbon dioxide (CO 2 ) injection.This report evaluates the future CO 2 -EOR oil recovery potential from the large oilfields of the onshore Gulf Coast region, highlighting the barriers that stand in the way ofachieving this potential. The report then discusses how a concerted set of “basinoriented strategies” could help the Gulf Coast’s oil production industry overcome thesebarriers helping increase domestic oil production.1.2 ALTERNATIVE OIL RECOVERY STRATEGIES AND SCENARIOS. Thereport sets forth four scenarios for using CO 2 -EOR to recover “stranded oil” in theonshore Gulf Coast producing region.• The first scenario captures how CO 2 -EOR technology has been applied andhas performed in the past. This low technology, high-risk scenario is called“Traditional Practices”.• The second scenario, entitled “State-of-the-art”, assumes that the technologyprogress in CO 2 -EOR, achieved in recent years and in other areas, issuccessfully applied in the Gulf Coast region. In addition, this scenarioassumes that a comprehensive program of research, pilot tests and fielddemonstrations help lower the risks inherent in applying new technology tothese complex Gulf Coast oil reservoirs.1-1 February 2006
• The third scenario, entitled “Risk Mitigation,” examines how the economicpotential of CO 2 -EOR could be increased through a comprehensive strategyinvolving state production tax reductions, federal investment tax credits,royalty relief and/or higher world oil prices that together would add anequivalent $10 per barrel to the price that the producer uses for makingcapital investment decisions for CO 2 -EOR.• The final scenario, entitled “Ample Supplies of CO 2 ,” assumes that largevolumes of low-cost, “EOR-ready” CO 2 supplies are aggregated from variousindustrial and natural sources. These low-cost to capture industrial CO 2sources include high-concentration CO 2 emissions from hydrogen facilities,gas processing plants, chemical plants and other sources in the region.These CO 2 sources would be augmented, in the longer-term, from lowconcentration CO 2 emissions from refineries and electric power plants.Capture of industrial CO 2 emissions could also be part of a national effort forreducing greenhouse gas emissions.1.3 OVERVIEW OF FINDINGS. Twelve major findings emerge from the study of“Basin Oriented Strategies for CO 2 Enhanced Oil Recovery: Onshore Gulf Coast Basinsof Alabama, Florida, Louisiana and Mississippi.”1. Today’s oil recovery practices will leave behind a large resource of“stranded oil” in the onshore Gulf Coast region. The original oil resource in onshoreGulf Coast reservoirs is 44.4 billion barrels. To date, 16.9 billion barrels of this originaloil in-place (OOIP) has been recovered or proved. Thus, without further efforts, 27.6billion barrels of the Gulf Coast’s oil resource will become “stranded”, Table 1. Toexamine how much of this “stranded oil” could become recoverable, the studyassembled a data base of 239 oil reservoirs (in this four state region) holding 15.9 billionbarrels of “stranded oil.”1-2 February 2006
Table 1. Size and Distribution of the Gulf Coast Region’s Oil Reservoirs Data BaseRegionA. Major Oil ReservoirsNo. ofReservoirsOOIP(Billion Bbls)CumulativeRecovery/ Reserves*(Billion Bbls)ROIP(Billion Bbls)Louisiana 178 20.4 7.9 12.5Mississippi 34 3.0 1.0 2.0Alabama 20 1.1 0.4 0.7Florida 7 1.3 0.6 0.7Data Base Total 239 25.8 9.9 15.9B. Regional Total* n/a 44.4 16.9 27.6*Estimated from state data on cumulative oil recovery and proved reserves, as of the end of 2002 for Louisiana andMississippi and 2004 for Alabama and Florida.2. The great bulk of the “stranded oil” resource in the large oil reservoirsof the Gulf Coast is amenable to CO 2 enhanced oil recovery. To further address the“stranded oil” issue, <strong>Advanced</strong> <strong>Resources</strong> assembled a data base that contains 239major Gulf Coast oil reservoirs, accounting for about 60% of the region’s estimatedultimate oil production. Of these, 158 reservoirs, with 20 billion barrels of OOIP and11.9 billion barrels of “stranded oil” (ROIP), were found to be favorable for CO 2 -EOR, asshown below by state, Table 2.RegionTable 2. The Gulf Coast Region’s “Stranded Oil” Amenable to CO 2 -EORNo. ofReservoirsOOIP(Billion Bbls)CumulativeRecovery/ Reserves(Billion Bbls)ROIP(Billion Bbls)Louisiana 128 16.1 6.7 9.4Mississippi 20 1.9 0.7 1.2Alabama 5 0.8 0.3 0.5Florida 5 1.3 0.5 0.8TOTAL 158 20.1 8.2 11.91-3 February 2006
3. Application of miscible CO 2 -EOR would enable a significant portion ofthe Gulf Coast’s “stranded oil” to be recovered. Of the 158 large Gulf Coast oilreservoirs favorable for CO 2 -EOR, 154 reservoirs (with 19.7 billion barrels OOIP) screenas being favorable for miscible CO 2 -EOR. The remaining 4 oil reservoirs (with 0.2billion barrels OOIP) screen as being favorable for immiscible CO 2 -EOR. The totaltechnically recoverable resource from applying CO 2 -EOR in these 158 large oilreservoirs, ranges from 1,800 million barrels to 4,100 million barrels, depending on thetype of CO 2 -EOR technology that is applied — “Traditional Practices” or “State-of-theart”,Table 3.Table 3. Technically Recoverable Oil <strong>Resources</strong> from Miscible and Immiscible CO 2 -EORRegionNo. ofReservoirsMiscibleTechnically Recoverable(MMBbls)Traditional State ofPractices the ArtNo. ofReservoirsImmiscibleTechnically Recoverable(MMBbls)Traditional State ofPractices the ArtLouisiana 128 1,430 3,250 - - -Mississippi 17 150 330 3 - 20Alabama 4 80 170 1 - *Florida 5 140 330 - - -TOTAL 154 1,800 4,080 4 0 20* Less than 5 MMBbls.4. With “Traditional Practices” CO 2 flooding technology, high CO 2 costsand high risks, very little of the Gulf Coast’s “stranded oil” will becomeeconomically recoverable. Traditional application of miscible CO 2 -EOR technology tothe 154 large reservoirs in the data base would enable 1,800 million barrels of “strandedoil” to become technically recoverable from the Gulf Coast region. However, with thecurrent high costs for CO 2 in the Gulf Coast region (assumed at $1.50 per Mcf), riskssurrounding future oil prices, and uncertainties as to the performance of CO 2 -EORtechnology, very little of this “stranded oil” would become economically recoverable atoil prices of $30 per barrel, as adjusted for gravity and location, Table 4.1-4 February 2006
Table 4. Economically Recoverable <strong>Resources</strong> - Scenario #1: “Traditional Practices” CO 2 -EORRegionNo. ofReservoirsOOIP(Billion Bbls)Economically*Recoverable(# Reservoirs) (MMBbls)Louisiana 128 16.1 1 3Mississippi 17 1.7 - -Alabama 4 0.8 - -Florida 5 1.1 - -TOTAL 154 19.7 1 3*This case assumes an oil price of $30 per barrel, a CO2 cost of $1.50 per Mcf, and a ROR hurdle rate of 25% (before tax).5. Introduction of “State-of-the-art” CO 2 -EOR technology, risk mitigationincentives and lower CO 2 costs would enable 2.6 billion barrels of additional oil tobecome economically recoverable from the Gulf Coast region. With “State-of-theart”CO 2 -EOR technology, and its higher oil recovery efficiency (oil prices of $30/B andCO 2 costs of $1.50/Mcf), 230 million barrels of the oil remaining in the Gulf Coast’s largeoil reservoirs becomes economically recoverable - Scenario #2.Risk mitigation incentives and/or higher oil prices, providing an oil price equal to$40 per barrel, would enable 1,420 million barrels of oil to become economicallyrecoverable from the Gulf Coast’s large oil reservoirs — Scenario #3.With lower cost CO 2 supplies (equal to $0.80 per Mcf, assuming a large-scaleCO 2 collection and transportation system) and incentives for capture of CO 2 emissions,the economic potential increases to 2,290 million barrels — Scenario #4 (Figure 1 andTable 5).1-5 February 2006
Figure 1. Impact of Technology and Financial Conditions on Economically Recoverable Oil from theGulf Coast Region’s Major Reservoirs Using CO 2 -EOR (Million Barrels)Million Barrels of Additional,Economically Recoverable Oil3,5003,0002,5002,0001,5001,0005000“TraditionalPractices”Current Financial Conditions31. High Risk/High Cost CO 2 /Mod. Oil Price2102. Low Technical Risk/High Cost CO 2 /Mod. Oil Price“State of the Art” TechnologyImproved Financial Conditions1,4203. Low Technical/Economic Risk/High Cost CO 2 /High Oil Price2,2904. Low Technical/Economic Risk/Low Cost CO 2 /High Oil Price1. This case assumes an oil price of $30 per barrel, a CO 2cost of $1.50/Mcf and a ROR hurdle rate of 25% (before tax).2. This case assumes an oil price of $30 per barrel, a CO 2cost of $1.50/Mcf and a ROR hurdle rate of 15% (before tax).3. This case assumes an oil price of $40 per barrel, a CO 2cost of $2.00/Mcf and a ROR hurdle rate of 15% (before tax).4. This case assumes an oil price of $40 per barrel, a CO 2cost of $0.80/Mcf and a ROR hurdle rate of 15% (before tax).Table 5. Economically Recoverable <strong>Resources</strong> - Alternative ScenariosScenario #2:“State-of-the-art”Scenario #3:“Risk Mitigation”Scenario #4:“Ample Supplies of CO 2 ”(Moderate Oil Price/High CO 2 Cost)(High Oil Price/High CO 2 Cost)(High Oil Price/Low CO 2 Cost)Region (# Reservoirs) (MMBbls) (# Reservoirs) (MMBbls) (# Reservoirs) (MMBbls)Louisiana 4 130 24 1,120 52 1,920Mississippi 6 80 9 160 13 230Alabama 0 0 1 110 1 110Florida - - 1 30 1 30TOTAL 10 210 35 1,420 67 2,2901-6 February 2006
6. Once the results from the study’s large oil reservoirs data base areextrapolated to the region as a whole, the technically recoverable CO 2 -EORpotential for the Gulf Coast is estimated at nearly 7 billion barrels. The large GulfCoast oil reservoirs examined by the study account for about 57% of the region’s“stranded” oil resource. Extrapolating the 4.1 billion barrels of technically recoverableEOR potential in these oil reservoirs to the total Gulf Coast oil resource provides anestimate of 6.9 billion barrels of technical CO 2 -EOR potential. (However, noextrapolation of economic potential has been estimated, as the development costs ofthe large Gulf Coast oil fields may not reflect the development costs for the smaller oilreservoirs in the region.)7. The ultimate additional oil recovery potential from applying CO2-EOR inthe Gulf Coast will, most likely, prove to be higher than defined by this study.Introduction of more advanced “next generation” CO 2 -EOR technologies still in theresearch or field demonstration stage, such as gravity stable CO 2 injection, extensiveuse of horizontal or multi-lateral wells and CO 2 miscibility and mobility control agents,could significantly increase recoverable oil volumes. These “next generation”technologies would also expand the state’s geologic capacity for storing CO 2 emissions.The benefits and impacts of using “advanced” CO 2 -EOR technology on Gulf Coast oilreservoirs have been examined in a separate study.8. A portion of this CO 2 -EOR potential is already being pursued byoperators in the Gulf Coast region. Five significant EOR projects are currentlyunderway, four in Mississippi (at Little Creek, West and East Mallalieu, McComb andBrookhaven) and one in Florida/Alabama (at Jay/Little Escambia Creek). Together,these five EOR projects have produced or proven about 200 million barrels of the CO 2 -EOR potential set forth in this study.9. Large volumes of CO 2 supplies will be required in the Gulf Coast regionto achieve the CO 2 -EOR potential defined by this study. The overall market forpurchased CO 2 could be over 10 Tcf, plus another 22 Tcf of recycled CO 2 , Table 6.Assuming that the volume of CO 2 stored equals the volume of CO 2 purchased and thatthe bulk of purchased CO 2 is from industrial sources, applying CO 2 -EOR to the Gulf1-7 February 2006
Coast’s oil reservoirs would enable over 460 million metric tonnes of CO 2 emissions tobe stored, greatly reducing greenhouse gas emissions. <strong>Advanced</strong> CO 2 -EOR floodingand CO 2 storage concepts (plus incentives for storing CO 2 ) would significantly increasethis amount.RegionTable 6. Potential CO 2 Supply Requirements in the Gulf Coast Region:Scenario #4 (“Ample Supplies of CO 2 ”)No. ofReservoirsEconomicallyRecoverable(MMBbls)Market forPurchased CO 2(Bcf)Market forRecycled CO 2(Bcf)Louisiana 52 1,920 9,040 18,620Mississippi 13 230 1,000 2,270Alabama 1 110 485 1,140Florida 1 30 140 240TOTAL 67 2,290 10,665 22,27010. Significant supplies of both natural and industrial CO 2 emissions existin the Gulf Coast region, sufficient to meet the CO 2 needs for EOR. The naturalCO 2 deposit at Jackson Dome, Mississippi is estimated to hold between 3 and 12 Tcf ofrecoverable CO 2 . In addition, CO 2 emissions, from gas processing plants, hydrogenplants, ammonia plants and ethylene/ethylene oxide plants could provide 1.5 to 2 Bcfper day of high concentration (relatively low cost) CO 2 , equal to 10 to 15 Tcf of CO 2supply in 20 years. Finally, almost unlimited supplies of low concentration CO 2emissions (equal to over 100 Tcf of CO 2 supply in 20 years) would become availablefrom the large power plants and refineries in the region, assuming affordable CO 2capture technology is developed.11. A public-private partnership will be required to overcome the manybarriers facing large scale application of CO 2 -EOR in the Gulf Coast Region’s oilfields. The challenging nature of the current barriers — lack of sufficient, low-cost CO 2supplies, uncertainties as to how the technology will perform in the Gulf Coast’s1-8 February 2006
complex oil fields, and the considerable market and oil price risks — all argue that apartnership involving the oil production industry, potential CO 2 suppliers andtransporters, the Gulf Coast states and the federal government will be needed toovercome these barriers.12. Many entities will share in the benefits of increased CO 2 -EOR based oilproduction in the Gulf Coast. Successful introduction and wide-scale use of CO 2 -EOR in the Gulf Coast will stimulate increased economic activity, provide new higherpaying jobs, and lead to higher tax revenues for the state. It will also help revive adeclining domestic oil production and service industry.1.4 ACKNOWLEDGEMENTS. <strong>Advanced</strong> <strong>Resources</strong> would like to acknowledgethe most valuable assistance provided to the study by a series of individuals andorganizations in Louisiana, Mississippi, Alabama and Florida.In Louisiana, we would like to thank the Department of Natural <strong>Resources</strong> andparticularly Ms. Jo Ann Dixon, Mineral Production Specialist, for help with using theSONRIS system and accessing data on cumulative oil production. We recognize andappreciate the considerable assistance provided by Ms. Dixon for assembling data byoil fields and oil reservoir. We also fully support efforts to upgrade the SONRIS systemas a data source for independent producers seeking to recover the oil remaining inLouisiana oil reservoirs.In Mississippi, we would like to thank the Mississippi Oil and Gas Board, andspecifically Ms. Juanita Harper and Mr. Jeff Smith for providing data on statewideannual oil production and guidance on field and reservoir level oil production and wellcounts.In Alabama, we would like to thank the Alabama State Oil and Gas Board, inparticular Jack Pashin and Richard Hamilton, for providing the state historical oilproduction data and information on selected oil reservoirs.1-9 February 2006
In Florida, we would like to thank the Florida Department of EnvironmentalProtection, in particular Ed Garrett and David Taylor, for providing statewide oilproduction history and oil field descriptions.Finally, the study would like to acknowledge Mr. William “Clay” Kimbrell ofKimbrell & Associates, LLC, a co-author of SPE 35431, “Screening Criteria forApplication of Carbon Dioxide Miscible Displacement in Waterflooded ReservoirsContaining Light Oil”, who helped identify and explain the information used in his mostvaluable SPE paper.1-10 February 2006
2. INTRODUCTION2.1 CURRENT SITUATION. The Gulf Coast oil producing region addressed inthe report is mature and in decline. Stemming the decline in oil production will be amajor challenge, requiring a coordinated set of actions by numerous parties who have astake in this problem — Gulf Coast state revenue and economic development officials;private, state and federal royalty owners; the Gulf Coast oil production and refiningindustry; the public, and the federal government.The main purpose of this report is to provide information to these “stakeholders”on the potential for pursuing CO2 enhanced oil recovery (CO2-EOR) as one option forslowing and potentially stopping the decline in the Gulf Coast’s oil production.This report, “Basin Oriented Strategies for CO2 Enhanced Oil Recovery:Onshore Gulf Coast Region of Alabama, Florida, Louisiana and Mississippi,” providesinformation on the size of the technical and economic potential for CO2-EOR in the GulfCoast oil producing regions. It also identifies the many barriers — insufficient and costlyCO2 supplies, high market and economic risks, and concerns over technologyperformance — that currently impede the cost-effective application of CO2-EOR in theGulf Coast oil producing region.2.2 BACKGROUND. The onshore Gulf Coast region of Louisiana, Mississippi,Alabama and Florida was, at one time, one of the largest onshore domestic oilproducing regions. With severe declines in crude oil reserves and production capacity,these four areas of the Gulf Coast currently produce only 192 thousand barrels of oil perday (in 2004). However, the deep, light oil reservoirs of this region are ideal candidatesfor miscible carbon dioxide-based enhanced oil recovery (CO2-EOR). The Gulf Coastoil producing region and the concentration of its major oil fields are shown in Figure 2.2-1 February 2006
Figure 2. Location of Major Gulf Coast Oil Fields.Gulf Coast Oil FieldsTNNCOil FieldCounty LineState LineCityARMississippiHuntsvilleBirminghamSCX##### # # ## # ###JacksonMonroe##### ## ##### Louisiana###### ## #### Baton Rouge### ### ####### ### # New Orleans## ###### #### ##### ####### ##### # # ######AlabamaMontgomery#####Mobile#PensacolaGATallahasseeJacksonvilleOrlandoGulf of MexicoTampaFlorida80 0 80 160 240 MilesFort Myers###Miami2-2 February 2006
2.3 PURPOSE. This report, “Basin Oriented Strategies for CO 2 Enhanced OilRecovery: Onshore Gulf Coast Region of Alabama, Florida, Louisiana and Mississippi”is part of a larger effort to examine the enhanced oil recovery and CO 2 storage potentialin key U.S. oil basins. The work involves establishing the geological and reservoircharacteristics of the major oil fields in the region; examining the available CO 2 sources,volumes and costs; calculating oil recovery and CO 2 storage capacity; and, examiningthe economic feasibility of applying CO 2 -EOR. The aim of this report is to provideinformation that could assist: (1) formulating alternative public-private partnershipstrategies for developing lower-cost CO 2 capture technology; (2) launching R&D/pilotprojects of advanced CO 2 flooding technology; and, (3) structuring royalty/tax incentivesand policies that would help accelerate the application of CO 2 -EOR and CO 2 storage.An additional important purpose of the study is to develop a desktop modelingand analytical capability for “basin oriented strategies” that would enable Department ofEnergy/Fossil Energy (DOE/FE) itself to formulate policies and research programs thatwould support increased recovery of domestic oil resources. As such, this desktopmodel complements, but does not duplicate, the more extensive TORIS modelingsystem maintained by DOE/FE’s National Energy Technology Laboratory.2.4 KEY ASSUMPTIONS. For purposes of this study, it is assumed thatsufficient supplies of CO 2 will become available, either by pipeline from natural sourcessuch as Jackson Dome or from the numerous industrial sources in the region. Thesesources include the hydrogen plants and refineries in Lake Charles, Louisiana;Pascagoula, Mississippi; and Tuscaloosa, Alabama, the large gas processing andchemical plants in the region and particularly the major electric power plants in thesefour states. The study assumes that this CO 2 will become available in the near future,before the oil fields in the region are plugged and abandoned.Figure 3 shows the existing pipeline system that transports CO 2 from the naturalCO 2 reservoir at Jackson Dome to the oil fields of central Mississippi and northeasternLouisiana. It also shows the proposed extension of this pipeline system to the oil fields2-3 February 2006
of eastern Mississippi and to southeastern Louisiana. According to a press release inthe fall of 2005, the operator of the Jackson Dome CO 2 reservoir (Denbury <strong>Resources</strong>)has initiated constructing of the 84-mile extension from Jackson Dome to oil fields ineastern Mississippi.Figure 3 also provides a conceptual illustration of a CO 2 pipeline system thatwould transport captured CO 2 emissions from Louisiana’s refinery complex at LakeCharles to the nearby oil fields of Louisiana. Once this primary trunkline is in place,expansion to Alabama’s and Florida’s large oil fields is a possibility. This conceptualindustrial CO 2 pipeline system could link with the existing natural CO 2 pipeline system,providing a more secure overall CO 2 supply system for the Gulf Coast region.2-4 February 2006
Figure 3. Location of Existing and Planned CO 2Supply Pipelines in Mississippi and Louisiana.Gulf Coast Oil Fields## #Oil FieldsExisting Jackson Dome PipelineProposed Jackson Dome PipelineARProposed Lake Charles PipelineLake Charles RefineryCounty LineState LineCity###MississippiAlabamaLouisiana### ## ## ##### ## ## ### # ## # # # # ### ## ## ###### # ## # # # ###### ## ######### #Gulf of Mexico40 0 40 80 120 160 Miles2-5 February 2006
2.5 TECHNICAL OBJECTIVES. The objectives of this study are to examinethe technical and the economic potential of applying CO 2 -EOR in the Gulf Coast oilregion, under two technology options:1. “Traditional Practices” Technology. This involves the continued use of past CO 2flooding and reservoir selection practices. It is distinguished by using miscibleCO 2 -EOR technology in light oil reservoirs and by injecting moderate volumes ofCO 2 , on the order of 0.4 hydrocarbon pore volumes (HCPV), into thesereservoirs. (Immiscible CO 2 is not included in the “Traditional Practices”technology option). Given the still limited application of CO 2 -EOR in this regionand the inherent technical and geologic risks, operators typically add a riskpremium when evaluating this technology option in the Gulf Coast region.2. “State-of-the-art” Technology. This involves bringing to the Gulf Coast thebenefits of recent improvements in the performance of the CO 2 -EOR process andgains in understanding of how best to customize its application to the manydifferent types of oil reservoirs in the region. As further discussed below,moderately deep, light oil reservoirs are selected for miscible CO 2 -EOR and theshallower light oil and the heavier oil reservoirs are targeted for immiscible CO 2 -EOR. “State-of-the-art” technology entails injecting much larger volumes of CO 2 ,on the order of 1 HCPV, with considerable CO 2 recycling.Under “State-of-the-art” technology, with CO 2 injection volumes more than twice aslarge, oil recovery is projected to be higher than reported for past field projects using“Traditional Practices”. The CO 2 injection/oil recovery ratio may also be higher underthis technology option, further spotlighting the importance of lower cost CO 2 supplies.With the benefits of field pilots and pre-commercial field demonstrations, the riskpremium for this technology option and scenario would be reduced to conventionallevels.2-6 February 2006
The set of oil reservoirs to which CO 2 -EOR would be applied fall into two groups, as setforth below:1. Favorable Light Oil Reservoirs Meeting Stringent CO 2 Miscible FloodingCriteria. These are the moderately deep, higher gravity oil reservoirs whereCO 2 becomes miscible (after extraction of hydrocarbon components into theCO 2 phase and solution of CO 2 in the oil phase) with the oil remaining in thereservoir. Typically, reservoirs at depths greater than 3,000 feet and with oilgravities greater than 25 º API would be selected for miscible CO 2 -EOR.Major Gulf Coast light oil fields such as Lake Washington (LA), WestHeidelberg (MS), Citronelle (AL) and Jay (FL) fit into this category. <strong>Advanced</strong><strong>Resources</strong> recognizes that the Jay Field is currently being flooded using N 2 -EOR. Nevertheless, a comparison between N 2 -EOR and CO 2 -EOR could beillustrative. The great bulk of past CO 2 -EOR floods have been conducted inthese types of “favorable reservoirs”.2. Challenging Reservoirs Involving Immiscible Application of CO 2 -EOR. Theseare the moderately heavy oil reservoirs (as well as shallower light oilreservoirs) that do not meet the stringent requirements for miscibility. Thisreservoir set includes the large Gulf Coast oil fields, such as East Heidelberg(MS) and West Eucutta (MS), that still hold a significant portion of theiroriginal oil. Although few, Gulf Coast reservoirs at depths greater than 3,000feet with oil gravities between 17.5 º and 25 º API (or higher) would generallybe included in this category.Combining the technology and oil reservoir options, the following oil reservoir andCO 2 flooding technology matching is applied to the Gulf Coast’s reservoirs amenable toCO 2 -EOR, Table 7.2-7 February 2006
Table 7. Matching of CO 2 -EOR Technology With the Gulf Coast’s Oil ReservoirsCO 2 -EORTechnology Selection“Traditional Practices”;Miscible CO 2 -EOR“State-of-the-art”;Miscible and Immiscible CO 2 -EOROil ReservoirSelection• 154 Deep, Light Oil Reservoirs• 154 Deep, Light Oil Reservoirs• 4 Deep, Moderately Heavy Oil Reservoirs2.6 OTHER ISSUES. This study draws on a series of sources for basic data onthe reservoir properties and the expected technical and economic performance of CO 2 -EOR in the Gulf Coast’s major oil reservoirs. Because of confidentiality and proprietaryissues, the results of the study have been aggregated for the four producing areaswithin the Gulf Coast. As such, reservoir-level data and results are not provided andare not available for general distribution. However, selected non-confidential and nonproprietaryinformation at the field and reservoir level is provided in the report andadditional information could be made available for review, on a case by case basis, toprovide an improved context for the state level reporting of results in this report.2-8 February 2006
3. OVERVIEW OF <strong>GULF</strong> <strong>COAST</strong> OIL PRODUCTION3.1 HISTORY OF OIL PRODUCTION. Oil production for the onshore Gulf Coastregion of United States — encompassing Mississippi, north and south Louisiana,Alabama and Florida — has steadily declined for the past 30 years, Figure 4. Sincereaching a peak in 1970, oil production dropped sharply for the next ten years beforestarting a more gradual decline in the mid 1980s due to secondary recovery efforts. Oilproduction reached a recent low of 70 million barrels (192,000 barrels per day) in 2004.• Louisiana onshore areas, with 45 million barrels of oil produced in 2002, has seenits crude oil proved reserves fall in half in the past 10 years.• Mississippi, with 17 million barrels of oil produced in 2004, has maintained itsproved crude oil reserves and oil production for the past ten years.• Alabama onshore areas, with 5 million barrels of oil produced in 2004 has seen asteady decline in its proven reserves and production in the last ten years.• Florida onshore areas, with 3 million barrels of oil produced in 2004 has also seena steady decline in its proven reserves and production over the past 10 years.Figure 4. Gulf Coast Production Since 1950600500Production (MMbls)400300200100FLALLAMS01950 1956 1962 1968 1974 1980 1986 1992 1998 2004YearJAF02449.PPT3-1 February 2006
However, the Gulf Coast still holds a rich resource of oil in the ground. With 44billion barrels of original oil in-place (OOIP) and approximately 17 billion barrelsexpected to be recovered, 28 billion barrels of oil will be “stranded” due to lack oftechnology, lack of sufficient, affordable CO 2 supplies and high economic and technicalrisks.Table 8 presents the status and annual oil production for the ten largest GulfCoast region oil fields that account for about one fifth of the oil production in this region.The table shows that five of the largest oil fields are in production decline. Arresting thisdecline in the Gulf Coast’s oil production could be attained by applying enhanced oilrecovery technology, particularly CO 2 -EOR.Table 8. Crude Oil Annual Production, Ten Largest Gulf Coast Oil Fields, 2000-2002(Million Barrels per Year)Major Oil Fields 2000 2001 2002ProductionStatusJay, FL* 3.4 3.1 2.5 DecliningWeeks Island, LA 3.4 2.8 2.2 DecliningHeidelberg East, MS 2.0 1.9 1.7 DecliningBlack Bay East, LA 1.3 2.0 1.7 <strong>Inc</strong>reasing/StableLittle Creek, MS* 0.9 1.1 1.5 <strong>Inc</strong>reasingHeidelberg West, MS 1.3 1.3 1.3 StableLake Washington, LA 1.3 1.2 1.2 StableMasters Creek, LA 1.8 1.3 1.0 DecliningCitronelle, AL 1.0 1.0 1.0 StableLaurel, LA 1.1 1.0 0.8 Declining* Fields under EOR operations3-2 February 2006
3.2 EXPERIENCE WITH IMPROVED OIL RECOVERY. Gulf Coast oilproducers are familiar with using technology for improving oil recovery. For example, alarge number of onshore Louisiana oil fields are currently under waterflood recovery andpilot efforts are underway in applying CO 2 for enhanced oil recovery.One of the favorable conditions for the area is that the Gulf Coast contains anatural source of CO 2 at Jackson Dome, Mississippi. This natural source of CO 2enabled CO 2 -EOR to be pilot tested at Weeks Island and Little Creek oil fields by ShellOil in the 1980s. It is also the source for Denbury <strong>Resources</strong>’ CO 2 supplies for a seriesof new field-scale CO 2 projects in Mississippi including Little Creek, Mallalieu andMcComb. Additional discussion of the experience with CO 2 -EOR in the Gulf Coastregion is provided in Chapter 6.3.3 THE “STRANDED OIL” PRIZE. Even though the Gulf Coast’s oil productionis declining, this does not mean that the resource base is depleted. The four regions ofonshore production in the Gulf Coast – Louisiana, Mississippi, Alabama and Florida, stillcontain 62% of their OOIP after primary and secondary oil recovery. This large volumeof remaining oil in-place (ROIP) is the “prize” for CO 2 -EOR.Table 9 provides information on the maturity and oil production history of 8 largeGulf Coast oil fields, each with estimated ultimate recovery of 200 million barrels ormore.3-3 February 2006
Table 9. Selected Major Oil Fields of the Gulf Coast RegionField/StateYearDiscoveredCumulativeProduction(MMBbl)EstimatedPrimary/SecondaryReserves(MMBbl)RemainingOil In-Place(MMBbl)1 JAY – FL* 1970 350 28 352**2 CITRONELLE – AL* 1955 168 7 3623 LAKE WASHINGTON - LA 1931 272 14 3604 LAFITTE - LA 1935 269 7 3295 WEEKS ISLAND - LA 1945 265 19 3476 BAXTERVILLE - MS 1944 253 6 4897 WEST BAY - LA 1940 242 8 3368 GARDEN ISLAND BAY - LA 1935 221 3 262* Alabama and Florida production numbers are for 2004.**70 MMBbls of this is estimated to be recovered with N 2 -EOR3.4 REVIEW OF PRIOR STUDIES. As part of the 1993 to 1997 DOE Class Ireservoir project, “Post Waterflood, CO 2 Flood in a Light Oil, Fluvial Dominated DeltaicReservoir” (which also developed of CO 2 -PROPHET) Louisiana State University studiedthe impact of using miscible CO 2 -EOR in Louisiana. The technical and economicparameters of the study were as follows — recovery factor of 10% ROIP; oil price of$17/Bbl, royalty and taxes of 15%; and CO 2 costs of $0.60/Mcf:• In Louisiana, the investigators began with a data base of 499 light-oilwaterflooded reservoirs to select candidates acceptable for CO 2 -EOR. The database included three reservoirs in which CO 2 miscible flooding was alreadyoccurring — Paradis (Lower 9000 Sand RM), South Pass Block 24 (8800’RD),and West Bay (5 A’B”).3-4 February 2006
• Of the 499 reservoirs screened (representing 5.3 billion Bbl of OOIP), 197 weredeemed acceptable for CO 2 -EOR and 40 were determined to be economic underthe constraints of the study. These 40 reservoirs were estimated to provide arelatively modest volume of incremental oil production — 73 million barrels.The much larger reservoir data base, the improved capability to calculate oilrecovery from miscible and immiscible CO 2 -EOR, and the significantly higher oil pricesused in the study lead to much higher expectations of oil production from Louisianaonshore oil reservoirs.3-5 February 2006
4. MECHANISMS OF CO 2 -EOR4.1 MECHANISMS OF MISCIBLE CO 2 -EOR. Miscible CO 2 -EOR is a multiplecontact process, involving the injected CO 2 and the reservoir’s oil. During this multiplecontact process, CO 2 will vaporize the lighter oil fractions into the injected CO 2 phaseand CO 2 will condense into the reservoir’s oil phase. This leads to two reservoir fluidsthat become miscible (mixing in all parts), with favorable properties of low viscosity, amobile fluid and low interfacial tension.The primary objective of miscible CO 2 -EOR is to remobilize and dramaticallyreduce the after waterflooding residual oil saturation in the reservoir’s pore space.Figure 5 provides a one-dimensional schematic showing the various fluid phasesexisting in the reservoir and the dynamics of the CO 2 miscible process.Figure 5. One-Dimensional Schematic Showing the CO 2 Miscible ProcessMiscibility is Developed in This Region(CO 2 and Oil Form Single Phase)PureCO 2CO 2 VaporizingOil ComponentsCO 2CondensingInto OilOriginalOilDirection of DisplacementJAF02449.PPT4-1 February 2006
4.2 MECHANISMS OF IMMISCIBLE CO 2 -EOR. When insufficient reservoirpressure is available or the reservoir’s oil composition is less favorable (heavier), theinjected CO 2 is immiscible with the reservoir’s oil. As such, another oil displacementmechanism, immiscible CO 2 flooding, occurs. The main mechanisms involved inimmiscible CO 2 flooding are: (1) oil phase swelling, as the oil becomes saturated withCO 2 ; (2) viscosity reduction of the swollen oil and CO 2 mixture; (3) extraction of lighterhydrocarbon into the CO 2 phase; and, (4) fluid drive plus pressure. This combination ofmechanisms enables a portion of the reservoir’s remaining oil to be mobilized andproduced. In general, immiscible CO 2 -EOR is less efficient than miscible CO 2 -EOR inrecovering the oil remaining in the reservoir.4.3 INTERACTIONS BETWEEN INJECTED CO 2 AND RESERVOIR OIL. Theproperties of CO 2 (as is the case for most gases) change with the application ofpressure and temperature. Figures 6A and 6B provide basic information on the changein CO 2 density and viscosity, two important oil recovery mechanisms, as a function ofpressure.Oil swelling is an important oil recovery mechanism, for both miscible andimmiscible CO 2 -EOR. Figures 7A and 7B show the oil swelling (and implied residual oilmobilization) that occurs from: (1) CO 2 injection into a West Texas light reservoir oil;and, (2) CO 2 injection into a very heavy (12 º API) oil reservoir in Turkey. Laboratorywork on the Bradford Field (Pennsylvania) oil reservoir showed that the injection of CO 2 ,at 800 psig, increased the volume of the reservoir’s oil by 50%. Similar laboratory workon Mannville “D” Pool (Canada) reservoir oil showed that the injection of 872 scf of CO 2per barrel of oil (at 1,450 psig) increased the oil volume by 28%, for crude oil alreadysaturated with methane.Viscosity reduction is a second important oil recovery mechanism, particularly forimmiscible CO 2 -EOR. Figure 8 shows the dramatic viscosity reduction of one to twoorders of magnitude (10 to 100 fold) that occur for a reservoir’s oil with the injection ofCO 2 at high pressure.4-2 February 2006
Figure 6A. Carbon Dioxide, CH 4 and N 2 densities at 105 0 F. At high pressures, CO 2 has a densityclose to that of a liquid and much greater than that of either methane or nitrogen. Densities werecalculated with an equation of state (EOS)0.90.8Density, g/cm 30.70.60.50.40.30.20.100 500 1,000 1,500 2,000 2,500 3,000 3,500 4,000Pressure, psiaCO 2CH 4N 2JAF02450.PPTFigure 6B. Carbon Dioxide, CH 4 and N 2 viscosities at 105 0 F. At high pressures, the viscosity of CO 2is also greater then that of methane or nitrogen, although it remains low in comparison to that ofliquids. Viscosities were calculated with an EOS.0.090.08Viscosity, cp0.070.060.050.040.03CO 2CH 4N 20.020.0100 500 1,000 1,500 2,000 2,500 3,000 3,500 4,000Pressure, psiaJAF02450.PPT4-3 February 2006
Figure 7A. Relative Oil Volume vs. Pressure for a Light WestTexas Reservoir Fluid (Holm and Josendal).Figure 7B. Oil Swelling Factor vs. Pressure for a Heavy Oilin Turkey (Issever and Topkoya).1.24Relative Oil Volume,BBL. Oil/BBL. Residual Oil at 60 o F1.71.61.51.41.31.21.1CO 2 SaturatedSeparator OilCO 2 SaturatedReservoir FluidRecombinedReservoir FluidOil Swelling Factor1.221.21.181.161.141.121.11.081.0 0 500 1000 1500 20001.06Pressure, PSIG1.040 500 1000 1500 20002500Pressure, PSIG4-4 February 2006
Figure 8. Viscosity Reduction Versus Saturation Pressure (Simon and Graue).1.0.9Ratio of Altered Viscosity to Original Viscosity.8.7.6.5.4.3.2.10OriginalOilViscosity5105010050010000 1000 2000 3000Saturation Pressure, PSIG4-5 February 2006
5. STUDY METHODOLOGY5.1 OVERVIEW. A seven part methodology was used to assess the CO 2 -EORpotential of the Gulf Coast’s oil reservoirs. The seven steps were: (1) assembling theGulf Coast Major Oil Reservoirs Data Base; (2) screening reservoirs for CO 2 -EOR; (3)calculating the minimum miscibility pressure; (4) calculating oil recovery; (5) assemblingthe cost model; (6) constructing an economics model; and, (7) performing scenarioanalyses.An important objective of the study was the development of a desktop model withanalytic capability for “basin oriented strategies” that would enable DOE/FE to developpolicies and research programs leading to increased recovery and production ofdomestic oil resources. As such, this desktop model complements, but does notduplicate, the more extensive TORIS modeling system maintained by DOE/FE’sNational Energy Technology Laboratory.5.2 ASSEMBLING THE MAJOR OIL RESERVOIRS DATA BASE. The studystarted with the National Petroleum Council (NPC) Public Data Base, maintained byDOE Fossil Energy. The study updated and modified this publicly accessible data baseto develop the Gulf Coast Major Oil Reservoirs Data Base for onshore Louisiana,Mississippi, Alabama and Florida.Table 10 illustrates the oil reservoir data recording format developed by thestudy. The data format readily integrates with the input data required by the CO 2 -EORscreening and oil recovery models, discussed below. Overall, the Gulf Coast Major OilReservoirs Data Base contains 239 reservoirs, accounting for 58.5% of the oil expectedto be ultimately produced in Gulf Coast by primary and secondary oil recoveryprocesses.5-1 February 2006
Table 10. Reservoir Data Format: Major Oil Reservoirs Data BaseBasin NameField NameReservoirReservoir Parameters: TORIS ARI Oil Production TORIS ARI Volumes TORIS ARIArea (A) Producing Wells (active) OOIP (MMbl)Net Pay (ft) Producing Wells (shut-in) Cum P/S Oil (MMbl)Depth (ft) 2003 Production (Mbbl) 2003 P/S Reserves (MMbl)Porosity Daily Prod - Field (Bbl/d) Ult P/S Recovery (MMbl)Reservoir Temp (deg F) Cum Oil Production (MMbbl) Remaining (MMbbl)Initial Pressure (psi) EOY 2003 Oil Reserves (MMbbl) Ultimate Recovered (%)Pressure (psi)Water CutOOIP Volume CheckB oi Water Production Reservoir Volume (AF)B o @ S o , swept 2001 Water Production (Mbbl) Bbl/AFS oi Daily Water (Mbbl/d) OOIP Check (MMbl)S orSwept Zone S o Injection SROIP Volume CheckS wi Injection Wells (active) Reservoir Volume (AF)S w Injection Wells (shut-in) Swept Zone Bbl/AF2003 Water Injection (MMbbl) SROIP Check (MMbbl)API GravityDaily Injection - Field (Mbbl/d)Viscosity (cp)Cum Injection (MMbbl)Daily Inj per Well (Bbl/d)Dykstra-ParsonsROIP Check (MMbl)EORType2003 EOR Production (MMbbls)Cum EOR Production (MMbbls)Reserves (MMbbls)Ultimate Recovery (MMbbls)ROIP Volume Check5-2 February 2006
Considerable effort was required to construct an up-to-date, volumetricallyconsistent data base that contained all of the essential data, formats and interfaces toenable the study to: (1) develop an accurate estimate of the size of the original andremaining oil in-place in the Gulf Coast; (2) reliably screen the reservoirs as to theiramenability for miscible and immiscible CO 2 -EOR; and, (3) provide the CO 2 -PROPHETModel (developed by Texaco for the DOE Class I cost-share program) the essentialinput data for calculating CO 2 injection requirements and oil recovery.5.3 SCREENING RESERVOIRS FOR CO 2 -EOR. The data base was screenedfor reservoirs that would be applicable for CO 2 -EOR. Five prominent screening criteriawere used to identify favorable reservoirs. These were: reservoir depth, oil gravity,reservoir pressure, reservoir temperature, and oil composition. These values wereused to establish the minimum miscibility pressure for conducting miscible CO 2 -EORand for selecting reservoirs that would be amenable to this oil recovery process.Reservoirs not meeting the miscibility pressure standard were considered for immiscibleCO 2 -EOR.The preliminary screening steps involved selecting the deeper oil reservoirs thathad sufficiently high oil gravity. A minimum reservoir depth of 3,000 feet, at the midpointof the reservoir, was used to ensure the reservoir could accommodate highpressure CO 2 injection. A minimum oil gravity of 17.5 º API was used to ensure thereservoir’s oil had sufficient mobility, without requiring thermal injection. Table 11tabulates the oil reservoirs that passed the preliminary screening step. Many of thesefields contain multiple reservoirs, with each reservoir holding a great number of stackedsands. Because of data limitations, this screening study combined the sands into asingle reservoir.5-3 February 2006
Table 11. Gulf Coast Oil Reservoirs Screened Amenable to CO 2 -EORBasin Field FormationA. LouisianaLouisiana COTTON VALLEY BODCAWLouisiana DELHI DELHI ALLLouisiana HAYNESVILLE PETTITLouisiana HAYNESVILLE TOKIOLouisiana HAYNESVILLE EAST BIRDSONG - OWENSLouisiana HAYNESVILLE EAST EAST PETTITLouisiana LISBON PET LIMELouisiana NORTH SHONGALOO - RED ROCK AAALouisiana RODESSA RODESSA ALLLouisiana AVERY ISLAND MEDIUMLouisiana BARATARIA 24 RESERVOIRSLouisiana BAY ST ELAINE 13600 - FT SAND, SEG C & C-1Louisiana BAY ST ELAINE DEEPLouisiana BAYOU SALE SALE DEEPLouisiana BONNET-CARRE OPERCULINOIDESLouisiana CAILLOU ISLAND 9400 IT SAND, RBBICLouisiana CAILLOU ISLAND DEEPLouisiana CECELIA FRIOLouisiana COTE BLANCHE BAY WEST MEDIUMLouisiana COTE BLANCHE BAY WEST WESTLouisiana COTE BLANCHE ISLAND DEEPLouisiana CUT OFF 45 RESERVOIRSLouisiana EGAN CAMERINALouisiana EGAN HAYESLouisiana FIELD 6794 - 6794Louisiana GARDEN ISLAND BAY 177 RESERVOIR ALouisiana GARDEN ISLAND BAY MEDIUMLouisiana GARDEN ISLAND BAY SHALLOWLouisiana GOOD HOPE P-RESEROIVR NO 45900Louisiana GOOD HOPE S-RESERVOIR NO. 54900Louisiana GRAND BAY 10B SAND, FAULT BLOCK A-1Louisiana GRAND BAY 21 SAND, FAULT BLOCK BLouisiana GRAND BAY 2MEDIUMLouisiana GRAND BAY 31 MARKER SAND, FAULT BLOCK ALouisiana GRAND BAY MEDIUMLouisiana GRAND LAKE 873Louisiana GUEYDAN ALLIANCE SANDLouisiana HACKBERRY WEST 2MEDIUMLouisiana HACKBERRY WEST CAMERINA C SAND - FB 55-4 February 2006
Table 11. Gulf Coast Oil Reservoirs Screened Amenable to CO 2 -EORBasin Field FormationLouisiana HACKBERRY WEST MEDIUMLouisiana HACKBERRY WEST OLIGOCENE AMOCO OPERATED ONLYLouisiana LAKE BARRE LB LM2 SULouisiana LAKE BARRE LM1 LB SULouisiana LAKE BARRE UNIT B UPPER M-1 SANDLouisiana LAKE BARRE UPPER MS RESERVOIR DLouisiana LAKE PALOURDE EAST AllLouisiana LAKE PELTO PELTO DEEPLouisiana LAKE WASHINGTON 21 RESERVOIR ALouisiana LAKE WASHINGTON DEEPLouisiana OLD LISBON PETTIT LIMELouisiana PARADIS DEEPLouisiana PARADIS LOWER 9000 FT SAND RMLouisiana PARADIS PARADIS ZONE, SEG A-BLouisiana QUARANTINE BAY 3 SAND, RESERVOIR BLouisiana QUARANTINE BAY 8 SAND, RESERVOIR BLouisiana QUARANTINE BAY MEDIUMLouisiana ROMERE PASS 28 RESERVOIRSLouisiana ROMERE PASS 9700Louisiana SATURDAY ISLAND All othersLouisiana SATURDAY ISLAND 11 RESERVOIRSLouisiana SWEET LAKE All othersLouisiana SWEET LAKE AVG 30 SANDSLouisiana VENICE B-13 SANDLouisiana VENICE B-30 SANDLouisiana VENICE B-6 SANDLouisiana VENICE B-7 SANDLouisiana VENICE M-24 SANDLouisiana WEEKS ISLAND DEEPLouisiana WEEKS ISLAND R-SAND RESERVOIR ALouisiana WEEKS ISLAND S-SAND RESERVOIR ALouisiana WEST BAY 11A SAND (RESERVOIR A)Louisiana WEST BAY 11B SAND FAULT BLOCK BLouisiana WEST BAY 6B RESERVOIR GLouisiana WEST BAY 8A SAND FAULT BLOCK ALouisiana WEST BAY 8AL SANDLouisiana WEST BAY MEDIUMLouisiana WEST BAY PROPOSED WB68 (RG) SAND UNITLouisiana WEST BAY WB 1 (FBA) SULouisiana WEST BAY X-11 (RESERVOIR A)Louisiana WEST BAY X-9 A SAND (RESERVOIR A)5-5 February 2006
Table 11. Gulf Coast Oil Reservoirs Screened Amenable to CO 2 -EORBasin Field FormationLouisiana WEST DELTA BLOCK 83 10100 C SANDLouisiana WHITE LAKE WEST AMPH BLouisiana WHITE LAKE WEST BIG 3-2, RE, RCLouisiana ANSE LABUTTE MIOCENE AMOCO OPERATED ONLYLouisiana BATEMAN LAKE 10400 GRABENLouisiana BLACK BAYOU FRIO SAND, RESERVOIR ALouisiana BLACK BAYOU T-SANDLouisiana BLACK BAYOU RESERVOIR OT SANDLouisiana BLACK BAYOU T2 SAND RESERVOIR FLouisiana BOSCO DISCORBISLouisiana BULLY CAMP TEXTULARLA, RLLouisiana CAILLOU ISLAND UPPER 8000 RA SULouisiana CAILLOU ISLAND 53-C RA SULouisiana CHANDELEUR SOUND BLOCK 0025 BB RA SANDLouisiana CLOVELY M RESERVOIR BLouisiana CLOVELY 50 SAND, FAULT BLOCK VIILouisiana CLOVELY FAULT BLOCK IV NO. 50 SANDLouisiana COTE BLANCHE ISLAND 20 SANDLouisiana COTTON VALLEY BODCAWLouisiana DELHI DELHI ALLLouisiana DELTA DUCK CLUB A SEQ LOWER 6,300’ SANDLouisiana DELTA DUCK CLUB B SEQ LOWER 6,300’ SANDLouisiana DOG LAKE DGL CC RU SU (REVISION)Louisiana ERATH 8,700Louisiana ERATH 7,300 SANDLouisiana FORDOCHE WI2 RALouisiana HAYNESVILLE PETTITLouisiana HAYNESVILLE TOKIOLouisiana HAYNESVILLE EAST EAST PETTITLouisiana HAYNESVILLE EAST BIRDSONG-OWENSLouisiana LAFITTE LOWER SF DENNIS SAND, SEQ HLouisiana LAKE HATCH 9,850 SANDLouisiana LEEVILLE 95 SAND, SEQ BLouisiana LEEVILLE 96 SAND, SEQ BLouisiana LITTLE LAKE E-4 SAND, RES ALouisiana MAIN PASS BLOCK 0035 90 CHANNEL G2Louisiana MAIN PASS BLOCK 0035 G2 RESERVOIR A SAND UNITLouisiana MANILE VILLAGE 29 SANDLouisiana NORTH SHOUGALOO-RED ROCK AAALouisiana LISBON PET LIMELouisiana PARADIS MAIN PAY, SET T5-6 February 2006
Table 11. Gulf Coast Oil Reservoirs Screened Amenable to CO 2 -EORBasin Field FormationLouisiana PHOENIX LAKE BROWN A-1Louisiana PORT BARRE FUTRAL SAND, RESERVOIR ALouisiana QUARANTINE BAY 9A SAND, FAULT BLOCK CLouisiana QUARANTINE BAY 5 SAND, (REF)Louisiana RODESSA RODESSE ALLLouisiana SECTION 28 2 ND HACKBERRY, RESERVOIR DLouisiana SOUTHEAST PASS J-5 SAND RALouisiana SOUTHEAST PASS L RESERVOIR CLouisiana TEPETATE ORTEGO ALouisiana TEPETATE WEST MILLERLouisiana VALENTINE N SAND RESERVOIR ALouisiana VALENTINE VAL N RC SULouisiana VILLE PLATTE RL BASAL COCKFIELDLouisiana VILLE PLATTE RD BASAL COCKFIELDLouisiana VILLE PLATTE MIDDLE COCKFIELD RALouisiana WELSH CAMERINALouisiana WHITE CASTLE 01 RF SULouisiana WHITE LAKE EAST 4- SANDB. MississippiMississippi BAY SPRINGS CVL LOWER COTTON VALLEYMississippi CRANFIELD LOWER TUSCALOOSAMississippi EUCUTTA EAST E_EUTAWMississippi HEIDELBERG, EAST E_CHRISTMASMississippi HEIDELBERG, EAST E_EUTAWMississippi HEIDELBERG, EAST UPPER TUSCALOOSAMississippi HEIDELBERG, WEST W_CHRISTMASMississippi LITTLE CREEK LOWER TUSCALOOSAMississippi MALLALIEU, WEST LOWER TUSCALOOSA WMU CMississippi MCCOMB LOWER TUSCALOOSA BMississippi PACHUTA CREEK, EAST ESOPU RES.Mississippi QUITMAN BAYOU 4600 WILCOXMississippi SOSO BAILEYMississippi TINSLEY SELMA-EUTAW-TUSCALOOSAMississippi TINSLEY E_WOODRUFF SAND EAST SEGMENTMississippi TINSLEY W_WOODRUFF SAND WEST SEGMENTMississippi YELLOW CREEK, WEST EUTAWMississippi EUCUTTA, WEST W_EUTAWMississippi FIELD 13 013Mississippi HEIDELBERG, WEST EUTAW5-7 February 2006
Table 11. Gulf Coast Oil Reservoirs Screened Amenable to CO 2 -EORBasin Field FormationC. AlabamaAlabama CITRONELLE RODESSAAlabama GILBERTOWN LOWER EUTAWAlabama LITTLE ESCAMBIA CREEK SMACKOVERAlabama NORTH FRISCO CITY FRISCO CITYAlabama WOMACK HILL SMACKOVERD. FloridaFlorida BLACKJACK CREEK SMACKOVERFlorida JAY SMACKOVERFlorida RACOON POINT SUNNILANDFlorida SUNNILAND SUNNILANDFlorida WEST FELDA ROBERTS5.4 CALCULATING MINIMUM MISCIBILITY PRESSURE. The miscibility of areservoir’s oil with injected CO 2 is a function of pressure, temperature and thecomposition of the reservoir’s oil. The study’s approach to estimating whether areservoir’s oil will be miscible with CO 2 , given fixed temperature and oil composition,was to determine whether the reservoir would hold sufficient pressure to attainmiscibility. Where oil composition data was missing, a correlation was used fortranslating the reservoir’s oil gravity to oil composition.To determine the minimum miscibility pressure (MMP) for any given reservoir,the study used the Cronquist correlation, Figure 8. This formulation determines MMPbased on reservoir temperature and the molecular weight (MW) of the pentanes andheavier fractions of the reservoir oil, without considering the mole percent of methane.(Most Gulf Coast oil reservoirs have produced the bulk of their methane during primaryand secondary recovery.) The Cronquist correlation is set forth below:(0.744206+0.0011038*MW C5+)MMP = 15.988*TWhere: T is Temperature in º F, and MW C5+ is the molecular weight of pentanesand heavier fractions in the reservoir’s oil.5-8 February 2006
Figure 8. Estimating CO 2 Minimum Miscibility Pressure6000Correlation for CO 2 Minimum Pressure as a Function of Temperature(Mungan, N., Carbon Dioxide Flooding Fundamentals, 1981)Miscibility Pressure, psi500040000.320001000Mole Weight C 5+340 300 280 260 240 220 200180070 110 150 190 230 270Temperature, o FJAF02450.PPTThe temperature of the reservoir was taken from the data base or estimated fromthe thermal gradient in the basin. The molecular weight of the pentanes and heavierfraction of the oil was obtained from the data base or was estimated from a correlativeplot of MW C5+ and oil gravity, shown in Figure 9.The next step was calculating the minimum miscibility pressure (MMP) for agiven reservoir and comparing it to the maximum allowable pressure. The maximumpressure was determined using a pressure gradient of 0.6 psi/foot. If the minimummiscibility pressure was below the maximum injection pressure, the reservoir wasclassified as a miscible flood candidate. Oil reservoirs that did not screen positively formiscible CO 2 -EOR were selected for consideration by immiscible CO 2 -EOR.5-9 February 2006
Figure 9. Correlation of MW C5+ to Tank Oil Gravity.(modified from Mungan, N. Carbon Dioxide Flooding Fundamentals, 1981)500400y = 4247.98641x -0.87022R 2 = 0.99763Molecular WT C5+30020010000 20 40 60 80 100Tank Oil Gravity, o API5.5 CALCULATING OIL RECOVERY. The study utilized CO 2 -PROPHET tocalculate incremental oil produced using CO 2 -EOR. CO 2 -PROPHET was developed bythe Texaco Exploration and Production Technology Department (EPTD) as part of theDOE Class I cost-share program. The specific project was “Post Waterflood CO 2 Floodin a Light Oil, Fluvial Dominated Deltaic Reservoir” (DOE Contract No. DE-FC22-93BC14960). CO 2 -PROPHET was developed as an alternative to the DOE’s CO 2miscible flood predictive model, CO 2 PM. According to the developers of the model,CO 2 -PROPHET has more capabilities and fewer limitations than CO 2 PM. For example,according to the above cited report, CO 2 -PROPHET performs two main operations thatprovide a more robust calculation of oil recovery than available from CO 2 PM:• CO 2 -PROPHET generates streamlines for fluid flow between injection andproduction wells, and5-10 February 2006
• The model performs oil displacement and recovery calculations along theestablished streamlines. (A finite difference routine is used for oildisplacement calculations.)Appendix A discusses, in more detail, the CO 2 -PROPHET model and thecalibration of this model with an industry standard reservoir simulator.Even with these improvements, it is important to note the CO 2 -PROPHET is stillprimarily a “screening-type” model, and lacks some of the key features, such as gravityoverride and compositional changes to fluid phases, available in more sophisticatedreservoir simulators.5.6 ASSEMBLING THE COST MODEL. A detailed, up-to-date CO 2 -EOR CostModel was developed by the study. The model includes costs for: (1) drilling new wellsor reworking existing wells; (2) providing surface equipment for new wells; (3) installingthe CO 2 recycle plant; (4) constructing a CO 2 spur-line from the main CO 2 trunkline tothe oil field; and, (5) various miscellaneous costs.The cost model also accounts for normal well operation and maintenance (O&M),for lifting costs of the produced fluids, and for costs of capturing, separating andreinjecting the produced CO 2 . A variety of CO 2 purchase and reinjection costs optionsare available to the model user. (Appendices B, C, D and E provide state-level detailson the Cost Model for CO 2 -EOR prepared by this study.)5.7 CONSTRUCTING AN ECONOMICS MODEL. The economic model used bythe study is an industry standard cash flow model that can be run on either a pattern ora field-wide basis. The economic model accounts for royalties, severance and advalorem taxes, as well as any oil gravity and market location discounts (or premiums)from the “marker” oil price. A variety of oil prices are available to the model user. Table12 provides an example of the Economic Model for CO 2 -EOR used by the study.5-11 February 2006
Table 12. Economic Model Established by the StudyPattern-Level Cashflow Model<strong>Advanced</strong>State S LA SOUTHField CLOVELLY New Injectors 0.00 21Formation M RESERVOIR B Existing Injectors 0.00Depth 11,900 Convertable Producers 1.00Distance from Trunkline (mi) 10 New Producers 0.0# of Patterns 7 Existing Producers 1.89Miscibility:MiscibleYear 0 1 2 3 4 5 6 7 8 9 10 11CO2 Injection (MMcf) 731 731 731 731 731 731 731 731 696 656 656H2O Injection (Mbw) 183 183 183 183 183 183 183 183 200 220 220Oil Production (Mbbl) - - 76 103 66 61 66 52 46 38 34H2O Production (MBw) 475 475 387 264 258 241 224 218 216 234 242CO2 Production (MMcf) - - 27 264 373 430 461 509 538 524 513CO2 Purchased (MMcf) 731 731 704 466 357 301 270 222 158 132 143CO2 Recycled (MMcf) - - 27 264 373 430 461 509 538 524 513Oil Price ($/Bbl) $ 30.00$ 30.00 $ 30.00 $ 30.00 $ 30.00 $ 30.00 $ 30.00 $ 30.00 $ 30.00 $ 30.00 $ 30.00 $ 30.00Gravity Adjustment 35 Deg $ 28.15 $ 28.15 $ 28.15 $ 28.15 $ 28.15 $ 28.15 $ 28.15 $ 28.15 $ 28.15 $ 28.15 $ 28.15Gross Revenues ($M) $ - $ - $ 2,134 $ 2,885 $ 1,861 $ 1,720 $ 1,844 $ 1,455 $ 1,284 $ 1,056 $ 954Royalty ($M) -12.5% $ - $ - $ (267) $ (361) $ (233) $ (215) $ (230) $ (182) $ (160) $ (132) $ (119)Severance Taxes ($M) -12.5% $ - $ - $ - $ - $ - $ - $ - $ - $ - $ - $ (104)Ad Valorum ($M) -1.0% $ - $ - $ (19) $ (25) $ (16) $ (15) $ (16) $ (13) $ (11) $ (9) $ (8)Net Revenue($M) $ - $ - $ 1,848 $ 2,499 $ 1,612 $ 1,490 $ 1,597 $ 1,261 $ 1,112 $ 914 $ 722Capital Costs ($M)New Well - D&C $-Reworks - Producers to Producers $(438)Reworks - Producers to Injectors $(100)Reworks - Injectors to Injectors $-Surface Equipment (new wells only) $-Recycling Plant $ - $ - $ (1,131) $ - $ - $ - $ - $ - $ - $ - $ - $ -Trunkline Construction $(135)Total Capital Costs $ (672) $ - $ (1,131) $ - $ - $ - $ - $ - $ - $ - $ - $ -CO2 Costs ($M)Total CO2 Cost ($M) $ (1,095.8) $ (1,096) $ (1,063) $ (779) $ (648) $ (580) $ (543) $ (485) $ (398) $ (355) $ (368)O&M CostsOperating & Maintenance ($M) $ (184) $ (184) $ (184) $ (184) $ (184) $ (184) $ (184) $ (184) $ (184) $ (184) $ (184)Lifting Costs ($/bbl) $ 0.25$ (119) $ (119) $ (116) $ (92) $ (81) $ (75) $ (72) $ (68) $ (65) $ (68) $ (69)G&A 20% (61) (61) (60) (55) (53) (52) (51) (50) (50) (50) (51)Total O&M Costs $ (363) $ (363) $ (359) $ (331) $ (318) $ (311) $ (307) $ (301) $ (299) $ (302) $ (303)Net Cash Flow ($M) $ (672) $ (1,459) $ (2,590) $ 426 $ 1,390 $ 646 $ 599 $ 747 $ 474 $ 415 $ 257 $ 50Cum. Cash Flow $ (672) $ (2,131) $ (4,720) $ (4,295) $ (2,905) $ (2,258) $ (1,660) $ (912) $ (438) $ (23) $ 234 $ 284Discount Factor 15% 1.00 0.87 0.76 0.66 0.57 0.50 0.43 0.38 0.33 0.28 0.25 0.21Disc. Net Cash Flow $ (672) $ (1,269) $ (1,958) $ 280 $ 795 $ 321 $ 259 $ 281 $ 155 $ 118 $ 64 $ 11Disc. Cum Cash Flow $ (672) $ (1,941) $ (3,899) $ (3,619) $ (2,824) $ (2,503) $ (2,244) $ (1,963) $ (1,808) $ (1,690) $ (1,626) $ (1,616)NPV (BTx) 25% ($1,963)NPV (BTx) 20% ($1,765)NPV (BTx) 15% ($1,440)NPV (BTx) 10% ($906)IRR (BTx) 4.88%5-12 February 2006
Table 12. Economic Model Established by the Study (cont’d)Pattern-Level Cashflow Model<strong>Advanced</strong>State S LA SOUTHFieldCLOVELLYFormationM RESERVOIR BDepth 11,900Distance from Trunkline (mi) 10# of Patterns 7Miscibility:MiscibleYear 0 12 13 14 15 16 17 18 19 20 21 22 23 24 25CO2 Injection (MMcf) 656 656 656 656 656 656 656 656 656 656 656 518 - -H2O Injection (Mbw) 220 220 220 220 220 220 220 220 220 220 220 289 548 548Oil Production (Mbbl) 34 37 47 46 48 42 33 28 23 19 19 20 20 20H2O Production (MBw) 240 238 221 223 218 217 221 219 227 228 227 234 312 426CO2 Production (MMcf) 519 518 531 531 537 556 570 585 581 588 590 604 540 253CO2 Purchased (MMcf) 137 138 125 125 119 101 87 71 75 68 66 - - -CO2 Recycled (MMcf) 519 518 531 531 537 556 570 585 581 588 590 518 - -Oil Price ($/Bbl) $ 30.00$ 30.00 $ 30.00 $ 30.00 $ 30.00 $ 30.00 $ 30.00 $ 30.00 $ 30.00 $ 30.00 $ 30.00 $ 30.00 $ 30.00 $ 30.00 $ 30.00Gravity Adjustment 35 Deg $ 28.15 $ 28.15 $ 28.15 $ 28.15 $ 28.15 $ 28.15 $ 28.15 $ 28.15 $ 28.15 $ 28.15 $ 28.15 $ 28.15 $ 28.15 $ 28.15Gross Revenues ($M) $ 960 $ 1,033 $ 1,334 $ 1,289 $ 1,362 $ 1,191 $ 929 $ 794 $ 633 $ 532 $ 521 $ 557 $ 552 $ 574Royalty ($M) -12.5% $ (120) $ (129) $ (167) $ (161) $ (170) $ (149) $ (116) $ (99) $ (79) $ (67) $ (65) $ (70) $ (69) $ (72)Severance Taxes ($M) -12.5% $ (105) $ (113) $ (146) $ (141) $ (149) $ (130) $ (102) $ (87) $ (69) $ (58) $ (57) $ (61) $ (60) $ (63)Ad Valorum ($M) -1.0% $ (8) $ (9) $ (12) $ (11) $ (12) $ (10) $ (8) $ (7) $ (6) $ (5) $ (5) $ (5) $ (5) $ (5)Net Revenue($M) $ 727 $ 782 $ 1,010 $ 976 $ 1,031 $ 901 $ 703 $ 601 $ 479 $ 403 $ 394 $ 422 $ 418 $ 435Capital Costs ($M)New Well - D&C $-Reworks - Producers to Producers $(438)Reworks - Producers to Injectors $(100)Reworks - Injectors to Injectors $-Surface Equipment (new wells only) $-Recycling Plant $ - $ - $ - $ - $ - $ - $ - $ - $ - $ - $ - $ - $ - $ - $ -Trunkline Construction $(135)Total Capital Costs $ (672) $ - $ - $ - $ - $ - $ - $ - $ - $ - $ - $ - $ - $ - $ -CO2 Costs ($M)Total CO2 Cost ($M) $ (361) $ (362) $ (347) $ (347) $ (340) $ (317) $ (301) $ (282) $ (287) $ (278) $ (276) $ (155) $ - $ -O&M CostsOperating & Maintenance ($M) $ (184) $ (184) $ (184) $ (184) $ (184) $ (184) $ (184) $ (184) $ (184) $ (184) $ (184) $ (184) $ (184) $ (184)Lifting Costs ($/bbl) $ 0.25$ (68) $ (69) $ (67) $ (67) $ (67) $ (65) $ (63) $ (62) $ (62) $ (62) $ (61) $ (64) $ (98) $ (127)G&A 20% (50) (50) (50) (50) (50) (50) (49) (49) (49) (49) (49) (49) (56) (62)Total O&M Costs $ (303) $ (303) $ (301) $ (301) $ (300) $ (298) $ (297) $ (295) $ (295) $ (294) $ (294) $ (297) $ (337) $ (373)Net Cash Flow ($M) $ (672) $ 63 $ 117 $ 362 $ 328 $ 391 $ 286 $ 106 $ 24 $ (103) $ (170) $ (176) $ (30) $ 80 $ 62Cum. Cash Flow $ (672) $ 347 $ 464 $ 826 $ 1,153 $ 1,545 $ 1,830 $ 1,936 $ 1,960 $ 1,857 $ 1,687 $ 1,511 $ 1,481 $ 1,561 $ 1,623Discount Factor 15% 1.00 0.19 0.16 0.14 0.12 0.11 0.09 0.08 0.07 0.06 0.05 0.05 0.04 0.03 0.03Disc. Net Cash Flow $ (672) $ 12 $ 19 $ 51 $ 40 $ 42 $ 27 $ 9 $ 2 $ (6) $ (9) $ (8) $ (1) $ 3 $ 2Disc. Cum Cash Flow $ (672) $ (1,604) $ (1,585) $ (1,534) $ (1,493) $ (1,452) $ (1,425) $ (1,417) $ (1,415) $ (1,421) $ (1,430) $ (1,438) $ (1,440) $ (1,437) $ (1,435)NPV (BTx) 25% ($1,963)NPV (BTx) 20% ($1,765)NPV (BTx) 15% ($1,440)NPV (BTx) 10% ($906)IRR (BTx) 4.88%5-13 February 2006
Table 12. Economic Model Established by the Study (cont’d)Pattern-Level Cashflow Model<strong>Advanced</strong>State S LA SOUTHFieldCLOVELLYFormationM RESERVOIR BDepth 11,900Distance from Trunkline (mi) 10# of Patterns 7Miscibility:MiscibleYear 0 26 27 28 29 30 31 32 33 34 35 36CO2 Injection (MMcf) - - - - - - - - - - - 15,588H2O Injection (Mbw) 37 - - - - - - - - - - 5,941Oil Production (Mbbl) 2 - - - - - - - - - - 977H2O Production (MBw) 31 - - - - - - - - - - 6,715CO2 Production (MMcf) 13 - - - - - - - - - - 11,155CO2 Purchased (MMcf) - - - - - - - - - - - 5,325CO2 Recycled (MMcf) - - - - - - - - - - - 10,263Oil Price ($/Bbl) $ 30.00$ 30.00 $ - $ - $ - $ - $ - $ - $ - $ - $ - $ -Gravity Adjustment 35 Deg $ 28.15 $ - $ - $ - $ - $ - $ - $ - $ - $ - $ -Gross Revenues ($M) $ 45 $ - $ - $ - $ - $ - $ - $ - $ - $ - $ - $ 27,500Royalty ($M) -12.5% $ (6) $ - $ - $ - $ - $ - $ - $ - $ - $ - $ - $ (3,437)Severance Taxes ($M) -12.5% $ (5) $ - $ - $ - $ - $ - $ - $ - $ - $ - $ - $ (1,450)Ad Valorum ($M) -1.0% $ (0) $ - $ - $ - $ - $ - $ - $ - $ - $ - $ - $ (241)Net Revenue($M) $ 34 $ - $ - $ - $ - $ - $ - $ - $ - $ - $ - $ 22,371Capital Costs ($M)New Well - D&C $ -$ -Reworks - Producers to Producers $ (438)$ (438)Reworks - Producers to Injectors $ (100)$ (100)Reworks - Injectors to Injectors $ -$ -Surface Equipment (new wells only) $ -$ -Recycling Plant $ - $ - $ - $ - $ - $ - $ - $ - $ - $ - $ - $ - $ (1,131)Trunkline Construction $ (135)$ (135)Total Capital Costs $ (672) $ - $ - $ - $ - $ - $ - $ - $ - $ - $ - $ - $ (1,803)CO2 Costs ($M)Total CO2 Cost ($M) $ - $ - $ - $ - $ - $ - $ - $ - $ - $ - $ - $ (11,066)O&M CostsOperating & Maintenance ($M) $ (184) $ - $ - $ - $ - $ - $ - $ - $ - $ - $ - $ (4,777)Lifting Costs ($/bbl) $ 0.25$ (9) $ - $ - $ - $ - $ - $ - $ - $ - $ - $ - $ (1,954)G&A 20% (39) - - - - - - - - - - $ (1,346)Total O&M Costs $ (232) $ - $ - $ - $ - $ - $ - $ - $ - $ - $ - $ (8,077)Net Cash Flow ($M) $ (672) $ (198) $ - $ - $ - $ - $ - $ - $ - $ - $ - $ - $ 1,425Cum. Cash Flow $ (672) $ 1,425 $ 1,425 $ 1,425 $ 1,425 $ 1,425 $ 1,425 $ 1,425 $ 1,425 $ 1,425 $ 1,425 $ 1,425Discount Factor 15% 1.00 0.03 0.02 0.02 0.02 0.02 0.01 0.01 0.01 0.01 0.01 0.01Disc. Net Cash Flow $ (672) $ (5) $ - $ - $ - $ - $ - $ - $ - $ - $ - $ - $ (1,440)Disc. Cum Cash Flow $ (672) $ (1,440) $ (1,440) $ (1,440) $ (1,440) $ (1,440) $ (1,440) $ (1,440) $ (1,440) $ (1,440) $ (1,440) $ (1,440)NPV (BTx) 25% ($1,963)NPV (BTx) 20% ($1,765)NPV (BTx) 15% ($1,440)NPV (BTx) 10% ($906)IRR (BTx) 4.88%5-14 February 2006
5.8 PERFORMING SCENARIO ANALYSES. A series of analyses wereprepared to better understand how differences in oil prices, CO 2 supply costs andfinancial risk hurdles could impact the volumes of oil that would be economicallyproduced by CO 2 -EOR from the Gulf Coast’s oil basins and major oil reservoirs.• Two technology cases were examined. As discussed in more detail in Chapter 2,the study examined the application of two CO 2 -EOR options — “TraditionalPractices” and “State-of-the-art” Technology.• Two oil prices were considered. A $30 per barrel oil price was used to represent themoderate oil price case; a $40 per barrel oil price was used to represent theavailability of federal/state risk sharing and/or the continuation of the current high oilprice situation.• Two CO 2 supply costs were considered. The high CO 2 cost was set at 5% of the oilprice ($1.50 per Mcf at $30 per barrel) to represent the costs of a new transportationsystem bringing natural CO 2 to the Gulf Coast’s oil basins. A lower CO 2 supply costequal to 2% of the oil price ($0.80 per Mcf at $40 per barrel) was included torepresent the potential future availability of low-cost CO 2 from industrial and powerplants as part of CO 2 storage.• Two minimum rate of return (ROR) hurdles were considered, a high ROR of 25%,before tax, and a lower 15% ROR, before tax. The high ROR hurdle incorporates apremium for the market, reservoir and technology risks inherent in using CO 2 -EOR ina new reservoir setting. The lower ROR hurdle represents application of CO 2 -EORafter the geologic and technical risks have been mitigated with a robust program offield pilots and demonstrations.These various technology, oil price, CO 2 supply cost and rate of return hurdles werecombined into four scenarios, as set forth below:5-15 February 2006
• The first scenario captures how CO 2 -EOR technology has been applied and hasperformed in the past. This low technology, high risk scenario, is called “TraditionalPractices”.• The second scenario, entitled “State-of-the-art”, assumes that the technologyprogress in CO 2 -EOR, achieved in the past ten years in other areas, is successfullyapplied to the oil reservoirs of the Gulf Coast. In addition, this scenario assumesthat a comprehensive program of research, pilot tests and field demonstrations willhelp lower the risk inherent in applying new technology to these complex Gulf Coastoil reservoirs.• The third scenario, entitled “Risk Mitigation,” examines how the economic potentialof CO 2 -EOR could be increased through a strategy involving state production taxreductions, federal tax credits, royalty relief and/or higher world oil prices thattogether would add an equivalent $10 per barrel to the price that the producer usesfor making capital investment decisions for CO 2 -EOR.• The final scenario, entitled “Ample Supplies of CO 2 ,” low-cost, “EOR-ready” CO 2supplies are aggregated from various industrial and natural sources. These includeindustrial high-concentration CO 2 emissions from hydrogen facilities, gas processingplants, chemical plants and other sources in the region. These would beaugmented, in the longer-term, from concentrated CO 2 emissions from refineriesand electric power plants. Capture of industrial CO 2 emissions could be part of anational effort for reducing greenhouse gas emissions.5-16 February 2006
6. RESULTS BY STATE6.1 LOUISIANA. Louisiana is a major oil producing state with a rich history ofoil and gas development. Crude oil production began in 1902, and has reached acumulative recovery of 13 billion barrels through 2004. In 2004, Louisiana Onshoreranked 6 th in oil production in the onshore U.S providing 45 MMBbls of oil (123MBbls/day). It has about 27,000 producing oil wells and oil reserves of 362 MMBbls.The bulk of oil production is from the southern portion of the state.Despite still being one of the top oil producing states, Louisiana has seen asignificant decline in production in recent years, Table 13.Table 13. Recent History of Louisiana Onshore Oil ProductionAnnual Oil Production(MMBls/year)(MBbls/day)1999 70 1922000 59 1622001 59 1622002 49 1342003 51 1402004 45 123An active program of secondary oil recovery has helped maintain oil productionin the state. In 1996, more than 300 onshore oil reservoirs in the state of Louisianawere being waterflooded. However, these waterfloods are now mature, with many ofthe fields near their production limits, calling for alternative methods for maintaining oilproduction.6-1 February 2006
###Louisiana Oil Fields. To better understand the potential of using CO 2 -EOR inLouisiana’s light oil fields, this section examines, in more depth, four large oil fields,shown in Figure 11.• Caillou Island (Deep Reservoirs)• Lake Washington (Deep Reservoirs)• Weeks Island (Deep Reservoirs)• West Bay (Medium Reservoirs)Figure 11. Large Louisiana Oil FieldsBaton RougeLarge Louisiana Oil FieldsOil FieldsCounty LineState LineCityWeeks Island, Deep#New Orleans#Caillou Island, Deep#Lake Washington, Deep#West Bay, Medium10 0 10 20 30 40 Miles6-2 February 2006
These four fields, distributed across southern Louisiana, could serve as the“anchor” sites for CO 2 -EOR projects in the southern portion of the state that could laterbe extended to other fields. The cumulative oil production, proved reserves andremaining oil in place (ROIP) for these four large light oil fields are set forth in Table 14.Table 14. Status of Large Oil Louisiana Fields/Reservoirs (as of 2002)Large Fields/ReservoirsOriginalOil In-Place(MMBbls)CumulativeProduction(MMBbls)ProvedPrimary/SecondaryReserves(MMBbls)RemainingOil In-Place(MMBbls)1 Callilou Island (Deep) 1,176 581 7 5882 Lake Washington (Deep) 566 243 12 3113 Weeks Island (Deep) 340 143 10 1874 West Bay (Medium) 325 134 7 183These four large “anchor” fields, each with 180 or more million barrels of ROIP,appear to be favorable for miscible CO 2 -EOR, based on their reservoir properties,Table 15.Table 15. Reservoir Properties and Improved Oil Recovery Activity,Large Louisiana Oil Fields/ReservoirsLarge Fields/ReservoirsDepth(ft)Oil Gravity( º API)Active Waterflood or GasInjection1 Callilou Island (Deep) 13,000 39.0 Undergoing waterflooding2 Lake Washington (Deep) 12,500 26.0 Undergoing waterflooding3 Weeks Island (Deep) 14,000 33.0 Past CO 2 -EOR Project4 West Bay (Medium) 9,000 30.0 Undergoing waterfloodingPast CO 2 -EOR Projects. Past CO 2 -EOR pilot projects in onshore Louisianahave been conducted in Paradis (Lower 9000 Sand RM), Bay St. Elaine (8,000 ft sand),6-3 February 2006
and West Bay (5 A’B”) oil reservoirs. However, perhaps the most notable pilot projecthas been Shell Oil Company’s Weeks Island gravity stable flood, discussed below:Weeks Island. Beginning in 1978, Shell and the U.S. DOE began a CO 2 gravitystable pilot project at the “S” Sand Reservoir B of Weeks Island field. (Weeks Islandfield is a piercement type salt dome, with commercial production from 37 LowerMiocene sands.)• Initial gas injection, containing 853 MMcf of CO 2 (24% HCPV) and 55 MMcf ofnatural gas, lasted from October 1978 until February 1980. This was followed byre-injection of the produced CO 2 and natural gas (at 761 Mcf/d) through 1987.• Early production testing revealed that an oil bank was being mobilized in thewatered out sand, creating an oil bank measured at 57 feet of thickness.• Oil production began in early 1981. By 1987, 261,000 barrels of oil, or 64% ofROIP, had been recovered. Subtracting the mobile oil at the start, the projectmobalized 205,000 barrels of residual oil, equal to 60% of the oil left after waterdisplacement. As such, the pilot project in the “S” Sand Reservoir B at WeeksIsland was considered a success.The full field application of the CO 2 gravity project at Weeks Island was notsuccessful due to inability of the CO 2 injection design to displace the strong bottomwater drive.Bay St. Elane (8000 Foot Reservoir E Sand Unit). A gravity-stable miscible CO 2flood was initiated in the Bay St. Elane (RESU) field in 1981. The purpose of the projectwas to test the effectiveness of CO 2 injection into a steeply dipping (36º), low residual oil(20%) sandstone reservoir.• Approximately 433 MMcf of CO 2 solvent was injected into an up-dip well over a 9month period, resulting in a 0.33 PV CO 2 (plus methane/butane) injection.Approximately 300 MMcf of nitrogen was then injected as the drive gas.6-4 February 2006
• The project expected to recover 75,000 barrels of incremental oil, assuming aresidual oil saturation after CO 2 flooding of 5% and a CO 2 sweep efficiency of53% (based on 75% vertical and 70% areal conformance).• The operator reports that while an oil bank was mobilized and one of theproducing wells flowed at 92% oil cut (previously 100% water cut), there wasdifficulty in producing the oil bank with the existing well placements. Finalperformance results for this innovative CO 2 -EOR project are not available.Immiscible CO 2 (“Huff and Puff”). A series of small scale CO 2 well stimulation(“Huff and Puff”) tests were conducted in the mid-1980’s. This process, similar to usingsteam stimulation in heavy oil fields, involves injecting a substantial volume of CO 2 intoa producing well, allowing the CO 2 to soak into the oil for a few weeks, and thenreturning the well to production. The operators reported that incremental oil recoverieswere achieved at low CO 2 /oil ratios. One such project, Paradis (Main Pay Sand,Reservoir T), was conducted in 1984/1985 and involved injecting two cycles of CO 2 intoa producing well. A total of 39 MMcf of CO 2 was injected resulting in reportedincremental oil recovery of 20,700 barrels. Post project analysis showed that higherCO 2 injection rates would have enabled the CO 2 to contact more of the reservoir’s oil.Future CO 2 -EOR Potential. Louisiana contains 128 reservoirs that arecandidates for miscible CO 2 -EOR. Under “Traditional Practices” (and Base Casefinancial conditions, defined above), there is one economically attractive oil reservoirsfor miscible CO 2 flooding in Louisiana. Applying “State-of-the-art Technology” (involvinghigher volume CO 2 injection) and lower risk financial conditions, the number ofeconomically favorable oil reservoirs in Louisiana increases to 4, providing 129 millionbarrels of additional oil recovery, Table 16.6-5 February 2006
Table 16. Economic Oil Recovery Potential Under Two Technologic Conditions, LouisianaCO 2 -EOR TechnologyOriginalOil In-PlaceTechnicalPotentialNo. ofEconomic Potential*ReservoirsStudied (MMBbls) (MMBbls) (No. of Reservoirs) (MMBbls)“Traditional Practices” 128 16,050 1,429 1 3“State-of-the-art” Technology 128 16,050 3,247 4 129* Oil price of $30 per barrel; CO 2 costs of $1.50/Mcf.Combining “State-of-the-art” technologies with risk mitigation incentives and/orhigher oil prices and lower cost CO 2 supplies would enable CO 2 -EOR in Louisiana torecover 1,916 million barrels of CO 2 -EOR oil (from 52 major reservoirs), Table 17.More Favorable Financial ConditionsTable 17. Economic Oil Recovery Potential withMore Favorable Financial Conditions, LouisianaTechnicalEconomic PotentialPotential(MMBbls) (No. of Reservoirs) (MMBbls)Plus: Risk Mitigation <strong>Inc</strong>entives* 3,247 24 1,117Plus: Low Cost CO 2 Supplies** 3,247 52 1,916* Oil price of $40 per barrel, adjusted for gravity and location differentials; CO2 supply costs, $2/Mcf** CO 2 supply costs, $0.80/Mcf6.2 MISSISSIPPI. Mississippi is the 10 th largest oil producing state, providing17 MMBbls (47 MBbls/day) of oil (in 2004), from about 1,500 producing wells and 178MMBbls of crude oil reserves. Oil production in the state of Mississippi began in 1889,and cumulative oil recovery has reached almost 2.3 billion barrels. Despite havingmany old fields, oil production in Mississippi has remained level in recent years, due toimproved oil recovery efforts, Table 18.6-6 February 2006
Table 18. Recent History of Mississippi Onshore Oil ProductionAnnual Oil Production(MMBbls/year) (MBbls/day)1999 15 412000 18 492001 18 492002 18 492003 16 442004 17 47Denbury <strong>Resources</strong> has been instrumental in revitalizing the aging oil fields ofMississippi. They purchased the Heidelberg field in 1997 from Chevron, a field that hasproduced almost 200 MMBbls of oil since discovery in 1944. Currently, oil production isfrom five waterflood units producing from the Eutaw Formation. Production atHeidelburg in 1997 was approximately 2,800 Bbls/day and has increased to 7,500Bbls/day as a result of waterflooding. In addition, Denbury <strong>Resources</strong> has initiated aseries of CO 2 -EOR projects that produced 6,800 barrels per day in 2004.Mississippi Oil Fields. Mississippi has a number of large oil fields that may beamenable to miscible CO 2 - EOR, Figure 12. These include:• Tinsley (E. Woodruff Sand)• Quitman Bayou (4600 Wilcox)• East Heidelberg (Christmas)These three major oil fields could serve sites for the CO 2 projects that could laterextend to small fields in the state. The cumulative oil production, proved reserves andremaining oil in-place (ROIP) for these three major light oil reservoirs are set forth inTable 19.6-7 February 2006
Figure 12. Large Mississippi Oil FieldsTinsley, E. Woodruff Sand#Large Mississippi Oil FieldsOil FieldsCounty LineState LineCityJackson#Quitman Bayou, 4600 Wilcox#East Heidelberg, Christmas10 0 10 20 30 40 50 MilesTable 19. Status of Large Mississippi Oil Fields/Reservoirs (as of 2002)Large Fields/ReservoirsOriginal OilIn-Place(MMBbls)CumulativeProduction(MMBbls)ProvedPrimary/SecondaryReserves(MMBbls)RemainingOil In-Place(MMBbls)1 Tinsley (E. Woodruff Sand) 163 50 2 1112 Quitman Bayou (4600 Wilcox) 75 21 * 543 East Heidelberg (Christmas) 93 36 6 51*Less than 0.5 MMBbls.6-1 February 2006
These three large oil reservoirs, with 50 to over 100 million barrels of ROIP, areamenable to CO 2 -EOR. Table 20 provides the reservoir and oil properties for thesethree reservoirs and their current secondary oil recovery activities.Table 20. Reservoir Properties and Improved Oil Recovery Activity,Large Mississippi Oil Fields/ReservoirsOilDepth GravityLarge Fields/Reservoirs (ft) ( º API)Active Waterflood or GasInjection1 Tinsley (E. Woodruff Sand) 4,900 33 Active Waterflood2 Quitman Bayou (4600 Wilcox) 4,700 39 Active Waterflood3 East Heidelberg (Christmas) 4,827 25 Active WaterfloodIn addition to the three major light oil reservoirs, several fields in Mississippi havereservoirs containing heavier oils, such as West Heidelberg and West Eucutta. Thesefields could become candidate fields for immiscible CO 2 -EOR, Table 21.Table 21. Reservoir Properties and Improved Oil Recovery Activity Potential, Mississippi“Immiscible-CO 2 ” Oil Fields/ReservoirsCandidateFields/ReservoirsDepth(ft)OilGravity( º API) Active Waterflood or Gas Injection1 West Eucutta (Eutaw) 4,900 23 None2 West Heidelberg (Eutaw) 5,000 22 Active waterfloodPast and Current CO 2 -EOR Projects. Mississippi has also seen an activehistory of CO 2 enhanced oil recovery, particularly at Little Creek and Mallalieu fields inwestern Mississippi.Little Creek (Lower Tuscaloosa Denkman). An experimental CO 2 pilot wasconducted by Shell Oil in the Little Creek oil field from 1974 to 1977. The purpose of6-2 February 2006
this pilot test was to determine the effectiveness of using CO 2 -EOR to recover immobileresidual oil from a thoroughly waterflood depleted, deep (10,400 feet) sandstonereservoir.• The project involved one injection and three producing wells, essentially onequarterof an inverted nine-spot on a 40-acre spacing. The pilot area was confinedby surrounding water injection wells and a field pinchout.• Prior to the CO 2 -flood, the field had recovered 47 million barrels of its 130 millionbarrels initially in place, leaving behind a low 21% residual oil saturation.• A large volume of CO 2 (1,590 MMcf of purchased and 1,783 MMcf of recycledCO 2 ) equal to 1.6 HCPV was first injected and then followed by 1 PV of water.• The pilot produced 124,000 barrels of oil (through March 1978), equal to 21% ofOOIP (and 45% of ROIP). Post-flood reservoir simulation showed that gravitysegregation and lack of vertical conformance reduced the effectiveness of the CO 2flood. Post project reservoir simulation of operating flood on WAG (rather thanstraight CO 2 ) indicated that CO 2 channeling could have been reduced, increasingvolumetric sweep efficiency and oil recovery.• Given the large CO 2 slug and less than optimum sweep efficiency, the project hada high CO 2 to oil ratio of 27 Mcf/Bbl gross and 13 Mcf/Bbl net. The producing well(Well 11-1) closest to the CO 2 injector experienced early CO 2 breakthroughcontributing to the high CO 2 to oil ratio.In 1999, Denbury <strong>Resources</strong> <strong>Inc</strong>. acquired the Little Creek Field and expanded thefield-scale CO 2 flood (started in 1985) to the current 34 injectors and 28 producers.• The CO 2 flood (at Little Creek plus Lazy Creek) is expected to recover 22 millionbarrels of incremental oil (17% OOIP) in addition to 37% from primary/secondaryrecovery operations.• Oil production at the end of 2004 was about 2,990 barrels per day, up from 1,350barrels per day in 1999.West Mallalieu Field Unit (WMU). The West Mallalieu Field (Lower TuscaloosaSand), located in Lincoln Co., MS, has produced 35 million barrels (or 26% of the OOIP)6-3 February 2006
with primary recovery, natural waterflood and a limited CO 2 project. (The existence of astrong natural water drive substituted for the waterflood.) New well drilling, inpreparation for the CO 2 flood, showed that the reservoir was at residual oil saturation.The field has experienced three phases of CO 2 -EOR:1) Initial CO 2 -EOR Project. A CO 2 -EOR pilot was initiated in the WMU by Shell Oilin 1986. The project involved four inverted five-spot patterns surrounded bywater injection barrier wells. By the end of 1988, because only three of theproducers showed oil response, the water injection wells were converted toproduction wells. Oil production, due to CO 2 injection, peaked at 1,200 B/D inmid-1989 and then declined rapidly to about 200 B/D in mid-1991. As of the endof 1997 when the field was shut-in, the WMU had produced 2.1 MMBbls due toCO 2 -EOR.2) Cyclic CO 2 Pilot. In August 2000, in an effort to revitalize the field, J.P. OilCompany initiated a USDOE sponsored cyclic CO 2 pilot involving injection of 63MMcf of CO 2 into one producing well, WMU 17-2B. While all of the injected CO 2was produced back in the next three months, only negligible volumes of liquidwere produced.3) Expanded CO 2 -EOR Project. Following the purchase of the WMU by Denbury<strong>Resources</strong>, in mid-2001, Denbury expanded the initial CO 2 -EOR project byadding four patterns in 2001, four patterns in 2002, three patterns in 2003 andtwo patterns in 2004. (One additional pattern was started at East Mallalieu in2004.)• Initial oil production to CO 2 injection occurred in 2002, with an averageof 718 B/D in the fourth quarter of 2002, reaching 2,712 B/D in thefourth quarter of 2004.• At the end of 2004, Denbury had booked 14.9 MMBbls of provedreserves at E and W Mallalieu fields.6-4 February 2006
• The operator anticipated an EOR oil recovery efficiency in excess of17% OOIP.Other Current CO 2 -EOR Projects. Two recently started CO 2 -EOR projects areunderway in Western Mississippi at McComb and Brookhaven fields. The McCombfield produced 540 B/D in the fourth quarter of 2004 and has 11 million barrels of provedreserves, with upward revisions expected in future years. Oil production response fromthe Brookhaven field is expected in early 2006. The field contains 19 million barrels ofproved reserves. Smaller CO 2 -EOR projects have been conducted in the past atTinsley, Olive and Heidelberg oil fields.Future CO 2 -EOR Potential. Mississippi contains 17 large light oil reservoirsthat are candidates for miscible CO 2 -EOR. In addition, the state has three heavy oilfields, including West Heidelberg, (Eutaw) and West Eucutta, (Eutaw) that could benefitfrom immiscible CO 2 -EOR.Under “Traditional Practices” (involving a small volume of high cost CO 2 injectionand high risk financial conditions), miscible CO 2 flooding would not be economicallyattractive in Mississippi. Applying “State-of-the-art Technology” (involving highervolume CO 2 injection, immiscible EOR, and lower risk), the number of economicallyfeasible oil reservoirs in Mississippi increases to 6, providing 79 million barrels ofadditional oil recovery, Table 22.6-5 February 2006
Table 22. Economic Oil Recovery Potential Under Two Technologic Conditions, MississippiCO 2 -EOR TechnologyOriginalOil In-PlaceTechnicalPotentialNo. ofReservoirsStudied (MMBbls) (MMBbls)EconomicPotential*(No. ofReservoirs) (MMBbls)“Traditional Practices” 17 1,717 152 0 0“State-of-the-art” Technology 20 1,879 351 6 79* Oil price of $30 per barrel; CO 2 costs of $1.50/Mcf.Combining “State-of-the-art” technology with risk mitigation incentives and/orhigher oil prices plus lower cost CO 2 supplies, would enable CO 2 -EOR Mississippi torecover an additional 227 million barrels of CO 2 -EOR oil (from 14 major oil reservoirs),Table 23. A portion of this CO 2 -EOR potential is already being developed inMississippi, as discussed above.Table 23. Economic Oil Recovery Potential with More Favorable Financial Conditions, MississippiMore Favorable Financial ConditionsTechnicalEconomic PotentialPotential(MMBbls) (No. of Reservoirs) (MMBbls)Plus: Risk Mitigation <strong>Inc</strong>entives* 1,879 9 163Plus: Low Cost CO 2 Supplies** 1,879 13 227* Oil price of $40 per barrel, adjusted for gravity and location differentials; CO2 supply costs, $2/Mcfs** CO 2 supply costs, $0.80/Mcf6.3 ALABAMA. Alabama is the 16 th largest oil producing state, providing 5MMBbls (13 MBbls/day) of oil in 2004, from 824 producing wells. Oil production in thestate of Alabama began in 1944, and cumulative oil recovery has reached 0.4 billionbarrels with 52 MMBbls of crude oil reserves. Oil production in Alabama has remainedrelatively stable in recent years, Table 24.6-6 February 2006
Table 24. Recent History of Alabama Onshore Oil ProductionAnnual Oil Production(MMBbls/year) (MBbls/day)1999 6 182000 6 162001 5 152002 5 142003 6 162004 5 13Alabama Fields. Alabama contains several large oil fields that may be amenableto miscible CO 2 -EOR, Figure 13. These include:• Citronelle (Rodessa)• Womack Hill (Smackover)In addition, Alabama contains the deep Little Escambia Creek (Smackover) oilfield (part of the greater Jay oil field) that, while technically amenable to CO 2 -EOR, iscurrently being produced with N 2 -EOR (see discussion under Florida).6-7 February 2006
Figure 13. Large Alabama Oil FieldsLarge Alabama Oil FieldsOil FieldsCounty LineState LineCityMSWomack Hill, Smackover#AL#Citronelle, RodessaLittle Escambia Creek,SmackoverMobilePensacolaFL10 0 10 20 30 40 MilesJAF02449.PPTThe cumulative oil production, proved reserves and remaining oil in-place (ROIP)in these two large oil reservoirs are provided in Table 25.Table 25. Status of Large Alabama Oil Fields/Reservoirs (as of 2004)LargeFields/ReservoirsOriginal OilIn-Place(MMBbls)CumulativeProduction(MMBbls)ProvedPrimary/SecondaryReserves(MMBbls)RemainingOil In-Place(MMBbls)1 Citronelle (Rodessa) 537 168 7 3622 Womack Hill (Smackover) 94 31 2 616-8 February 2006
These two large oil reservoirs, with 60 to 360 million barrels of ROIP, aretechnically amenable for miscible CO 2 -EOR. Table 26 provides the reservoir and oilproperties for these reservoirs and their current oil recovery activities.Table 26. Reservoir Properties and Improved Oil Recovery Activity,Large Alabama Oil Fields/ReservoirsLarge Fields/ReservoirsDepth(ft)OilGravity( º API)Active Waterflood orGas Injection1 Citronelle (Rodessa) 11,085 43 Active waterflood2 Womack Hill (Smackover) 11,432 37 Active waterfloodFuture CO 2 -EOR Potential. Alabama contains 5 oil reservoirs that arecandidates for miscible or immiscible CO 2 -EOR technology. The potential foreconomically developing these oil reservoirs is examined first under Base Casefinancial criteria that combine an oil price of $30 per barrel, CO 2 supply costs($1.50/Mcf), and a high risk rate of return (ROR) hurdle (25% before tax).Under “Traditional Practices” (and Base Case financial conditions, definedabove), CO 2 -EOR would not be economic in Alabama, Table 27. In addition, applying“state-of-the-art” technology (including higher volume CO 2 injection) and the low riskfinancial condition, CO 2 -EOR in Alabama is still not economically favorable.Table 27. Economic Oil Recovery Potential Under Two Technologic Conditions, Alabama.CO 2 -EOR TechnologyOriginalOil In-PlaceTechnicalPotentialNo. ofReservoirs (MMBbls) (MMBbls)EconomicPotential*(No. ofReservoirs) (MMBbls)“Traditional Practices” 4 752 76 0 0“State-of-the-art” Technology 5 807 172 0 0* Oil price of $30 per barrel.6-9 February 2006
Combining “State-of-the-art” technologies with risk mitigation incentives and/orhigher oil prices plus lower cost CO 2 supplies would enable CO 2 -EOR Alabama torecover an additional 111 million barrels of CO 2 -EOR oil (from 1 major oil reservoir),Table 28. (The EOR project at Little Escambia Creek is included in the estimate oftechnical potential but not in the economic potential numbers.)Table 28. Economic Oil Recovery Potential with More Favorable Financial Conditions, AlabamaMore Favorable ConditionsTechnicalEconomic PotentialPotential(MMBbls) (No. of Reservoirs) (MMBbls)Plus: Risk Mitigation* 172 1 111Plus: Low Cost CO 2 ** 172 1 111*Oil price of $40 per barrel, adjusted for gravity differential; CO2 supply costs, $2/Mcf** CO 2 supply costs, to $0.80/Mcf6.3 FLORIDA. Florida is the 20 th largest oil producing state, providing 3 MMBbls(8 MBbls/day) of oil in 2004, from 70 producing wells. Oil production in the state ofFlorida began in 1943, and cumulative oil recovery has reached almost 0.6 billionbarrels. Florida has 68 MMBbls of crude oil reserves, ranking 17 th in the U.S. Oilproduction in Florida has declined in recent years, Table 29.Table 29. Recent History of Florida Onshore Oil ProductionAnnual Oil Production(MMBbls/year) (MBbls/day)1999 5 132000 5 132001 4 122002 4 102003 3 92004 3 86-10 February 2006
Florida Fields. Florida contains two large oil fields that may be amenable tomiscible CO 2 -EOR, Figure 14. These include:• Blackjack Creek (Smackover)• West Felda (Roberts)In addition, Florida contains the deep Jay (Smackover) oil field that, whiletechnically amenable to CO 2 -EOR, is currently being produced with N 2 -EOR.Figure 14. Large Florida Oil Fields# #Jay, SmackoverBlackjack Creek, SmackoverPensacolaJacksonvilleLarge Florida Oil FieldsOil FieldsCounty LineState LineCity40 0 40 80 120 160 MilesTampaFort MyersOrlandoWest Felda,Roberts#The cumulative oil production, proved reserves and remaining oil in-place (ROIP)in these three major oil reservoirs are provided in Table 30.6-11 February 2006
Table 30. Status of Large Florida Oil Fields/Reservoirs (as of 2004)Original OilIn-PlaceCumulativeProductionProvedPrimary/SecondaryReservesRemainingOil In-PlaceLarge Fields/Reservoirs (MMBbls) (MMBbls) (MMBbls) (MMBbls)1 Blackjack Creek (Smackover) 119 57 1 612 West Felda (Roberts) 209 46 6 1573 Jay (Smackover) 730 378 0 352** 70 MMBbls of this is estimated to be recovered by N2-EOR from the Florida portion of this field.These three large oil fields, with 60 to over 300 million barrels of ROIP, aretechnically amenable for miscible CO 2 -EOR. Table 31 provides the reservoir and oilproperties for these reservoirs and their current secondary oil recovery activities.Table 31. Reservoir Properties and Improved Oil Recovery Activity,Large Florida Oil Fields/ReservoirsLarge Fields/ReservoirsDepth(ft)OilGravity( º API)Active Waterflood or GasInjection1 Blackjack Creek (Smackover) 15,700 48 Active Waterflood2 West Felda (Roberts) 11,400 26 None3 Jay (Smackover) 15,400 51 Active N 2 -EORPast CO 2 -EOR Projects. The most notable EOR project in Alabama is at theJay/Little Escambia Creek Field (Smackover Formation), which straddles the Alabama-Florida border. This EOR project involves nitrogen enhanced oil recovery (N 2 -EOR).Jay/Little Escambia Field. ExxonMobil initiated a N 2 miscible WAG flood in 1981following seven years of waterflooding. The target formation (Smackover) is a deep(15,000+ ft), geologically complex carbonate reservoir. Favorable geologiccharacteristics (natural vertical flow restrictions) and the use state-of-the-art6-12 February 2006
technologies provide expectations of 10% OOIP oil recovery due to N 2 injection andoverall 60% OOIP recovery from the field.Evaluation of applying CO 2 -EOR to the Jay/Little Escambia oil field indicatespotential recovery of about 20% OOIP about twice the volume currently expected fromN 2 -EOR. However, the high cost of adding deep CO 2 injection and oil production wellsindicates that, at the oil prices and CO 2 costs examined by the study, the economics ofCO 2 -EOR in this oil field may be marginal.Future CO 2 -EOR Potential. Florida contains 5 light oil reservoirs that arecandidates for miscible CO 2 -EOR technology. The potential for economicallydeveloping these oil reservoirs is examined first under Base Case financial criteria thatcombine an oil price of $30 per barrel, CO 2 supply costs ($1.50/Mcf), and a high riskrate of return (ROR) hurdle (25% before tax).Under “Traditional Practices” or “State-of-the Art” technology (and Base Casefinancial conditions, defined above), CO 2 -EOR would not be economic in Alabama,Table 32.Table 32. Economic Oil Recovery Potential Under Two Technologic Conditions, FloridaCO 2 -EOR TechnologyOriginalOil In-PlaceTechnicalPotentialNo. ofReservoirsStudied (MMBbls) (MMBbls)EconomicPotential*(No. ofReservoirs) (MMBbls)“Traditional Practices” 5 1,265 141 0 0“State-of-the-art” Technology* 5 1,265 329 0 0* Oil price of $30 per barrel.Combining “State-of-the-art” technologies with risk mitigation incentives and/orhigher oil prices plus lower cost CO 2 supplies would enable Florida to recover anadditional 29 million barrels of CO 2 -EOR oil (from 1 major oil reservoir), Table 33. (TheEOR project at Jay is included in the estimate of technical potential, but not in theeconomic potential numbers.)6-13 February 2006
Table 33. Economic Oil Recovery Potential with More Favorable Financial Conditions, FloridaMore Favorable ConditionsTechnicalEconomic PotentialPotential(MMBbls) (No. of Reservoirs) (MMBbls)Plus: Risk Mitigation* 329 1 29Plus: Low Cost CO 2 ** 329 1 29* Oil price of $40 per barrel, adjusted for gravity differential; CO2 supply costs, $2/Mcf** CO 2 supply costs, $0.80/Mcf6-14 February 2006
Appendix AUsing CO 2 -PROPHET forEstimating Oil Recovery
Model DevelopmentThe study utilized the CO 2 -PROPHET model to calculate the incremental oilproduced by CO 2 -EOR from the large Gulf Coast Basin oil reservoirs. CO 2 -PROPHETwas developed by the Texaco Exploration and Production Technology Department(EPTD) as part of the DOE Class I cost share program. The specific project was “PostWaterflood CO 2 Flood in a Light Oil, Fluvial Dominated Deltaic Reservoir” (DOEContract No. DE-FC22-93BC14960). CO 2 -PROPHET was developed as an alternativeto the DOE’s CO 2 miscible flood predictive model, CO 2 PM.Input Data RequirementsThe input reservoir data for operating CO 2 -PROPHET are from the Major OilReservoirs Data Base. Default values exist for input fields lacking data. Key reservoirproperties that directly influence oil recovery are:• Residual oil saturation,• Dykstra-Parsons coefficient,• Oil and water viscosity,• Reservoir pressure and temperature, and• Minimum miscibility pressure.A set of three relative permeability curves for water, CO 2 and oil are provided (or can bemodified) to ensure proper operation of the model.Calibrating CO 2 -PROPHETThe CO 2 -PROPHET model was calibrated by <strong>Advanced</strong> <strong>Resources</strong> with anindustry standard reservoir simulator, GEM. The primary reason for the calibration wasto determine the impact on oil recovery of alternative permeability distributions within amulti-layer reservoir. A second reason was to better understand how the absence of agravity override function in CO 2 -PROPHET might influence the calculation of oilrecovery. CO 2 -PROPHET assumes a fining upward permeability structure.A-1 February 2006
The California San Joaquin Basin‘s Elk Hills (Stevens) reservoir data set was used forthe calibration. The model was run in the miscible CO 2 -EOR model using onehydrocarbon pore volume of CO 2 injection.The initial comparison of CO 2 -PROPHET with GEM was with fining upward andcoarsening upward (opposite of fining upward) permeability cases in GEM. All otherreservoir, fluid and operational specifications were kept the same. As Figure A-1depicts, the CO 2 -PROPHET output is bounded by the two GEM reservoir simulationcases of alternative reservoir permeability structures in an oil reservoir.A second comparison of CO 2 -PROPHET and GEM was for randomized permeability(within the reservoir modeled with multiple layers). The two GEM cases are HighRandom, where the highest permeability value is at the top of the reservoir, and LowRandom, where the lowest permeability is at the top of the reservoir. The permeabilityvalues for the other reservoir layers are randomly distributed among the remaininglayers. As Figure A-2 shows, the CO 2 -PROPHET results are within the envelope of thetwo GEM reservoir simulation cases of random reservoir permeability structures in an oilreservoir.Based on the calibration, the CO 2 -PROPHET model seems to internally compensate forthe lack of a gravity override feature and appears to provide an average calculation ofoil recovery, neither overly pessimistic nor overly optimistic. As such, CO 2 -PROPHETseems well suited for what it was designed — providing project scoping and preliminaryresults to be verified with more advanced evaluation and simulation models.Comparison of CO 2 -PROPHET and CO 2 PMAccording to the CO 2 -PROPHET developers, the model performs two mainoperations that provide a more robust calculation of oil recovery than available fromCO 2 PM:A-2 February 2006
Figure A-1. CO2-PROPHET and GEM: Comparison to Upward Finingand Coarsening Permeability Cases of GEM1,000,000900,000800,000ProphetFining UpwardCoarsening Upward700,000Cum Oil (BBLS)600,000500,000400,000300,000200,000100,000012/5/2003 12/4/2007 12/3/2011 12/2/2015 12/1/2019 11/30/2023 11/29/2027TimeFigure A-2. CO 2 -PROPHET and GEM: Comparison to Random Permeability Cases of GEM1,000,000900,000800,000ProphetHigh RandomLow Random700,000Cum Oil (BBLS)600,000500,000400,000300,000200,000100,000JAF02318.PPT012/5/2003 12/4/2007 12/3/2011 12/2/2015 12/1/2019 11/30/2023 11/29/2027TimeA-3 February 2006
• CO 2 -PROPHET generates streamlines for fluid flow between injection andproduction wells, and• The model then performs oil displacement and recovery calculations alongthe streamlines. (A finite difference routine is used for the oil displacementcalculations.)Other key features of CO 2 -PROPHET and its comparison with the technical capability ofCO 2 PM are also set forth below:• Areal sweep efficiency in CO 2 -PROPHET is handled by incorporatingstreamlines that are a function of well spacing, mobility ratio and reservoirheterogeneity, thus eliminating the need for using empirical correlations, asincorporated into CO 2 PM.• Mixing parameters, as defined by Todd and Longstaff, are used in CO 2 -PROPHET for simulation of the miscible CO 2 process, particularly CO 2 /oilmixing and the viscous fingering of CO 2 .• A series of reservoir patterns, including 5 spot, line drive, and inverted 9spot, among others, are available in CO 2 -PROPHET, expanding on the 5spot only reservoir pattern option available in CO 2 PM.• CO 2 -PROPHET can simulate a variety of recovery processes, includingcontinuous miscible CO 2 , WAG miscible CO 2 and immiscible CO 2 , as wellas waterflooding. CO 2 PM is limited to miscible CO 2 .A-4 February 2006
Appendix BLouisiana CO 2 -EORCost Model
Cost Model for CO 2 -Based Enhanced Oil Recovery (CO 2 -EOR)This appendix provides documentation for the cost module of the desktop CO 2 -EOR policy and analytical model (COTWO) developed by <strong>Advanced</strong> <strong>Resources</strong> forDOE/FE-HQ. The sections of this cost documentation report are organized according tothe normal sequence of estimating the capital and operating expenditures for a CO 2 -EOR project:1. Well Drilling and Completion Costs. The costs for well drilling and completion (D&C)are based on the 2001 JAS cost study recently published by API for Louisiana.The well D&C cost equation has a fixed cost constant for site preparation and otherfixed cost items and a variable cost equation that increases exponentially with depth.The total equation is:Well D&C Costs = a 0 D a 1Where: a 0 is 0.1933 (South) or 2.7405 (North), depending on locationa 1 is 1.8234 (South) or 1.3665 (North), depending on locationD is well depthFigure B-1a and Figure B-1b provides the details for the cost equation and illustratesthe “goodness of fit” for the well D&C cost equation for Louisiana.Figure B-1a. – Oil Well D&C Costs for South Louisiana8,000,000Total Drilling Cost, US$7,000,0006,000,0005,000,0004,000,0003,000,0002,000,0002003 API CostsPower (2003 API Costs)y = 0.1933x 1.8234R 2 = 0.97241,000,00000 2,000 4,000 6,000 8,000 10,000 12,000 14,000 16,000Depth, ftB-1 February 2006
Figure B-1b. Oil Well D&C Costs for North Louisiana1,000,000900,000800,0002003 API CostsPower (2003 API Costs)Total Drilling Cost, US$700,000600,000500,000400,000300,000200,000y = 2.7405x 1.3665R 2 = 0.9434100,00000 1,000 2,000 3,000 4,000 5,000 6,000 7,000 8,000 9,000 10,000Depth, ftIn order to bring the 2003 API drilling costs (the most recent available) into 2004numbers where increased oil prices are expected to result in significantly increaseddrilling costs, a relationship was established between average drilling costs and averageannual oil prices. Drillings costs from the ten year period of 1994-2003 (API data) wereplotted versus the three year weighted average annual oil prices for those years (EIAAnnual Energy Review, 2004) and the following relationship was established:Drilling costs (per foot) = $5.04(annual oil price) – $3.2116.Applying the 2004 average oil price of $36.77 gives a drilling cost of $182 per foot andan increase of 25.6% over the 2003 cost of $145 per foot. Therefore, drilling andcompletion costs were increased by 25% over the Louisiana D&C cost calculations toreflect this increase in 2004 drilling costs.2. Lease Equipment Costs for New Producing Wells. The costs for equipping a new oilproduction well are based on data reported by the EIA in their 2004 EIA “Cost andIndices for Domestic Oil and Gas Field Equipment and Production Operations” report.This survey provides estimated lease equipment costs for 10 wells producing withartificial lift, from depths ranging from 2,000 to 12,000 feet, into a central tank battery.The equation contains a fixed cost constant for common cost items, such as free waterknock-out, water disposal and electrification, and a variable cost component to capturedepth-related costs such as for pumping equipment. The total equation is:Production Well Equipping Costs = c 0 + c 1 DB-2 February 2006
Where:c o = $81,403 (fixed)c 1 = $7.033 per footD is well depthFigure B-2 illustrates the application of the lease equipping cost equation for a new oilproduction well as a function of depth.Figure B-2. Lease Equipping Cost for a New Oil Production Wellin Louisiana vs. Depth200,000160,000Total Costs, US$120,00080,000y = 7.033x + 81403R 2 = 0.942840,00000 2,000 4,000 6,000 8,000 10,000 12,000 14,000Depth, ft3. Lease Equipment Costs for New Injection Wells. The costs for equipping a newinjection well in Louisiana include gathering lines, a header, electrical service as well asa water pumping system. The costs are estimated from the EIA Cost and IndicesReport.Equipment costs include a fixed cost component and a depth-related cost component,which varies based on surface pressure requirements. The equation for Louisiana is:Injection Well Equipping Costs = c 0 + c 1 DWhere: c o = $17,214 (fixed)c 1 = $16.34 per footD is well depthB-3 February 2006
Figure B-3 illustrates the application of the lease equipping cost equation for a newinjection well as a function of depth for West Texas. The West Texas cost data forlease equipment provides the foundation for the Louisiana cost equation.Figure B-3. Lease Equipping Costs for a New Injection Well inWest Texas vs. Depth140,000120,000100,000CostsLinear (Costs)y = 14.63x + 9277.3R 2 = 0.9674Costs, US$80,00060,00040,00020,000Ratio to W. TXBasin co c1 co c1US$US$/ftW TX 1.00 1.00 9,277 14.63CA 0.80 2.10 7,463 30.73RM 1.51 0.83 14,051 12.11S TX 1.68 1.19 15,555 17.40LA 1.86 1.12 17,214 16.34OK 1.17 1.12 10,820 16.3300 1,000 2,000 3,000 4,000 5,000 6,000 7,000 8,000 9,000Depth, ft4. Converting Existing Production Wells into Injection Wells. The conversion of existingoil production wells into CO 2 and water injection wells requires replacing the tubingstring and adding distribution lines and headers. The costs assume that all surfaceequipment necessary for water injection are already in place on the lease.The existing well conversion costs include a fixed cost component and a depth-relatedcost component, which varies based on the required surface pressure and tubinglength. The equation for Louisiana is:Well Conversion Costs = c 0 + c 1 DWhere: c o = $16,607 (fixed)c 1 = $6.973 per footD is well depthFigure B-4 illustrates the average cost of converting an existing producer into aninjection well for West Texas. The West Texas cost data for converting wells providethe foundation for the Louisiana cost equation.B-4 February 2006
Figure B-4. Cost of Converting Existing Production Wells intoInjection Wells in West Texas vs. Depth70,00060,000y = 6.2412x + 8950R 2 = 0.989650,000Cost, US$40,00030,00020,00010,000Ratio to W. TXBasin c o c 1 c o c 1US$US$/ftW TX 1.00 1.00 8,950 6.24CA 0.80 2.10 7,200 13.11RM 1.51 0.83 13,555 5.16S TX 1.68 1.19 15,006 7.42LA 1.86 1.12 16,607 6.97OK 1.17 1.12 10,438 6.9700 1000 2000 3000 4000 5000 6000 7000 8000 9000Depth, ft5. Costs of Reworking an Existing Waterflood Production or Injection Well for CO 2 -EOR(First Rework). The reworking of existing oil production or CO 2 -EOR injection wellsrequires pulling and replacing the tubing string and pumping equipment. The wellreworking costs are depth-dependent. The equation for Louisiana is:Well Rework Costs = c 1 DWhere: c 1 = $19.42 per foot)D is well depthFigure B-5 illustrates the average cost of well conversion as a function of depth for WestTexas. The West Texas cost data for reworking wells provides the foundation for theLouisiana cost equation.B-5 February 2006
Figure B-5. Cost of an Existing Waterflood Production or InjectionWell for CO 2 -EOR in West Texas vs. Depth160,000140,000120,000ReworkLinear (Rework)y = 17.38xR 2 = 0.9545Costs, US$100,00080,00060,00040,00020,0000Ratio to W. TXBasin c o c 1 c o c 1US$US$/ftW TX 1.00 1.00 0 17.38CA 0.80 2.10 0 36.51RM 1.51 0.83 0 14.38S TX 1.68 1.19 0 20.67LA 1.86 1.12 0 19.42OK 1.17 1.12 0 19.410 1000 2000 3000 4000 5000 6000 7000 8000 9000Depth, ft6. Annual O&M Costs, <strong>Inc</strong>luding Periodic Well Workovers. The EIA Cost and Indicesreport provides secondary operating and maintenance (O&M) costs only for WestTexas. As such, West Texas and Louisiana primary oil production O&M costs (FigureB-6) are used to estimate Louisiana secondary recovery O&M costs. Linear trends areused to identify fixed cost constants and variable cost constants for each region, TableB-1.B-6 February 2006
Figure B-6. Annual Lease O&M Costs for Primary Oil Production by Area80,00070,00060,000CaliforniaSouth LouisianaWest TexasLinear (California)Linear (West Texas)Linear (South Texas)OklahomaSouth TexasRocky MountainsLinear (South Louisiana)Linear (Oklahoma)Linear (Rocky Mountains)Total Costs, US$ per Year50,00040,00030,00020,000y = 2.8014x + 16401R 2 = 0.9611y = 5.2672x + 7110.7R 2 = 0.994510,000y = 2.5075x + 8838.5R 2 = 0.96y = 2.7997x + 10309R 2 = 0.9789y = 2.9819x + 14820R 2 = 0.9637y = 2.0751x + 13387R 2 = 0.978300 2,000 4,000 6,000 8,000 10,000 12,000 14,000Depth, ftTable B-1. Regional Lease O&M Costs and Their Relationship to West TexasRatio to W. TXBasin c0 c1 c0 c1US$US$West Texas 8,839 2.51 1.00 1.00California 7,111 5.27 0.80 2.10Rocky Mountain 13,387 2.08 1.51 0.83South Texas 14,820 2.98 1.68 1.19Louisiana 16,401 2.80 1.86 1.12Oklahoma 10,309 2.80 1.17 1.12To account for the O&M cost differences between waterflooding and CO 2 -EOR, twoadjustments are made to the EIA’s reported O&M costs for secondary recovery.Workover costs, reported as surface and subsurface maintenance, are doubled toreflect the need for more frequent remedial well work in CO 2 -EOR projects. Liquid liftingare subtracted from annual waterflood O&M costs to allow for the more rigorousaccounting of liquid lifting volumes and costs for CO 2 -EOR. (Liquid lifting costs for CO 2 -EOR are discussed in a later section of this appendix.)Figure B-7 shows the depth-relationship for CO 2 -EOR O&M costs in West Texas.These costs were adjusted to develop O&M for Louisiana, shown in the inset of FigureB-7. The equation for Louisiana is:B-7 February 2006
Well O&M Costs = b 0 + b 1 DWhere: b 0 = $38,447 (fixed)b 1 = $8.72 per footD is well depthFigure B-7. Annual CO 2 -EOR O&M Costs for West Texas70,00060,000CO2-EOR O&MLinear (CO2-EOR O&M)Costs per Year, US$50,00040,00030,00020,00010,0000y = 7.8054x + 1557R 2 = 0.9935Ratio to W. TXArea b0 b1 b0 b1US$US$W TX 1.00 1.00 20,720 7.81CA 0.80 2.10 16,669 16.40RM 1.51 0.83 31,381 6.46S TX 1.68 1.19 34,740 9.28LA 1.86 1.12 38,447 8.72OK 1.17 1.12 24,166 8.710 1,000 2,000 3,000 4,000 5,000 6,000 7,000 8,000 9,000Depth, ft7. CO 2 Recycle Plant Investment Cost. Operation of CO 2 -EOR requires a recyclingplant to capture and reinject the produced CO 2 . The size of the recycle plant is basedon peak CO 2 production and recycling requirements.The cost of the recycling plant is set at $700,000 per MMcf/d of CO 2 capacity. As such,small CO 2 -EOR project in the Tokio formation of the Haynesville field, with 16 MMcf/d ofCO 2 reinjection, will require a recycling plant costing $11 million. A large project in theDelhi field, with 177 MMcf/d of peak CO 2 reinjection and 112 injectors requires arecycling plant costing $124 million.The model has three options for installing a CO 2 recycling plant. The default settingcosts the entire plant one year prior to CO 2 breakthrough. The second option placesthe full CO 2 recycle plant cost at the beginning of the project (Year 0). The third optioninstalls the CO 2 recycle plant in stages. In this case, half the plant is built (and half thecost is incurred) in the year of CO 2 breakthrough. The second half of the plant is builtwhen maximum recycle capacity requirements are reached.8. Other COTWO Model Costs.B-8 February 2006
a. CO 2 Recycle O&M Costs. The O&M costs of CO 2 recycling are indexed toenergy costs and set at 1% of the oil price ($0.25 per Mcf @ $25 Bbl oil).b. Lifting Costs. Liquid (oil and water) lifting costs are calculated on total liquidproduction and costed at $0.25 per barrel. This cost includes liquid lifting, transportationand re-injection.c. CO 2 Distribution Costs. The CO 2 distribution system is similar to the gatheringsystems used for natural gas. A distribution “hub” is constructed with smaller pipelinesdelivering purchased CO 2 to the project site.The distribution pipeline cost is dependent on the injection requirements for the project.The fixed component is $150,000. The variable cost component accounts forincreasing piping diameters associated with increasing CO 2 injection requirements.These range from $80,000 per mile for 4” pipe (CO 2 rate less than 15MMcf/d), $120,000per mile for 6” pipe (CO 2 rate of 15 to 35 MMcf/d), $160,000 per mile for 8” pipe (CO 2rate of 35 to 60 MMcf/d), and $200,000 per mile for pipe greater than 8” diameter (CO 2rate greater than 60 MMcf/d). Aside from the injection volume, costs also depend onthe distance from the CO 2 “hub” (transfer point) to the oil field. Currently, the distance isset at 10 miles.The CO 2 distribution cost equation for Louisiana is:Pipeline Construction Costs = $150,000 + C D *DistanceWhere: C D is the cost per mile of the necessary pipe diameter (from the CO 2injection rate)Distance = 10.0 milesd. G&A Costs. General and administrative (G&A) costs of 20% are added to wellO&M and lifting costs.e. Royalties. Royalty payments are assumed to be 12.5%.f. Production Taxes. Louisiana has enacted risk sharing actions forenhanced oil recovery. The Louisiana Revenue Statute Ann. 47:633.4 is effectiveas of July, 1984 with no sunset. Its stated goal is:“To provide an economic incentive to producers to invest in tertiaryrecovery projects to enhance Louisiana’s crude oil production, to theultimate benefit of the state and the people.”The provisions of the “Tertiary Recovery Statute” are that no severance tax shall be dueon production from a qualified tertiary recovery project approved by the Secretary of theDepartment of Natural <strong>Resources</strong> until the project has reached payout. Payout iscalculated using investment costs; expenses particular to the tertiary project, not toB-9 February 2006
include charges attributed to primary and secondary options on that reservoir; andinterest at commercial rates.The regular state oil severance tax rate in Louisiana is 12.5% of the value of theproduced oil. As such, eliminating the severance tax until payout for CO 2 -EOR projectswould provide front-end risk sharing equal to $3.28 per barrel of incrementally producedoil (assuming a sales price of $30 per barrel of oil and a royalty rate of 12.5%).To the extent that this reduction in state severance taxes stimulates new projects andincremental oil production that otherwise would not occur, the State of Louisiana gainssubstantial new tax revenues. In the model, Severance and ad valorum taxes are set at1% and 12.5% (after payout), respectively, for a total production tax of 13.5% on the oilproduction stream. Production taxes are taken following royalty payments.g. Crude Oil Price Differential. To account for market and oil quality (gravity)differences on the realized oil price, the cost model incorporated the current basisdifferential for Louisiana (-$0.60 per barrel) and the current gravity differential (-$0.25per º API, from a basis of 40 º API) into the average wellhead oil price realized by each oilreservoir. The equation for Louisiana is:Wellhead Oil Price = Oil Price + (-$0.60) – [$0.25*(40 - º API)]Where: Oil Price is the marker oil price (West Texas intermediate)º API is oil gravityIf the oil gravity is less than 40 º API, the wellhead oil price is reduced; if the oilgravity is greater than 40 º API, the wellhead oil price is increased. In addition, somefields within Louisiana contain very light oil (>45 API). In order to keep the economics ofthese fields level with the rest of the fields, we imposed a ceiling of 45 API for all fieldswith lighter oil when applying the Crude Oil Price Differential.B-10 February 2006
Appendix CMississippi CO 2 -EORCost Model
Cost Model for CO 2 -Based Enhanced Oil Recovery (CO 2 -EOR)This appendix provides documentation for the cost module of the desktop CO 2 -EOR policy and analytical model (COTWO) developed by <strong>Advanced</strong> <strong>Resources</strong> forDOE/FE-HQ. The sections of this cost documentation report are organized according tothe normal sequence of estimating the capital and operating expenditures for a CO 2 -EOR project:1. Well Drilling and Completion Costs. The costs for well drilling and completion (D&C)are based on the 2003 JAS cost study recently published by API for Mississippi.The well D&C cost equation has a fixed cost constant for site preparation and otherfixed cost items and a variable cost equation that increases exponentially with depth.The total equation is:Well D&C Costs = a 0 D a 1Where: a 0 is 0.00655a 1 is 2.104D is well depthFigure C-1 provides the details for the cost equation and illustrates the “goodness of fit”for the well D&C cost equation for Mississippi.Figure C-1. Oil Well D&C Costs for Mississippi2,500,000Total Drilling Cost, US$2,000,0001,500,0001,000,0002003 API CostsPower (2003 API Costs)y = 0.00655x 2.10378R 2 = 0.99095500,00000 2,000 4,000 6,000 8,000 10,000 12,000Depth, ftIn order to bring the 2003 API drilling costs (the most recent available) into 2004numbers where increased oil prices are expected to result in significantly increaseddrilling costs, a relationship was established between average drilling costs and averageC-1 February 2006
annual oil prices. Drillings costs from the ten year period of 1994-2003 (API data) wereplotted versus the three year weighted average annual oil prices for those years (EIAAnnual Energy Review, 2004) and the following relationship was established:Drilling costs (per foot) = $5.04(annual oil price) – $3.2116.Applying the 2004 average oil price of $36.77 gives a drilling cost of $182 per foot andan increase of 25.6% over the 2003 cost of $145 per foot. Therefore, drilling andcompletion costs were increased by 25% over the Mississippi D&C cost calculations toreflect this increase in 2004 drilling costs.2. Lease Equipment Costs for New Producing Wells. The costs for equipping a new oilproduction well are based on data reported by the EIA in their 2004 EIA “Cost andIndices for Domestic Oil and Gas Field Equipment and Production Operations” report forSouth Louisiana. This survey provides estimated lease equipment costs for 10 wellsproducing with artificial lift, from depths ranging from 2,000 to 12,000 feet, into a centraltank battery.The equation contains a fixed cost constant for common cost items, such as free waterknock-out, water disposal and electrification, and a variable cost component to capturedepth-related costs such as for pumping equipment. The total equation is:Production Well Equipping Costs = c 0 + c 1 DWhere: c o = $81,403 (fixed)c 1 = $7.033 per footD is well depthFigure C-2 illustrates the application of the lease equipping cost equation for a new oilproduction well as a function of depth.C-2 February 2006
Figure C-2. Lease Equipping Cost for a New Oil Production Wellin Mississippi vs. Depth200,000160,000Total Costs, US$120,00080,000y = 7.033x + 81403R 2 = 0.942840,00000 2,000 4,000 6,000 8,000 10,000 12,000 14,000Depth, ft3. Lease Equipment Costs for New Injection Wells. The costs for equipping a newinjection well in Mississippi include gathering lines, a header, electrical service as wellas a water pumping system. The costs are estimated from the EIA Cost and IndicesReport.Equipment costs include a fixed cost component and a depth-related cost component,which varies based on surface pressure requirements. The equation for Mississippi is:Injection Well Equipping Costs = c 0 + c 1 DWhere: c o = $17,214 (fixed)c 1 = $16.34 per footD is well depthFigure C-3 illustrates the application of the lease equipping cost equation for a newinjection well as a function of depth for West Texas. The West Texas cost data forlease equipment provides the foundation for the Mississippi cost equation.C-3 February 2006
Figure C-3. Lease Equipping Costs for a New Injection Well inWest Texas vs. Depth140,000120,000100,000CostsLinear (Costs)y = 14.63x + 9277.3R 2 = 0.9674Costs, US$80,00060,00040,00020,000Ratio to W. TXBasin c o c 1 c o c 1US$US$/ftW TX 1.00 1.00 9,277 14.63CA 0.80 2.10 7,463 30.73RM 1.51 0.83 14,051 12.11S TX 1.68 1.19 15,555 17.40MS 1.86 1.12 17,214 16.34OK 1.17 1.12 10,820 16.3300 1,000 2,000 3,000 4,000 5,000 6,000 7,000 8,000 9,000Depth, ft4. Converting Existing Production Wells into Injection Wells. The conversion of existingoil production wells into CO 2 and water injection wells requires replacing the tubingstring and adding distribution lines and headers. The costs assume that all surfaceequipment necessary for water injection are already in place on the lease.The existing well conversion costs include a fixed cost component and a depth-relatedcost component, which varies based on the required surface pressure and tubinglength. The equation for Mississippi is:Well Conversion Costs = c 0 + c 1 DWhere: c o = $16,607 (fixed)c 1 = $6.973 per footD is well depthFigure C-4 illustrates the average cost of converting an existing producer into aninjection well for West Texas. The West Texas cost data for converting wells providethe foundation for the Mississippi cost equation.C-4 February 2006
Figure C-4. Cost of Converting Existing Production Wells intoInjection Wells in West Texas vs. Depth70,00060,000y = 6.2412x + 8950R 2 = 0.989650,000Cost, US$40,00030,00020,00010,000Ratio to W. TXBasin c o c 1 c o c 1US$US$/ftW TX 1.00 1.00 8,950 6.24CA 0.80 2.10 7,200 13.11RM 1.51 0.83 13,555 5.16S TX 1.68 1.19 15,006 7.42MS 1.86 1.12 16,607 6.97OK 1.17 1.12 10,438 6.9700 1000 2000 3000 4000 5000 6000 7000 8000 9000Depth, ft5. Costs of Reworking an Existing Waterflood Production or Injection Well for CO 2 -EOR(First Rework). The reworking of existing oil production or CO 2 -EOR injection wellsrequires pulling and replacing the tubing string and pumping equipment. The wellreworking costs are depth-dependent. The equation for Mississippi is:Well Rework Costs = c 1 DWhere: c 1 = $19.42 per foot)D is well depthFigure C-5 illustrates the average cost of well conversion as a function of depth for WestTexas. The West Texas cost data for reworking wells provides the foundation for theMississippi cost equation.C-5 February 2006
Figure C-5. Cost of an Existing Waterflood Production or InjectionWell for CO 2 -EOR in West Texas vs. Depth160,000140,000120,000ReworkLinear (Rework)y = 17.38xR 2 = 0.9545Costs, US$100,00080,00060,00040,00020,0000Ratio to W. TXBasin c o c 1 c o c 1US$US$/ftW TX 1.00 1.00 0 17.38CA 0.80 2.10 0 36.51RM 1.51 0.83 0 14.38S TX 1.68 1.19 0 20.67MS 1.86 1.12 0 19.42OK 1.17 1.12 0 19.410 1000 2000 3000 4000 5000 6000 7000 8000 9000Depth, ft6. Annual O&M Costs, <strong>Inc</strong>luding Periodic Well Workovers. The EIA Cost and Indicesreport provides secondary operating and maintenance (O&M) costs only for WestTexas. As such, West Texas and Mississippi primary oil production O&M costs (FigureC-6) are used to estimate Mississippi secondary recovery O&M costs. Linear trends areused to identify fixed cost constants and variable cost constants for each region, TableC-1.C-6 February 2006
Figure C-6. Annual Lease O&M Costs for Primary Oil Production by Area80,00070,00060,000CaliforniaSouth LouisianaWest TexasLinear (California)Linear (West Texas)Linear (South Texas)OklahomaSouth TexasRocky MountainsLinear (South Louisiana)Linear (Oklahoma)Linear (Rocky Mountains)Total Costs, US$ per Year50,00040,00030,00020,000y = 2.8014x + 16401R 2 = 0.9611y = 5.2672x + 7110.7R 2 = 0.994510,000y = 2.5075x + 8838.5R 2 = 0.96y = 2.7997x + 10309R 2 = 0.9789y = 2.9819x + 14820R 2 = 0.9637y = 2.0751x + 13387R 2 = 0.978300 2,000 4,000 6,000 8,000 10,000 12,000 14,000Depth, ftTable C-1. Regional Lease O&M Costs and Their Relationship to West TexasRatio to W. TXBasin c0 c1 c0 c1US$US$West Texas 8,839 2.51 1.00 1.00California 7,111 5.27 0.80 2.10Rocky Mountain 13,387 2.08 1.51 0.83South Texas 14,820 2.98 1.68 1.19Mississippi 16,401 2.80 1.86 1.12Oklahoma 10,309 2.80 1.17 1.12To account for the O&M cost differences between waterflooding and CO 2 -EOR, twoadjustments are made to the EIA’s reported O&M costs for secondary recovery.Workover costs, reported as surface and subsurface maintenance, are doubled toreflect the need for more frequent remedial well work in CO 2 -EOR projects. Liquid liftingare subtracted from annual waterflood O&M costs to allow for the more rigorousaccounting of liquid lifting volumes and costs for CO 2 -EOR. (Liquid lifting costs for CO 2 -EOR are discussed in a later section of this appendix.)C-7 February 2006
Figure C-7 shows the depth-relationship for CO 2 -EOR O&M costs in West Texas.These costs were adjusted to develop O&M for Mississippi, shown in the inset of FigureC-7. The equation for Mississippi is:Well O&M Costs = b 0 + b 1 DWhere: b 0 = $38,447 (fixed)b 1 = $8.72 per footD is well depthFigure C-7. Annual CO 2 -EOR O&M Costs for West Texas70,00060,000CO2-EOR O&MLinear (CO2-EOR O&M)Costs per Year, US$50,00040,00030,00020,00010,0000y = 7.8054x + 1557R 2 = 0.9935Ratio to W. TXArea b0 b1 b0 b1US$US$W TX 1.00 1.00 20,720 7.81CA 0.80 2.10 16,669 16.40RM 1.51 0.83 31,381 6.46S TX 1.68 1.19 34,740 9.28MS 1.86 1.12 38,447 8.72OK 1.17 1.12 24,166 8.710 1,000 2,000 3,000 4,000 5,000 6,000 7,000 8,000 9,000De pth, ft7. CO 2 Recycle Plant Investment Cost. Operation of CO 2 -EOR requires a recyclingplant to capture and reinject the produced CO 2 . The size of the recycle plant is basedon peak CO 2 production and recycling requirements.The cost of the recycling plant is set at $700,000 per MMcf/d of CO 2 capacity. As such,small CO 2 -EOR project in the Christmas formation of the West Heidelberg field, with 11MMcf/d of CO 2 reinjection, will require a recycling plant costing $7.7 million. A largeproject in the Lower Tuscaloosa formation of the Little Creek field, with 92 MMcf/d ofpeak CO 2 reinjection and 86 injectors requires a recycling plant costing $64 million.The model has three options for installing a CO 2 recycling plant. The default settingcosts the entire plant one year prior to CO 2 breakthrough. The second option placesthe full CO 2 recycle plant cost at the beginning of the project (Year 0). The third optioninstalls the CO 2 recycle plant in stages. In this case, half the plant is built (and half thecost is incurred) in the year of CO 2 breakthrough. The second half of the plant is builtwhen maximum recycle capacity requirements are reached.C-8 February 2006
8. Other COTWO Model Costs.a. CO 2 Recycle O&M Costs. The O&M costs of CO 2 recycling are indexed toenergy costs and set at 1% of the oil price ($0.25 per Mcf @ $25 Bbl oil).b. Lifting Costs. Liquid (oil and water) lifting costs are calculated on total liquidproduction and costed at $0.25 per barrel. This cost includes liquid lifting, transportationand re-injection.c. CO 2 Distribution Costs. The CO 2 distribution system is similar to the gatheringsystems used for natural gas. A distribution “hub” is constructed with smaller pipelinesdelivering purchased CO 2 to the project site.The distribution pipeline cost is dependent on the injection requirements for the project.The fixed component is $150,000. The variable cost component accounts forincreasing piping diameters associated with increasing CO 2 injection requirements.These range from $80,000 per mile for 4” pipe (CO 2 rate less than 15MMcf/d), $120,000per mile for 6” pipe (CO 2 rate of 15 to 35 MMcf/d), $160,000 per mile for 8” pipe (CO 2rate of 35 to 60 MMcf/d), and $200,000 per mile for pipe greater than 8” diameter (CO 2rate greater than 60 MMcf/d). Aside from the injection volume, costs also depend onthe distance from the CO 2 “hub” (transfer point) to the oil field. Currently, the distance isset at 10 miles.The CO 2 distribution cost equation for Mississippi is:Pipeline Construction Costs = $150,000 + C D *DistanceWhere: C D is the cost per mile of the necessary pipe diameter (from the CO 2injection rate)Distance = 10.0 milesd. G&A Costs. General and administrative (G&A) costs of 20% are added to wellO&M and lifting costs.e. Royalties. Royalty payments are assumed to be 12.5%.f. Production Taxes. Mississippi has provided a risk sharing incentive for enhancedoil recovery. The Mississippi Code Ann. 27-25-503(i) (1972) is effective as of April, 1994with no sunset. Its stated goal is:“Encourage the use of enhanced recovery methods of production.”The “Enhanced Oil Recovery Statute” reduces the assessed severance tax rate to 3%of the value of the oil produced by an enhanced oil recovery method. The originalstatute, only covering use of carbon dioxide transported by a pipeline to the oil well, wasC-9 February 2006
expanded to include any other enhanced oil recovery method approved and permittedby the State Oil and Gas Board on or after April 1, 1994.The regular state oil severance tax rate in Mississippi is 6% of the value of the producedoil. Reduction of the severance tax to 3% provides a modest risk sharing equal to $0.78per barrel of incrementally produced oil (assuming a sales price of $30 per barrel of oiland a royalty rate of 12.5%).Severance and ad valorum taxes are set at 6.0% and 0.2%, respectively, for a totalproduction tax of 6.2% on the oil production stream. Production taxes are takenfollowing royalty payments.g. Crude Oil Price Differential. To account for market and oil quality (gravity)differences on the realized oil price, the cost model incorporated the current basisdifferential for Mississippi ($0.00 per barrel) and the current gravity differential (-$0.25per º API, from a basis of 40 º API) into the average wellhead oil price realized by each oilreservoir. The equation for Mississippi is:Wellhead Oil Price = Oil Price + ($0.00) – [$0.25*(40 - º API)]Where: Oil Price is the marker oil price (West Texas intermediate)º API is oil gravityIf the oil gravity is less than 40 º API, the wellhead oil price is reduced; if the oil gravity isgreater than 40 º API, the wellhead oil price is increased. In addition, some fields withinMississippi contain very light oil (>45 API). In order to keep the economics of thesefields level with the rest of the fields, we imposed a ceiling of 45 API for all fields withlighter oil when applying the Crude Oil Price Differential.C-10 February 2006
Appendix DAlabama CO 2 -EORCost Model
Cost Model for CO 2 -Based Enhanced Oil Recovery (CO 2 -EOR)This appendix provides documentation for the cost module of the desktop CO 2 -EORpolicy and analytical model (COTWO) developed by <strong>Advanced</strong> <strong>Resources</strong> for DOE/FE-HQ. The sections of this cost documentation report are organized according to thenormal sequence of estimating the capital and operating expenditures for a CO 2 -EORproject:1. Well Drilling and Completion Costs. The costs for well drilling and completion (D&C)are based on the 2003 JAS cost study recently published by API for Mississippi and areapplied to Alabama.The well D&C cost equation has a fixed cost constant for site preparation and otherfixed cost items and a variable cost equation that increases exponentially with depth.The total equation is:Well D&C Costs = a 0 D a 1Where: a 0 is 0.00655a 1 is 2.104D is well depthFigure D-1 provides the details for the cost equation and illustrates the “goodness of fit”for the well D&C cost equation for Alabama.Figure-D1 - Oil Well D&C Costs for Alabama2,500,000Total Drilling Cost, US$2,000,0001,500,0001,000,0002003 API CostsPower (2003 API Costs)y = 0.00655x 2.10378R 2 = 0.99095500,00000 2,000 4,000 6,000 8,000 10,000 12,000Depth, ftD-1 February 2006
In order to bring the 2003 API drilling costs (the most recent available) into 2004numbers where increased oil prices are expected to result in significantly increaseddrilling costs, a relationship was established between average drilling costs and averageannual oil prices. Drillings costs from the ten year period of 1994-2003 (API data) wereplotted versus the three year weighted average annual oil prices for those years (EIAAnnual Energy Review, 2004) and the following relationship was established:Drilling costs (per foot) = $5.04(annual oil price) – $3.2116.Applying the 2004 average oil price of $36.77 gives a drilling cost of $182 per foot andan increase of 25.6% over the 2003 cost of $145 per foot. Therefore, drilling andcompletion costs were increased by 25% over the Alabama D&C cost calculations toreflect this increase in 2004 drilling costs.2. Lease Equipment Costs for New Producing Wells. The costs for equipping a new oilproduction well are based on data reported by the EIA in their 2004 EIA “Cost andIndices for Domestic Oil and Gas Field Equipment and Production Operations” report forSouth Louisiana. This survey provides estimated lease equipment costs for 10 wellsproducing with artificial lift, from depths ranging from 2,000 to 12,000 feet, into a centraltank battery.The equation contains a fixed cost constant for common cost items, such as free waterknock-out, water disposal and electrification, and a variable cost component to capturedepth-related costs such as for pumping equipment. The total equation is:Production Well Equipping Costs = c 0 + c 1 DWhere: c o = $81,403 (fixed)c 1 = $7.033 per footD is well depthFigure D-2 illustrates the application of the lease equipping cost equation for a new oilproduction well as a function of depth.D-2 February 2006
Figure D-2. Lease Equipping Cost for a New Oil Production Wellin Alabama vs. Depth200,000160,000Total Costs, US$120,00080,000y = 7.033x + 81403R 2 = 0.942840,00000 2,000 4,000 6,000 8,000 10,000 12,000 14,000Depth, ft3. Lease Equipment Costs for New Injection Wells. The costs for equipping a newinjection well in Alabama include gathering lines, a header, electrical service as well asa water pumping system. The costs are estimated from the EIA Cost and IndicesReport.Equipment costs include a fixed cost component and a depth-related cost component,which varies based on surface pressure requirements. The equation for Alabama is:Injection Well Equipping Costs = c 0 + c 1 DWhere: c o = $17,214 (fixed)c 1 = $16.34 per footD is well depthFigure D-3 illustrates the application of the lease equipping cost equation for a newinjection well as a function of depth for West Texas. The West Texas cost data forlease equipment provides the foundation for the Alabama cost equation.D-3 February 2006
Figure D-3. Lease Equipping Costs for a New Injection Well inWest Texas vs. Depth140,000120,000100,000CostsLinear (Costs)y = 14.63x + 9277.3R 2 = 0.9674Costs, US$80,00060,00040,00020,000Ratio to W. TXBasin co c1 co c1US$US$/ftW TX 1.00 1.00 9,277 14.63CA 0.80 2.10 7,463 30.73RM 1.51 0.83 14,051 12.11S TX 1.68 1.19 15,555 17.40AL 1.86 1.12 17,214 16.34OK 1.17 1.12 10,820 16.3300 1,000 2,000 3,000 4,000 5,000 6,000 7,000 8,000 9,000Depth, ft4. Converting Existing Production Wells into Injection Wells. The conversion of existingoil production wells into CO 2 and water injection wells requires replacing the tubingstring and adding distribution lines and headers. The costs assume that all surfaceequipment necessary for water injection are already in place on the lease.The existing well conversion costs include a fixed cost component and a depth-relatedcost component, which varies based on the required surface pressure and tubinglength. The equation for Alabama is:Well Conversion Costs = c 0 + c 1 DWhere: c o = $16,607 (fixed)c 1 = $6.973 per footD is well depthFigure D-4 illustrates the average cost of converting an existing producer into aninjection well for West Texas. The West Texas cost data for converting wells providethe foundation for the Alabama cost equation.D-4 February 2006
Figure D-4. Cost of Converting Existing Production Wells intoInjection Wells in West Texas vs. Depth70,00060,000y = 6.2412x + 8950R 2 = 0.989650,000Cost, US$40,00030,00020,00010,000Ratio to W. TXBasin c o c 1 c o c 1US$US$/ftW TX 1.00 1.00 8,950 6.24CA 0.80 2.10 7,200 13.11RM 1.51 0.83 13,555 5.16S TX 1.68 1.19 15,006 7.42AL 1.86 1.12 16,607 6.97OK 1.17 1.12 10,438 6.9700 1000 2000 3000 4000 5000 6000 7000 8000 9000Depth, ft5. Costs of Reworking an Existing Waterflood Production or Injection Well for CO 2 -EOR(First Rework). The reworking of existing oil production or CO 2 -EOR injection wellsrequires pulling and replacing the tubing string and pumping equipment. The wellreworking costs are depth-dependent. The equation for Alabama is:Well Rework Costs = c 1 DWhere: c 1 = $19.42 per foot)D is well depthFigure D-5 illustrates the average cost of well conversion as a function of depth for WestTexas. The West Texas cost data for reworking wells provides the foundation for theAlabama cost equation.D-5 February 2006
Figure D-5. Cost of an Existing Waterflood Production or InjectionWell for CO 2 -EOR in West Texas vs. Depth160,000140,000120,000ReworkLinear (Rework)y = 17.38xR 2 = 0.9545Costs, US$100,00080,00060,00040,00020,0000Ratio to W. TXBasin c o c 1 c o c 1US$US$/ftW TX 1.00 1.00 0 17.38CA 0.80 2.10 0 36.51RM 1.51 0.83 0 14.38S TX 1.68 1.19 0 20.67AL 1.86 1.12 0 19.42OK 1.17 1.12 0 19.410 1000 2000 3000 4000 5000 6000 7000 8000 9000Depth, ft6. Annual O&M Costs, <strong>Inc</strong>luding Periodic Well Workovers. The EIA Cost and Indicesreport provides secondary operating and maintenance (O&M) costs only for WestTexas. As such, West Texas and Alabama primary oil production O&M costs (FigureD-6) are used to estimate Alabama secondary recovery O&M costs. Linear trends areused to identify fixed cost constants and variable cost constants for each region, TableD-1.D-6 February 2006
Figure D-6. Annual Lease O&M Costs for Primary Oil Production by Area80,00070,00060,000CaliforniaSouth LouisianaWest TexasLinear (California)Linear (West Texas)Linear (South Texas)OklahomaSouth TexasRocky MountainsLinear (South Louisiana)Linear (Oklahoma)Linear (Rocky Mountains)Total Costs, US$ per Year50,00040,00030,00020,000y = 2.8014x + 16401R 2 = 0.9611y = 5.2672x + 7110.7R 2 = 0.994510,000y = 2.5075x + 8838.5R 2 = 0.96y = 2.7997x + 10309R 2 = 0.9789y = 2.9819x + 14820R 2 = 0.9637y = 2.0751x + 13387R 2 = 0.978300 2,000 4,000 6,000 8,000 10,000 12,000 14,000Depth, ftTable D-1. Regional Lease O&M Costs and Their Relationship to West TexasRatio to W. TXBasin c0 c1 c0 c1US$US$West Texas 8,839 2.51 1.00 1.00California 7,111 5.27 0.80 2.10Rocky Mountain 13,387 2.08 1.51 0.83South Texas 14,820 2.98 1.68 1.19Alabama 16,401 2.80 1.86 1.12Oklahoma 10,309 2.80 1.17 1.12To account for the O&M cost differences between waterflooding and CO 2 -EOR, twoadjustments are made to the EIA’s reported O&M costs for secondary recovery.Workover costs, reported as surface and subsurface maintenance, are doubled toreflect the need for more frequent remedial well work in CO 2 -EOR projects. Liquid liftingare subtracted from annual waterflood O&M costs to allow for the more rigorousaccounting of liquid lifting volumes and costs for CO 2 -EOR. (Liquid lifting costs for CO 2 -EOR are discussed in a later section of this appendix.)D-7 February 2006
Figure D-7 shows the depth-relationship for CO 2 -EOR O&M costs in West Texas.These costs were adjusted to develop O&M for Alabama, shown in the inset of FigureD-7. The equation for Alabama is:Well O&M Costs = b 0 + b 1 DWhere: b 0 = $38,447 (fixed)b 1 = $8.72 per footD is well depthFigure D-7. Annual CO 2 -EOR O&M Costs for West Texas70,00060,000CO2-EOR O&MLinear (CO2-EOR O&M)Costs per Year, US$50,00040,00030,00020,00010,0000y = 7.8054x + 1557R 2 = 0.9935Ratio to W. TXArea b0 b1 b0 b1US$US$W TX 1.00 1.00 20,720 7.81CA 0.80 2.10 16,669 16.40RM 1.51 0.83 31,381 6.46S TX 1.68 1.19 34,740 9.28AL 1.86 1.12 38,447 8.72OK 1.17 1.12 24,166 8.710 1,000 2,000 3,000 4,000 5,000 6,000 7,000 8,000 9,000Depth, ft7. CO 2 Recycle Plant Investment Cost. Operation of CO 2 -EOR requires a recyclingplant to capture and reinject the produced CO 2 . The size of the recycle plant is basedon peak CO 2 production and recycling requirements.The cost of the recycling plant is set at $700,000 per MMcf/d of CO 2 capacity. As such,a project in the Rodessa formation of the Citronelle field, with 114 MMcf/d of peak CO 2reinjection and 203 injectors requires a recycling plant costing $80 million.The model has three options for installing a CO 2 recycling plant. The default settingcosts the entire plant one year prior to CO 2 breakthrough. The second option placesthe full CO 2 recycle plant cost at the beginning of the project (Year 0). The third optioninstalls the CO 2 recycle plant in stages. In this case, half the plant is built (and half thecost is incurred) in the year of CO 2 breakthrough. The second half of the plant is builtwhen maximum recycle capacity requirements are reached.D-8 February 2006
8. Other COTWO Model Costs.a. CO 2 Recycle O&M Costs. The O&M costs of CO 2 recycling are indexed toenergy costs and set at 1% of the oil price ($0.25 per Mcf @ $25 Bbl oil).b. Lifting Costs. Liquid (oil and water) lifting costs are calculated on total liquidproduction and costed at $0.25 per barrel. This cost includes liquid lifting, transportationand re-injection.c. CO 2 Distribution Costs. The CO 2 distribution system is similar to the gatheringsystems used for natural gas. A distribution “hub” is constructed with smaller pipelinesdelivering purchased CO 2 to the project site.The distribution pipeline cost is dependent on the injection requirements for the project.The fixed component is $150,000. The variable cost component accounts forincreasing piping diameters associated with increasing CO 2 injection requirements.These range from $80,000 per mile for 4” pipe (CO 2 rate less than 15MMcf/d), $120,000per mile for 6” pipe (CO 2 rate of 15 to 35 MMcf/d), $160,000 per mile for 8” pipe (CO 2rate of 35 to 60 MMcf/d), and $200,000 per mile for pipe greater than 8” diameter (CO 2rate greater than 60 MMcf/d). Aside from the injection volume, costs also depend onthe distance from the CO 2 “hub” (transfer point) to the oil field. Currently, the distance isset at 10 miles.The CO 2 distribution cost equation for Alabama is:Pipeline Construction Costs = $150,000 + C D *DistanceWhere: C D is the cost per mile of the necessary pipe diameter (from the CO 2injection rate)Distance = 10.0 milesd. G&A Costs. General and administrative (G&A) costs of 20% are added to wellO&M and lifting costs.e. Royalties. Royalty payments are assumed to be 12.5%.f. Production Taxes. Alabama has enacted a risk sharing action for enhanced oilrecovery. The Alabama Severance Tax Law Chapter 20, Article 1, Section 40-20-2 iseffective May 1, 1985. It states:“…the incremental oil or gas production produced during a given year resulting froma qualified enhanced recovery project shall be taxed at the rate of four percent of grossvalue at the point of production of said incremental oil or gas production.”D-9 February 2006
The severance tax in the model was therefore set at 6.0% (the 4% privilege tax plus a2% production tax). The conventional oil severance tax rate in Alabama is 10% of thevalue of the produced oil. Reduction in the severance tax by 4% for enhanced oilrecovery provides a savings of $1.05 per barrel of incrementally produced oil (assuminga sales price of $30 per barrel of oil and a royalty rate of 12.5%). Production taxes aretaken following royalty payments.g. Crude Oil Price Differential. To account for market and oil quality (gravity)differences on the realized oil price, the cost model incorporated the current basisdifferential for Alabama ($0.00 per barrel) and the current gravity differential (-$0.25 perº API, from a basis of 40 º API) into the average wellhead oil price realized by each oilreservoir. The equation for Alabama is:Wellhead Oil Price = Oil Price + ($0.00) – [$0.25*(40 - º API)]Where: Oil Price is the marker oil price (West Texas intermediate)º API is oil gravityIf the oil gravity is less than 40 º API, the wellhead oil price is reduced; if the oil gravity isgreater than 40 º API, the wellhead oil price is increased. In addition, some fields withinAlabama contain very light oil (>45 API). In order to keep the economics of these fieldslevel with the rest of the fields, we imposed a ceiling of 45 API for all fields with lighteroil when applying the Crude Oil Price Differential.D-10 February 2006