A Case Study on Customer Attitude and Preference towards the ...
A Case Study on Customer Attitude and Preference towards the ...
A Case Study on Customer Attitude and Preference towards the ...
You also want an ePaper? Increase the reach of your titles
YUMPU automatically turns print PDFs into web optimized ePapers that Google loves.
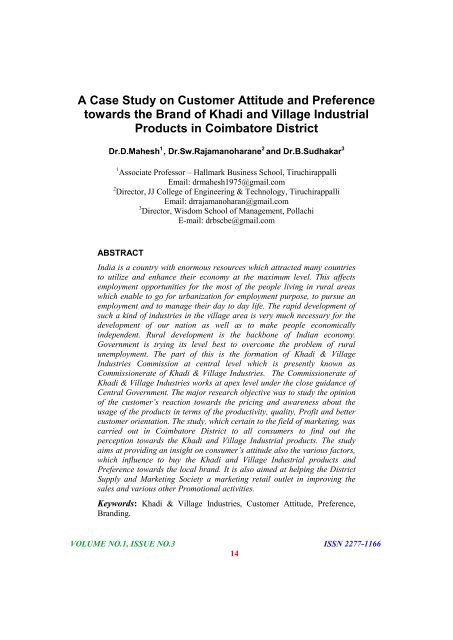
A <str<strong>on</strong>g>Case</str<strong>on</strong>g> <str<strong>on</strong>g>Study</str<strong>on</strong>g> <strong>on</strong> <strong>Customer</strong> <strong>Attitude</strong> <strong>and</strong> <strong>Preference</strong><strong>towards</strong> <strong>the</strong> Br<strong>and</strong> of Khadi <strong>and</strong> Village IndustrialProducts in Coimbatore DistrictDr.D.Mahesh 1 , Dr.Sw.Rajamanoharane 2 <strong>and</strong> Dr.B.Sudhakar 31 Associate Professor – Hallmark Business School, TiruchirappalliEmail: drmahesh1975@gmail.com2 Director, JJ College of Engineering & Technology, TiruchirappalliEmail: drrajamanoharan@gmail.com3 Director, Wisdom School of Management, PollachiE-mail: drbscbe@gmail.comABSTRACTIndia is a country with enormous resources which attracted many countriesto utilize <strong>and</strong> enhance <strong>the</strong>ir ec<strong>on</strong>omy at <strong>the</strong> maximum level. This affectsemployment opportunities for <strong>the</strong> most of <strong>the</strong> people living in rural areaswhich enable to go for urbanizati<strong>on</strong> for employment purpose, to pursue anemployment <strong>and</strong> to manage <strong>the</strong>ir day to day life. The rapid development ofsuch a kind of industries in <strong>the</strong> village area is very much necessary for <strong>the</strong>development of our nati<strong>on</strong> as well as to make people ec<strong>on</strong>omicallyindependent. Rural development is <strong>the</strong> backb<strong>on</strong>e of Indian ec<strong>on</strong>omy.Government is trying its level best to overcome <strong>the</strong> problem of ruralunemployment. The part of this is <strong>the</strong> formati<strong>on</strong> of Khadi & VillageIndustries Commissi<strong>on</strong> at central level which is presently known asCommissi<strong>on</strong>erate of Khadi & Village Industries. The Commissi<strong>on</strong>erate ofKhadi & Village Industries works at apex level under <strong>the</strong> close guidance ofCentral Government. The major research objective was to study <strong>the</strong> opini<strong>on</strong>of <strong>the</strong> customer’s reacti<strong>on</strong> <strong>towards</strong> <strong>the</strong> pricing <strong>and</strong> awareness about <strong>the</strong>usage of <strong>the</strong> products in terms of <strong>the</strong> productivity, quality, Profit <strong>and</strong> bettercustomer orientati<strong>on</strong>. The study, which certain to <strong>the</strong> field of marketing, wascarried out in Coimbatore District to all c<strong>on</strong>sumers to find out <strong>the</strong>percepti<strong>on</strong> <strong>towards</strong> <strong>the</strong> Khadi <strong>and</strong> Village Industrial products. The studyaims at providing an insight <strong>on</strong> c<strong>on</strong>sumer’s attitude also <strong>the</strong> various factors,which influence to buy <strong>the</strong> Khadi <strong>and</strong> Village Industrial products <strong>and</strong><strong>Preference</strong> <strong>towards</strong> <strong>the</strong> local br<strong>and</strong>. It is also aimed at helping <strong>the</strong> DistrictSupply <strong>and</strong> Marketing Society a marketing retail outlet in improving <strong>the</strong>sales <strong>and</strong> various o<strong>the</strong>r Promoti<strong>on</strong>al activities.Keywords: Khadi & Village Industries, <strong>Customer</strong> <strong>Attitude</strong>, <strong>Preference</strong>,Br<strong>and</strong>ing.VOLUME NO.1, ISSUE NO.3 ISSN 2277-116614
ABHINAVNATIONAL MONTHLY REFEREED JOURNAL OF REASEARCH IN COMMERCE & MANAGEMENTwww.abhinavjournal.comGenderGender normally plays a vital role as <strong>the</strong> new age marketers are providing more significanceto gender segmentati<strong>on</strong> in offering new products <strong>and</strong> services. Hence, it is inevitable toc<strong>on</strong>sider <strong>the</strong> role of gender in any research. For this purpose, gender has been classified intotwo groups Viz., male <strong>and</strong> female.Table 1. Gender of Resp<strong>on</strong>dentsSr.no Gender Frequency Percentage Cumulative percentage1 MALE 142 47.3 47.32 FEMALE 158 52.7 100TOTAL 300 100Source: Primary DataThe above table shows that out of <strong>the</strong> total resp<strong>on</strong>dents taken for <strong>the</strong> study, 47.3 per cent of<strong>the</strong> resp<strong>on</strong>dents are male <strong>and</strong> 52.7 per cent of <strong>the</strong> resp<strong>on</strong>dents are female. The majority ofresp<strong>on</strong>dents are bel<strong>on</strong>ging to female category. So compared to females, <strong>the</strong> male resp<strong>on</strong>dentsare less.AgeThe Age wise classificati<strong>on</strong> of <strong>the</strong> sample is exhibited in <strong>the</strong> Table 4.3.2. Age is an importantfactor in arriving at a good decisi<strong>on</strong> <strong>and</strong> implementing <strong>the</strong> decisi<strong>on</strong>. The resp<strong>on</strong>dents areclassified into four age groups Viz., below 25, 25-35, 35-45, 45-55 <strong>and</strong> above 55.Table 2. Showing Age of Resp<strong>on</strong>dentsSr.No Age GroupNo. ofCumulativePercentageResp<strong>on</strong>dentspercentage1 Below 25 Years 24 8.0 8.02 25-35 Years 85 28.3 36.33 35-45 Years 115 38.3 74.74 45-.55 Years 47 15.7 90.35 Above 55 Years 29 9.7 100.0TOTAL 300 100Source: Primary DataFrom Table 4.1, it is clear that, 8 percent of <strong>the</strong> resp<strong>on</strong>dents fall under <strong>the</strong> age group ofbelow 25 years, 28.3 per cent of <strong>the</strong> resp<strong>on</strong>dents fall under <strong>the</strong> age group 25-35 years, 38.3of <strong>the</strong>m bel<strong>on</strong>gs to 35-45 years, 15.7 per cent of <strong>the</strong>m bel<strong>on</strong>g to 45-5-40 years <strong>and</strong> remaining9.7 per cent of <strong>the</strong> resp<strong>on</strong>dents are in above 55 years of age. Thus, majority of <strong>the</strong>resp<strong>on</strong>dents are of <strong>the</strong> age between 35 to 45 years.Marital StatusIn today‟s world both men & women are working in a family, so risk & returns are shared by<strong>the</strong>m. But <strong>the</strong> unmarried category has a certain limit to take risk because <strong>the</strong>y can‟t shareVOLUME NO.1, ISSUE NO.3 ISSN 2277-116620
ABHINAVNATIONAL MONTHLY REFEREED JOURNAL OF REASEARCH IN COMMERCE & MANAGEMENTwww.abhinavjournal.com<strong>the</strong>ir risk. So mainly married category people invest more. Marital status of sampleresp<strong>on</strong>dents are classified into groups namely married <strong>and</strong> single respectively.Table 3. Showing Marital Status of Resp<strong>on</strong>dentsSr. No Marital Status Frequency Percentage Cumulative percentage1 SINGLE 64 21.33 21.332 MARRIED 236 78.67 100.0TOTAL 300 100.0Source: Primary DataFrom <strong>the</strong> above table, it is observed that 21.33 percent of <strong>the</strong> resp<strong>on</strong>dents bel<strong>on</strong>g to singlecategory <strong>and</strong> 78.67 percent of <strong>the</strong> resp<strong>on</strong>dents bel<strong>on</strong>g to married category. Numbers ofmarried are more in comparis<strong>on</strong> to <strong>the</strong> number of unmarried resp<strong>on</strong>dents. The majority ofresp<strong>on</strong>dents bel<strong>on</strong>g to married category.Occupati<strong>on</strong>al StatusOccupati<strong>on</strong> wise distributi<strong>on</strong>s of sample resp<strong>on</strong>dents are classified according to <strong>the</strong>iremployment positi<strong>on</strong>. Occupati<strong>on</strong> is a status symbol in society. Hence <strong>the</strong> resp<strong>on</strong>dents areclassified into groups namely Business /self employed, student, employed professi<strong>on</strong>al,Government service, Public sector <strong>and</strong> Housewife.Table 4. Showing Occupati<strong>on</strong>al Status of Resp<strong>on</strong>dentsSr. No Occupati<strong>on</strong>al StatusNo. ofCumulativePercentageResp<strong>on</strong>dentspercentage1 Business /self employed 7 2.3 2.32 Student 26 8.7 11.03 Employed professi<strong>on</strong>al 61 20.3 31.34 Govt. service 63 21.0 52.35 Public sector 120 40.0 92.36 Housewife 23 7.7 100TOTAL 300 100Source: Primary DataTable 4.3.4 reveals <strong>the</strong> occupati<strong>on</strong> wise distributi<strong>on</strong> of resp<strong>on</strong>dents. Out of 300 resp<strong>on</strong>dents,120 who account for 40 percent of <strong>the</strong> total are public sector. Next are Govt. services at 21percent, followed by employed professi<strong>on</strong>al at 20.3 percent, student at 8.7 percent <strong>and</strong>Business /self employed at 7 percent. The majority of <strong>the</strong> resp<strong>on</strong>dents are bel<strong>on</strong>gs to publicsector.IncomeIncome is important for all human beings, because each <strong>and</strong> everything is based <strong>on</strong> income.It induces individuals to spend <strong>the</strong>ir hard earned m<strong>on</strong>ey <strong>on</strong> different products <strong>and</strong> services. Inthis study, <strong>the</strong> income has been studied closely to see its relati<strong>on</strong>ship with Commercialbanks. The resp<strong>on</strong>dents income was studied under four different categories. For this purposeVOLUME NO.1, ISSUE NO.3 ISSN 2277-116621
ABHINAVNATIONAL MONTHLY REFEREED JOURNAL OF REASEARCH IN COMMERCE & MANAGEMENTwww.abhinavjournal.com<strong>the</strong> annual income level of <strong>the</strong> resp<strong>on</strong>dents are classified into four levels Viz., Less thanRs.50,000, Rs.50,001 to Rs.1,00,000, Rs.1,00,001 to Rs.1,50,000 <strong>and</strong> above Rs.1,50,000.Table 5. Showing Annual Income of Resp<strong>on</strong>dentsSr. No Annual Income Frequency PercentageCumulativepercentage1 Less than Rs.5,000 9 3.0 3.02 Rs.5,001to Rs.10,000 81 27.0 30.3 Rs.10,001 to Rs.15,000 102 34.0 64.04 Rs.15,001 to Rs.20,000 52 17.3 81.34 Above Rs.20,000 56 18.7 100.0TOTAL 300 100Source: Primary DataThe annual family income of <strong>the</strong> resp<strong>on</strong>dents is c<strong>on</strong>sidered for <strong>the</strong> study. The above tableclearly shows that 9 percent of <strong>the</strong> resp<strong>on</strong>dents bel<strong>on</strong>g to income level of less than Rs.5, 000,27 percent of <strong>the</strong> resp<strong>on</strong>dents bel<strong>on</strong>g to income level Rs.5,000- Rs 10,000, 34 percent of <strong>the</strong>resp<strong>on</strong>dents bel<strong>on</strong>g to income level Rs.10,001-Rs 15,000, 17.3 percent of <strong>the</strong> resp<strong>on</strong>dentsbel<strong>on</strong>g to income level Rs.15,001-Rs 20,000,<strong>and</strong> remaining 18.7 percent of <strong>the</strong> resp<strong>on</strong>dentsbel<strong>on</strong>g to <strong>the</strong> high income level of above Rs.20,000. Majority of <strong>the</strong> resp<strong>on</strong>dents bel<strong>on</strong>g to<strong>the</strong> level of Rs.10,001-Rs 15,000.Educati<strong>on</strong>al StatusEducati<strong>on</strong> is important for all human beings. It is very important in <strong>the</strong> modern electr<strong>on</strong>icworld to adapt to modern principles <strong>and</strong> techniques. For this purpose <strong>the</strong> Educati<strong>on</strong>al Statusof <strong>the</strong> resp<strong>on</strong>dents are classified into four groups Viz., primary level, Higher sec<strong>on</strong>dary,Graduati<strong>on</strong>, Post-Graduati<strong>on</strong> <strong>and</strong> professi<strong>on</strong>al. Educati<strong>on</strong> plays an important role inimproving knowledge, attitude, tendency <strong>and</strong> temperament of <strong>the</strong> customers.Table 6. Showing Educati<strong>on</strong>al Status of Resp<strong>on</strong>dentsSr. No Educati<strong>on</strong>al StatusNo. ofCumulativePercentageResp<strong>on</strong>dentspercentage1 SSLC 25 8.3 8.32 HSC 31 10.3 18.63 Under Graduate 75 25.0 43.64 Post Graduati<strong>on</strong> 169 56.4 100.0TOTAL 300 100Source: Primary DataThe above table 4.3.3 indicates that, 8.3 percent of <strong>the</strong> resp<strong>on</strong>dents are having SSLC, 10.3percent of sample resp<strong>on</strong>dents are having higher sec<strong>on</strong>dary level educati<strong>on</strong>, 25 percent areGraduate level <strong>and</strong> 56.4 percent are post graduate level. Hence, it is c<strong>on</strong>cluded that amajority of <strong>the</strong> sample resp<strong>on</strong>dents are Post Graduates. They can be a guiding factor foro<strong>the</strong>rs.VOLUME NO.1, ISSUE NO.3 ISSN 2277-116622
ABHINAVNATIONAL MONTHLY REFEREED JOURNAL OF REASEARCH IN COMMERCE & MANAGEMENTwww.abhinavjournal.comTable 7. Showing Frequency of Purchase of KVI ProductsSr. NoOpini<strong>on</strong>No. ofCumulativePercentageResp<strong>on</strong>dentspercentage1 Frequently 7 2.3 2.32 Moderately 183 61.0 61.03 Whenever I come across 104 34.7 34.74 Not interested 6 2.0 100.0TOTAL 300 100.0Source: Primary DataFrom <strong>the</strong> table it is clear that 61% of <strong>the</strong> resp<strong>on</strong>dents buy KVI products moderately, 34.7%whenever <strong>the</strong>y come across it, 2.3% buy frequently <strong>and</strong> 2% are not interested in buying KVIproducts.Table 8. Showing Quality of Products – <strong>Customer</strong>s Percepti<strong>on</strong> (Q12)Sr. No Opini<strong>on</strong>No. ofCumulativePercentageResp<strong>on</strong>dentspercentage1 Very Good 32 10.7 10.72 Good 208 69.3 69.33 Average 60 20.0 100.0TOTAL 300 100.0Source: Primary DataFrom <strong>the</strong> above table clear that, 69.3% of resp<strong>on</strong>dents perceive that KVI products aregood, 20% feel <strong>the</strong>y are average <strong>and</strong> 10.7% of resp<strong>on</strong>dents perceive that <strong>the</strong> quality of KVIproducts are Very good.Table 9. Showing Satisfacti<strong>on</strong> of KVI Products (Q13)Sr. No Opini<strong>on</strong>No. ofCumulativePercentageResp<strong>on</strong>dentspercentage1 Yes 265 88.3 88.32 No 35 11.7 100.0TOTAL 300 100.0Source: Primary DataThe table shows that 88.3% of resp<strong>on</strong>dents are satisfied with KVI products <strong>and</strong> 11.7% arenot satisfied with <strong>the</strong> same.VOLUME NO.1, ISSUE NO.3 ISSN 2277-116623
ABHINAVNATIONAL MONTHLY REFEREED JOURNAL OF REASEARCH IN COMMERCE & MANAGEMENTwww.abhinavjournal.comTable 10. Showing Comparis<strong>on</strong> of Quality of KVI Products & O<strong>the</strong>r Market items (Q15)Sr. No Opini<strong>on</strong>No. ofCumulativePercentageResp<strong>on</strong>dentspercentage1 Excellent 16 5.3 5.32 Good 146 48.7 48.73 Moderate 130 43.3 43.34 Bad 3 1.0 1.05 No Idea 5 1.7 100.0TOTAL 300 100.0Source: Primary DataIt is inferred that, 48.7% of resp<strong>on</strong>dents feel that <strong>the</strong> quality of KVI products are good,43.3% perceive it is moderate, 5.3% feel it is excellent <strong>and</strong> 1% of resp<strong>on</strong>dents perceive <strong>the</strong>quality is bad compared to o<strong>the</strong>r market items.Table 11. Showing percepti<strong>on</strong> about packing of KVI Products (Q16)Sr. No Opini<strong>on</strong>No. ofCumulativePercentageResp<strong>on</strong>dentspercentage1 Attractive 21 7.0 7.02 Moderate 182 60.7 60.73 Not attractive 97 32.3 100.0TOTAL 300 100.0Source: Primary DataThe table reveals that 60.7% of resp<strong>on</strong>dents perceive <strong>the</strong> packing to be moderate, 32.3% feelit is not attractive <strong>and</strong> 7% perceive it to be attractive.Table 12. Showing preferred allocati<strong>on</strong> of funds for buying KVI products (Q17)Sr. No IncomeNo. ofCumulativePercentageResp<strong>on</strong>dentspercentage1 Rs 500-Rs 1000 215 71.7 71.72 Rs 1000- Rs 2000 75 25.0 25.03 Rs 2000-Rs 3000 8 2.7 2.74 Above Rs 3000 2 .7 100.0TOTAL 300 100.0It‟s clear that, 71.7% resp<strong>on</strong>dents would allocate Rs.500- Rs.1000 for purchase of KVIproducts, 25% Rs.1000- Rs.2000, 2.7% would allocate Rs.2000-Rs.3000.VOLUME NO.1, ISSUE NO.3 ISSN 2277-116624
ABHINAVNATIONAL MONTHLY REFEREED JOURNAL OF REASEARCH IN COMMERCE & MANAGEMENTwww.abhinavjournal.comTable 13. Showing loyalty <strong>towards</strong> a Specific Product (Q18)Sr. No Opini<strong>on</strong> No. of Resp<strong>on</strong>dents Percentage Cumulative percentage1 Yes 135 45.0 45.02 No 165 55.0 55.0TOTAL 300 100.0 100.0Source: Primary DataThe table reveals that 45% of resp<strong>on</strong>dents are loyal <strong>towards</strong> a specific product <strong>and</strong> 55% ofresp<strong>on</strong>dents are not loyal <strong>towards</strong> a specific product.Table 14. The source of informati<strong>on</strong> about KVIPSr. No SourceNo. ofCumulativePercentageResp<strong>on</strong>dentspercentage1 News paper 57 19.0 19.02 Fellow worker/friend 81 27.0 46.03 Relatives 69 23.0 69.04 Government 93 31.0 100.0TOTAL 300 100.0From <strong>the</strong> table, it is inferred that 19 % of resp<strong>on</strong>dents came to know about <strong>the</strong> KVI productthrough Newspaper, 27% of <strong>the</strong> resp<strong>on</strong>dents through fellow worker/ friend, 23% of <strong>the</strong>resp<strong>on</strong>dents through relatives <strong>and</strong> remaining 31% of <strong>the</strong> resp<strong>on</strong>dent through government.Table 15. Availability of KVIPSr. No Opini<strong>on</strong> No. of Resp<strong>on</strong>dents PercentageCumulativepercentage1 Yes 244 81.3 81.32 No 56 18.7 100.0TOTAL 300 100.0It is clear that, 81.3% of resp<strong>on</strong>dents‟ have revealed that KVI products are available all over<strong>the</strong> city whereas 18.7% of resp<strong>on</strong>dents tell that <strong>the</strong>y are not available.Table 16. Frequency of purchase of KVIPSr. No Frequency No. of Resp<strong>on</strong>dents PercentageCumulativepercentage1 Twice a m<strong>on</strong>th 58 19.3 19.32 Once in a m<strong>on</strong>th 194 64.7 84.03 Weekly 48 16.0 100.0TOTAL 300 100.0It is clear that, 19.3% of resp<strong>on</strong>dents purchase KVIP <strong>on</strong>ce a m<strong>on</strong>th, 64.7% of <strong>the</strong> resp<strong>on</strong>dentstwice a m<strong>on</strong>th <strong>and</strong> 16% of <strong>the</strong> resp<strong>on</strong>dents purchase KVI products weekly.VOLUME NO.1, ISSUE NO.3 ISSN 2277-116625
ABHINAVNATIONAL MONTHLY REFEREED JOURNAL OF REASEARCH IN COMMERCE & MANAGEMENTwww.abhinavjournal.comTable 17. Influences to <strong>the</strong> Purchase Decisi<strong>on</strong>Sr. No SourceNo. ofCumulativePercentageResp<strong>on</strong>dentspercentage1 Parents 15 5.0 5.02 Husb<strong>and</strong> 10 3.3 8.33 Pers<strong>on</strong>al experience 220 73.3 81.74 Advertisement 40 13.3 95.05 Any o<strong>the</strong>r 15 5.0 100.0TOTAL 300 100.0The table reveals that 5% of parents influence purchase decisi<strong>on</strong>, 3.3% are influenced byhusb<strong>and</strong>, 73.3% by pers<strong>on</strong>al experience <strong>and</strong> 13.3% by advertisement <strong>and</strong> remaining 5% byo<strong>the</strong>r reas<strong>on</strong>s.CONCLUSIONKhadi <strong>and</strong> Village Industries play <strong>the</strong> crucial role in <strong>the</strong> part of marketing <strong>the</strong> products. KVIc<strong>on</strong>cept itself formed to bring <strong>the</strong> social reform in <strong>the</strong> Below Poverty line people <strong>and</strong> up lift<strong>the</strong>m. So based up<strong>on</strong> <strong>the</strong> needs <strong>and</strong> taste of <strong>the</strong> <strong>Customer</strong> <strong>the</strong> Products are manufactured by<strong>the</strong> KVI. Those products are found to be reas<strong>on</strong>able <strong>and</strong> affordable by <strong>the</strong> <strong>Customer</strong>. Khadihas gained worldwide appreciati<strong>on</strong> as it is h<strong>and</strong>made, durable, l<strong>on</strong>g lasting <strong>and</strong> organic innature. The fabric is produced by <strong>the</strong> masses for <strong>the</strong> masses. It is associated with G<strong>and</strong>hianphilosophy as well as makes a fashi<strong>on</strong> statement. Through <strong>the</strong> medium of khadi weaving, <strong>the</strong>weaver expresses art <strong>and</strong> designing by <strong>the</strong> spindle <strong>and</strong> loom. It is widely accepted in <strong>the</strong>Indian fashi<strong>on</strong> circle. Leading fashi<strong>on</strong> designers now include it in <strong>the</strong>ir collecti<strong>on</strong> bydesigning clo<strong>the</strong>s with khadi material. There is huge dem<strong>and</strong> for it in internati<strong>on</strong>al market,especially in western countries.This study reveals that <strong>the</strong> overviews about <strong>the</strong> products manufactured by <strong>the</strong> KVI areSatisfactory. The <strong>Customer</strong> <strong>Attitude</strong> <strong>towards</strong> <strong>the</strong> purchase decisi<strong>on</strong>s are influenced more by<strong>the</strong> way of trust worthy, service, price <strong>and</strong> quality. It is an attempt to study <strong>the</strong> KVI product<strong>and</strong> its awareness <strong>and</strong> preference <strong>towards</strong> <strong>the</strong> KVI products is being surveyed to make thisstudy complete. As a result, it has been observed from <strong>the</strong> resp<strong>on</strong>dent that <strong>the</strong> KVI productsare qualitative <strong>and</strong> pricing is reas<strong>on</strong>able <strong>and</strong> affordable. But <strong>the</strong> customer also expressed <strong>the</strong>need of improvement in packing. It is an idea of bringing a social change in <strong>the</strong> ec<strong>on</strong>omyexclusively for <strong>the</strong> middle class community.SUGGESTIONSThe products manufactured by <strong>the</strong> KVI do not have high marketing potential for <strong>the</strong>customers are not widely using <strong>the</strong>se products. While, <strong>the</strong> products are not attractivepacking‟s, catchy advertisements <strong>and</strong> comparatively user friendly <strong>the</strong>reforeimprovements are an essential requirements <strong>on</strong> all <strong>the</strong>se aspects.The main aim of <strong>the</strong> people who buy <strong>the</strong>se products is to help <strong>and</strong> promote socialreform. To alleviate this hurdle, <strong>the</strong> KVI should be more active in explaining <strong>the</strong>quality <strong>the</strong>ir products to <strong>the</strong> customers. Door to door canvassing will go in al<strong>on</strong>gway to mass sale of <strong>the</strong> products.VOLUME NO.1, ISSUE NO.3 ISSN 2277-116626
ABHINAVNATIONAL MONTHLY REFEREED JOURNAL OF REASEARCH IN COMMERCE & MANAGEMENTwww.abhinavjournal.comThe products made are mostly h<strong>and</strong>icraft items, H<strong>on</strong>ey, food items, lea<strong>the</strong>r <strong>and</strong>khaddar products etc. KVI should develop innovative ideas in bringing out newvarieties of products.KVI should c<strong>on</strong>centrate more <strong>on</strong> <strong>the</strong> quality of products <strong>and</strong> improve <strong>the</strong> attractivepacking.The Government is to take special initiative to sell <strong>the</strong>se products throughdepartment stores.The KVI should strive hard to be more customers – friendly in order to makecustomer to frequent <strong>the</strong>m instead of buying <strong>on</strong>ce a m<strong>on</strong>th.The KVI shops that sells <strong>the</strong>se products should be have prominent place <strong>and</strong> with attractivesign boards. In additi<strong>on</strong> displaying <strong>the</strong> products with catchy words.REFERENCESReports:Khadi & Village Industries Commissi<strong>on</strong> H<strong>and</strong>book, Ministry of MSME statistics reportJournals:Books:1. Alex<strong>and</strong>er Serenko <strong>and</strong> Andrea Stach (2009), “The Impact of Expectati<strong>on</strong>Disc<strong>on</strong>firmati<strong>on</strong> <strong>on</strong> <strong>Customer</strong> Loyalty <strong>and</strong> Recommendati<strong>on</strong> Behavior”: InvestigatingOnline Travel <strong>and</strong> Tourism Services, Journal of Informati<strong>on</strong> Technology Management,Vol. XX (3), pp. 26-42.2. Alreck, P. <strong>and</strong> S. Robert (2002), Gender Effects <strong>on</strong> Internet, Catalogue<strong>and</strong> Store Shopping, Journal of Database Marketing, January, Vol. 9(2),pp. 150-63.3. Carpenter, J. M. <strong>and</strong> Moore, Marguerite, (2006), C<strong>on</strong>sumer Demographics, Storeattributes <strong>and</strong> Retail format choice in <strong>the</strong> US Grocery Market, Internati<strong>on</strong>al Journal ofRetail & Distributi<strong>on</strong> Management, Vol. 34 (6), pp.434-452.4. Cassill, N. <strong>and</strong> Williams<strong>on</strong>, N. (1994), Department Store Cross-shoppers, Journal ofApplied Business Research, Vol. 10 (4), pp. 88-97.5. Cha J. (2001), Planned <strong>and</strong> Unplanned Apparel Purchase Typology <strong>and</strong> relatedVariables, unpublished PhD <strong>the</strong>sis, Seoul Nati<strong>on</strong>al University, Seoul (c<strong>on</strong>sult Park),pp.79-86.1. Adcock, D., Halborg, A. <strong>and</strong> Ross, C. (2001), Marketing Principles & Practices, 4 thEditi<strong>on</strong>, Gosport: Pears<strong>on</strong> Educati<strong>on</strong> Limited.2. Amit Mookerjee, <strong>and</strong> Kenneth (2007), A C<strong>on</strong>ey <strong>and</strong> C<strong>on</strong>sumer Behavior - BuildingMarketing Strategy, Tata McGraw Hill Publishers, New Delhi,pp. 127-129.3. Arunabha (2005), C<strong>on</strong>sumer Behavior, S<strong>on</strong>ali Publicati<strong>on</strong>s, New Delhi, p.70.VOLUME NO.1, ISSUE NO.3 ISSN 2277-116627
ABHINAVNATIONAL MONTHLY REFEREED JOURNAL OF REASEARCH IN COMMERCE & MANAGEMENTwww.abhinavjournal.com4. Barry Berman <strong>and</strong> Joel R Evans (2005), Retail Management: A Strategic Approach,Prentice - Hall of India (P) Ltd., New Delhi, pp.17-22.5. Berman B, Evans J.R, Retail Management: A Strategic Approach, Prentice - Hall ofIndia (P)6. Davis, B. <strong>and</strong> Ward, P. (2002), Managing Retail C<strong>on</strong>sumpti<strong>on</strong>, Wiley, L<strong>on</strong>d<strong>on</strong>, pp.161-178.7. Dominique Xardel (2004), C<strong>on</strong>sumer Behavior - C<strong>on</strong>cepts, Applicati<strong>on</strong>s <strong>and</strong> <str<strong>on</strong>g>Case</str<strong>on</strong>g>s,Vikas Publishing House private Ltd., Mumbai, p.10.8. Houthakker, H.S. <strong>and</strong> Taylor, L.D. (1970), C<strong>on</strong>sumer Dem<strong>and</strong> in <strong>the</strong> United States1929–1970, Analysis <strong>and</strong> Projecti<strong>on</strong>s, Cambridge, Harvard University Press, p.28.9. Hoyer, Wayne D. <strong>and</strong> Deborah J. MacInnis (2010), “C<strong>on</strong>sumer Behaviour,” FifthEditi<strong>on</strong> Mas<strong>on</strong>, Ohio: South - Western Cengage Learning, pp.13-16.VOLUME NO.1, ISSUE NO.3 ISSN 2277-116628


