Water and Wastewater Technologies Export Market Plan
Water and Wastewater Technologies Export Market Plan
Water and Wastewater Technologies Export Market Plan

You also want an ePaper? Increase the reach of your titles
YUMPU automatically turns print PDFs into web optimized ePapers that Google loves.
<strong>Water</strong> <strong>and</strong><br />
<strong>Wastewater</strong><br />
<strong>Technologies</strong><br />
<strong>Export</strong> <strong>Market</strong> <strong>Plan</strong><br />
U.S. DEPARTMENT OF COMMERCE<br />
International Trade Administration<br />
Washington, D.C.<br />
August 2002<br />
<strong>Water</strong> <strong>and</strong> <strong>Wastewater</strong> <strong>Export</strong> <strong>Market</strong> <strong>Plan</strong>—–
Library of Congress Cataloging-in-Publication Data<br />
<strong>Water</strong> <strong>and</strong> wastewater technologies export market plan.<br />
p. cm.<br />
1. <strong>Water</strong> purification equipment industry—United States. 2. <strong>Export</strong> marketing—<br />
United States. I. United States. International Trade Administration.<br />
HD9718.5.W383 U6378 2002<br />
628'.068’8—dc21<br />
ISBN 0-16-051188-7<br />
For sale by the Superintendent of Documents, U.S. Government Printing Office<br />
Internet: http://bookstore.gpo.gov<br />
Telephone: (202) 512-1800<br />
Fax: (202) 512-2250<br />
Mail: Stop SSOP, Washington, DC 20402-0001<br />
Stock number: 003-009-00727-5<br />
This report was prepared under contract to the U.S. Department of Commerce by PA<br />
Government Services Inc., 1530 Wilson Boulevard, Suite 400, Arlington, VA 22209; tel.<br />
(703) 351-0300; fax: (703) 351-6166; Internet: www.paconsulting.com. Conclusions <strong>and</strong><br />
statements expressed in this report are those of the contractor <strong>and</strong> do not necessarily<br />
represent the views or policies of the U.S. government.<br />
The full text of this report is available on the International Trade Administration’s Internet<br />
site at www.environment.ita.doc.gov. Reprints on paper or microfiche are available for<br />
purchase from the National Technical Information Service, 5285 Port Royal Road,<br />
Springfield, VA 22161; tel. (800) 553-6847; Internet: www.ntis.gov.<br />
Federal Recycling Program<br />
Printed on recycled paper.<br />
–—U.S. ii Department of Commerce, International Trade Administration<br />
2002073561
Contents<br />
Executive Summary .—.—.—.—.—.—.—.—.—.—.—.—.—.—.—.—.—.—.—.—.—.—.—.—.—.—.— v<br />
1. Overview of the Global <strong>Market</strong> for <strong>Water</strong> <strong>and</strong> <strong>Wastewater</strong> <strong>Technologies</strong> .—.—.—.—.—.—.—.—.—.— 1<br />
<strong>Market</strong> Size <strong>and</strong> Characteristics.—.—.—.—.—.—.—.—.—.—.—.—.—.—.—.—.—.—.—.—.—.—. 3<br />
Trends Affecting the <strong>Water</strong> <strong>and</strong> <strong>Wastewater</strong> Industry—.—.—.—.—.—.—.—.—.—.—.—.—.—.—.—. 6<br />
2. U.S. Competitive Position in the <strong>Market</strong> .—.—.—.—.—.—.—.—.—.—.—.—.—.—.—.—.—.—. . 10<br />
Major Foreign Competitors . .—.—.—.—.—.—.—.—.—.—.—.—.—.—.—.—.—.—.—.—.—.—. 10<br />
Competitiveness by <strong>Market</strong> Segment .—.—.—.—.—.—.—.—.—.—.—.—.—.—.—.—.—.—.—.—.<br />
13<br />
3. Increasing Competitiveness of the U.S. <strong>Water</strong> Industry—.—.—.—.—.—.—.—.—.—.—.—.—.—.—. 17<br />
Underst<strong>and</strong>ing Local <strong>Market</strong>s .—.—.—.—.—.—.—.—.—.—.—.—.—.—.—.—.—.—.—.—.—.—. 17<br />
Positioning to Enter the <strong>Market</strong> .—.—.—.—.—.—.—.—.—.—.—.—.—.—.—.—.—.—.—.—.—.—. 19<br />
Funding <strong>and</strong> Financing Options.—.—.—.—.—.—.—.—.—.—.—.—.—.—.—.—.—.—.—.—.—.—. 22<br />
4. Best Prospects in <strong>Water</strong> <strong>and</strong> <strong>Wastewater</strong> Treatment .—.—.—.—.—.—.—.—.—.—.—.—.—.—. 28<br />
Australia .—.—.—.—.—.—.—.—.—.—.—.—.—.—.—.—.—.—.—.—.—.— .—.—.—.—. 30<br />
Brazil .—.—.—.—.—.—.—.—.—.—.—.—.—.—.—.—.—.—.—.—.—.— .—.—.—.—.—. 32<br />
People’s Republic of China .—.—.—.—.—.—.—.—.—.—.—.—.—.—.—.—.—.—.—.—.—. 34<br />
Egypt .—.—.—.—.—.—.—.—.—.—.—.—.—.—.—.—.—.—.—.—.— .—.—.—.—.—.—. 40<br />
India —.—.—.—.—.—.—.—.—.—.—.—.—.—.—.—.—.—.—.—.—.— .—.—.—.—.—.—. 43<br />
Japan .—.—.—.—.—.—.—.—.—.—.—.—.—.—.—.—.—.—.—.—.— .—.—.—.—.—.—. 47<br />
Mexico .—.—.—.—.—.—.—.—.—.—.—.—.—.—.—.—.—.—.—.— .—.—.—.—.—.—. 49<br />
Republic of Korea (South Korea) .—.—.—.—.—.—.—.—.—.—.—.—.— .—.—.—.—.—. 54<br />
Saudi Arabia .—.—.—.—.—.—.—.—.—.—.—.—.—.—.—.—.—.— .—.—.—.—.—.—. 56<br />
Spain—.—.—.—.—.—.—.—.—.—.—.—.—.—.—.—.—.—.—.—.— .—.—.—.—.—.—. . 59<br />
Taiwan —.—.—.—.—.—.—.—.—.—.—.—.—.—.—.—.—.—.—.—.— .—.—.—.—.—.—. 60<br />
United Kingdom —.—.—.—.—.—.—.—.—.—.—.—.—.—.—.—.—.— .—.—.—.—.—.—. 62<br />
Appendices<br />
Appendix A: Major International <strong>Water</strong> <strong>and</strong> <strong>Wastewater</strong> Projects .—.—.—.—.—.—.—.—.—.—. . 65<br />
Appendix B: Government <strong>and</strong> Industry Contact List.—.—.—.—.—.—.—.—.—.—.— .—.—.—. . 74<br />
Appendix C: <strong>Water</strong> <strong>and</strong> <strong>Wastewater</strong> Industry Trade Associations .—.—.—.—.—.—.—.—.—.—. . 78<br />
Appendix D: International Programs Affecting the <strong>Water</strong> <strong>and</strong> <strong>Wastewater</strong> Industry .—.—.—.—.—.—. 80<br />
Appendix E: U.S. Environmental Trade Working Group Contacts .—.—.—.—.—.—.—.—.—.—. . 86<br />
Appendix F: Helpful Documents .—.—.—.—.—.—.—.—.—.— .—.—.—.—. . .—.—.—.—. 88<br />
Appendix G: <strong>Water</strong> Equipment HTS Numbers .—.—.—.—.—.—.—.—.—.— .—.—.—.—.—. . 89<br />
Appendix H: U.S. <strong>Export</strong>s of <strong>Water</strong> Equipment by Country, 1996–2000 .—.—.—.—.—.—.—.—.—. 90<br />
Appendix I: <strong>Water</strong> Equipment <strong>Export</strong>s by HS Number, 1996–2000 .—.—.—.—.—.—.—.—.—.—. 95<br />
Appendix J: U.S. Imports of <strong>Water</strong> Equipment by Country, 1996–2000 .—.—.—.—.—.—.—.—.—. 96<br />
Appendix K: U.S. Imports of <strong>Water</strong> Equipment by HS Number, 1996–2000 .—.—.—.—.—.—.—.—. 100<br />
<strong>Water</strong> <strong>and</strong> <strong>Wastewater</strong> <strong>Export</strong> <strong>Market</strong> <strong>Plan</strong>—– iii
ADB Asian Development Bank<br />
AfDB African Development Bank<br />
APAZU National Program for Potable <strong>Water</strong> <strong>and</strong><br />
Sewerage in Urban Zones<br />
ASEAN Association of Southeast Asian Nations<br />
BECC Border Environment Cooperation<br />
Commission<br />
BOT Build-operate-transfer<br />
BOO Build-own-operate<br />
B2B business-to-business<br />
B2C business-to-consumer<br />
CNA National <strong>Water</strong> Commission<br />
DACON Data on Consulting Firms<br />
DCA Development Credit Authority<br />
EBI Environmental Business International<br />
EBRD European Bank for Reconstruction <strong>and</strong><br />
Development<br />
EEAA Egyptian Environmental Affairs Agency<br />
EPA Environmental Protection Agency<br />
EU European Union<br />
Ex-Im Bank <strong>Export</strong>-Import Bank of the United States<br />
GEF Global Environment Facility<br />
GEEMF I <strong>and</strong> II Global Environment Emerging <strong>Market</strong>s<br />
Funds<br />
HS Harmonized Commodity Description <strong>and</strong><br />
Coding System<br />
HTS Harmonized Tariff Schedule<br />
IBRD International Bank for Reconstruction <strong>and</strong><br />
Development<br />
IDA International Development Agency<br />
IDB Inter-American Development Bank<br />
IDBI Industrial Development Bank of India<br />
IFC International Finance Corporation<br />
IFCI Industrial Finance Corporation of India<br />
Abbreviations <strong>and</strong> Acronyms<br />
iv–—U.S.<br />
Department of Commerce, International Trade Administration<br />
IMF International Monetary Fund<br />
IRBI Industrial Reconstruction Bank of India<br />
JETRO Japan External Trade Organization<br />
KOWACO Korea <strong>Water</strong> Resources Corporation<br />
LIFE Lemna Infrastructure Financing Enterprise<br />
MHUNC Ministry of Housing Utilities <strong>and</strong> New<br />
Communities (Egypt)<br />
MIGA Multilateral Investment Guarantee Agency<br />
MPWWR Ministry of Public Works <strong>and</strong> <strong>Water</strong><br />
Resources (Egypt)<br />
m3 cubic meters<br />
n.a. not available<br />
NGO non-governmental organization<br />
NADBank North American Development Bank<br />
NAFTA North American Free Trade Agreement<br />
OECD Organization for Economic Cooperation <strong>and</strong><br />
Development<br />
OPIC Overseas Private Investment Corporation<br />
PEFCO Private <strong>Export</strong> Funding Corporation<br />
PVC polyvinyl chloride<br />
RMB yuan renminbi (Chinese currency)<br />
SBA U.S. Small Business Administration<br />
SWCC Saline <strong>Water</strong> Conversion Corporation<br />
TDA U.S. Trade <strong>and</strong> Development Agency<br />
TIFA Trade <strong>and</strong> Investment Framework Agreement<br />
UNDP United Nations Development Program<br />
US-AEP U.S.-Asia Environmental Partnership<br />
USAID U.S. Agency for International Development<br />
UV ultraviolet<br />
WB World Bank<br />
WTO World Trade Organization<br />
Note: Unless otherwise noted, dollar figures given are U.S. dollars.
This report is designed to serve as a guide for U.S. exporters<br />
of water <strong>and</strong> wastewater technologies <strong>and</strong> services<br />
<strong>and</strong> focuses on two segments of the water market:<br />
1. <strong>Water</strong> equipment <strong>and</strong> chemicals: equipment,<br />
supplies, <strong>and</strong> maintenance for the delivery <strong>and</strong><br />
treatment of water <strong>and</strong> wastewater.<br />
2. Engineering <strong>and</strong> construction services: engineering,<br />
construction, design, management, operation<br />
<strong>and</strong> maintenance, etc.<br />
Over 300 private U.S. companies export filters, pumps,<br />
valves, pipes, instruments, <strong>and</strong> other equipment, as well<br />
as chemical <strong>and</strong> biological products for water <strong>and</strong> wastewater<br />
treatment. There are several hundred water engineering<br />
<strong>and</strong> consulting firms in the United States, many<br />
of which offer their services internationally. By concentrating<br />
on the market segments where U.S. industry is<br />
most competitive, this report aims to engage more water<br />
<strong>and</strong> wastewater technology firms in exporting their products<br />
overseas.<br />
The <strong>Market</strong><br />
The global water market has been growing rapidly over<br />
the last decade <strong>and</strong> constitutes well over a third of the<br />
global environmental market. <strong>Market</strong> pricing, combined<br />
with the growing privatization of water <strong>and</strong> wastewater<br />
utilities, generates private capital to create <strong>and</strong> maintain<br />
rational water markets. The market is enhanced by more<br />
consistent enforcement of environmental regulations,<br />
worldwide consolidation of the water industry, <strong>and</strong> the<br />
proliferation of e-business. The global market for water<br />
<strong>and</strong> wastewater equipment <strong>and</strong> chemicals was about $42<br />
billion in 1998. The market is expected to grow at a 4<br />
percent rate over the next two years <strong>and</strong> reach almost<br />
$47.3 billion by 2002.<br />
The United States, Western Europe, <strong>and</strong> Japan represent<br />
over 80 percent of the total market size, but those<br />
are mature markets with an average growth of 3-4 percent.<br />
The economic recovery of emerging markets in<br />
Executive Summary<br />
Southeast Asia <strong>and</strong> Latin America from the 1997 crisis,<br />
rapid expansion of the Chinese economy, <strong>and</strong> increasing<br />
dem<strong>and</strong> in the Middle East promise a return to the 10 to<br />
20 percent pre-1997 market growth in the developing<br />
world.<br />
The major players in the global water <strong>and</strong> wastewater<br />
industry come from the United States, France, Britain,<br />
Japan, <strong>and</strong> Germany. Integrated, global companies based<br />
in France (Vivendi, Lyonnaise des Eaux) generally have<br />
a competitive edge over U.S. firms, which are mostly<br />
smaller <strong>and</strong> more specialized. European water companies<br />
that have more experience in operating <strong>and</strong> serving<br />
privatized or partially privatized facilities have a competitive<br />
edge in emerging markets where water <strong>and</strong> wastewater<br />
sectors are undergoing privatization.<br />
U.S. companies are major exporters of water <strong>and</strong><br />
wastewater equipment <strong>and</strong> chemicals. Many U.S. firms<br />
produce specialty equipment that is not available from<br />
other suppliers, which gives them a competitive edge in<br />
certain niche markets. U.S. companies frequently find<br />
industrial wastewater projects <strong>and</strong> projects funded by U.S.<br />
development agencies.<br />
In the area of water <strong>and</strong> wastewater treatment works,<br />
the market is dominated by French <strong>and</strong> British companies.<br />
In particular, companies from France <strong>and</strong> the United<br />
Kingdom are by far the most competitive in providing<br />
integrated packages of designing, building, managing,<br />
<strong>and</strong> even owning water infrastructures around the world.<br />
Strategies to Improve U.S. Industry<br />
Competitiveness<br />
In order to succeed in the international market for water<br />
<strong>and</strong> wastewater technologies <strong>and</strong> services, U.S. firms<br />
should be aware of the realities of doing business overseas,<br />
know <strong>and</strong> be able to take advantage of particular<br />
market characteristics, <strong>and</strong> use available information<br />
support services.<br />
According to environmental exporters, key success<br />
factors in overseas markets include:<br />
<strong>Water</strong> <strong>and</strong> <strong>Wastewater</strong> <strong>Export</strong> <strong>Market</strong> <strong>Plan</strong>—– v
Table 1. <strong>Water</strong> <strong>and</strong> <strong>Wastewater</strong> <strong>Market</strong>s of 12 “Best Prospect” Countries<br />
Total <strong>Market</strong> Size Annual Growth Share of Imports U.S. Import <strong>Market</strong> Share<br />
Country (millions of dollars) (percent) (percent) (percent)<br />
Australia 603 (1999) 7 70 55<br />
Brazil 1,700 (1998) 10 20 35<br />
China (including Hong Kong) 5,336 (1999) 25–35 35 12<br />
Egypt 856 (1998) 10 90 35<br />
India 1,180 (2000) 15 40 25<br />
Japan 6,000 (1996) 5–8 n.a. n.a.<br />
South Korea 3,400 (2000) 13 40 20<br />
Mexico 2,390 (2000) 10 80 70<br />
Saudi Arabia* 357 (1998) 5 85 16<br />
Spain 4,000 (1998) n.a. n.a. n.a.<br />
Taiwan 1,900 (1999) 9 75 28<br />
United Kingdom 4,000 (2000) 4 55 25<br />
* The data for Saudi Arabia only address the desalination market.<br />
n.a. = not available<br />
See Chapter 4, “Best Prospects in <strong>Water</strong> <strong>and</strong> <strong>Wastewater</strong> Treatment,” for additional information on these countries <strong>and</strong> data sources.<br />
• Underst<strong>and</strong>ing local markets. The first step in a<br />
successful export market strategy is knowing where<br />
the markets are <strong>and</strong> how to access them. Knowing the<br />
stage <strong>and</strong> pace of market development, host government<br />
regulations, <strong>and</strong> the local business culture is<br />
critical in prioritizing business development efforts.<br />
• Building alliances <strong>and</strong> working effectively with<br />
partners in export countries. Local partnerships <strong>and</strong><br />
representation are desirable for U.S. companies so that<br />
they can learn about attractive market opportunities<br />
before the competitors. Methods for developing a local<br />
presence range from hiring a local consultant or agent<br />
to represent the firm, to establishing a local office or<br />
a joint venture. Engaging in joint exporting activities<br />
(through joint ventures <strong>and</strong> consortia) with other U.S.<br />
firms is another way to enter a new market.<br />
• Finding financing for export activities. Development<br />
assistance is a primary driver in the water <strong>and</strong><br />
wastewater sectors of emerging market countries.<br />
Multilateral development agencies strongly support,<br />
through technical <strong>and</strong> financial assistance, water<br />
supply infrastructure, wastewater treatment systems,<br />
<strong>and</strong> watershed clean-up projects, representing<br />
significant market opportunities. U.S. technology <strong>and</strong><br />
services companies also can take advantage of<br />
many U.S. investment <strong>and</strong> export credit programs.<br />
Commercial financing sources include private<br />
investment funds, U.S. <strong>and</strong> local commercial banks,<br />
<strong>and</strong> vendor financing.<br />
vi –—U.S. Department of Commerce, International Trade Administration<br />
Best Prospect Countries<br />
The countries that represent best prospects for U.S.<br />
exporters of water <strong>and</strong> wastewater equipment <strong>and</strong> services<br />
are determined by a number of factors, including:<br />
• The overall size of the water <strong>and</strong> wastewater market<br />
in the country;<br />
• The openness of that market to imports (partly reflected<br />
in the share of imports in the total market);<br />
• The market’s growth rate; <strong>and</strong><br />
• The historic U.S. position in the market <strong>and</strong> the U.S.<br />
import market share.<br />
This report contains market profiles of 12 countries<br />
that fit several of these criteria: Australia, Brazil, China,<br />
Egypt, India, Japan, South Korea, Mexico, Saudi Arabia,<br />
Spain, Taiwan, <strong>and</strong> the United Kingdom, representing a<br />
mix of developed <strong>and</strong> developing countries. Table 1 presents<br />
a summary of the estimates of the principal market<br />
indicators for the profiled countries.<br />
Brazil, China, India, Japan, South Korea, Mexico,<br />
Spain, Taiwan, <strong>and</strong> the United Kingdom all have water<br />
<strong>and</strong> wastewater markets that exceed $1 billion in size.<br />
Such emerging markets as China, India, South Korea,<br />
Taiwan, Mexico, <strong>and</strong> Brazil have enormous potential due<br />
to the extent of unmet water supply <strong>and</strong> sewerage needs.<br />
Their growth rate usually exceeds 10 percent per year.<br />
Japan, the United Kingdom, Spain, <strong>and</strong> Australia are
mature markets with slower growth, but their sheer size<br />
<strong>and</strong> favorable business climate make them worth exporters’<br />
consideration. The two Middle Eastern countries described<br />
in this report (Egypt <strong>and</strong> Saudi Arabia) are niche<br />
markets for U.S. exporters. Egypt is a large, exclusively<br />
aid-driven market, where massive U.S. foreign aid gives<br />
a significant advantage to American companies. Saudi<br />
Arabia is a highly specialized market with a focus on<br />
desalination technology, where the United States also has<br />
a good strategic position.<br />
<strong>Water</strong> <strong>and</strong> <strong>Wastewater</strong> <strong>Export</strong> <strong>Market</strong> <strong>Plan</strong>—– vii
–—U.S. Department of Commerce, International Trade Administration
Chapter 1<br />
Overview of the Global <strong>Market</strong> for <strong>Water</strong> <strong>and</strong><br />
<strong>Wastewater</strong> <strong>Technologies</strong><br />
Access to safe drinking water <strong>and</strong> contamination of surface<br />
water bodies is a major problem in many areas of<br />
the globe. In the year 2000, approximately 1.1 billion<br />
people (18 percent of the world’s population) lacked access<br />
to safe drinking water, <strong>and</strong> 2.4 billion (40 percent of<br />
the total population) lacked adequate sanitation. 1 Most<br />
of these people live in developing countries, predominantly<br />
in rural areas. Over one-third of the urban water<br />
supplies in developing countries operate only intermittently,<br />
while roughly 40 percent of the drinking water<br />
supply is lost due to leakage in the distribution systems.<br />
At the same time, countries have come to recognize<br />
that an adequate supply of clean water <strong>and</strong> effective<br />
wastewater treatment is essential for sustainable development.<br />
Governments <strong>and</strong> organizations around the<br />
world are investing substantial sums in water <strong>and</strong> wastewater<br />
improvements. These expenditures create real opportunities<br />
for U.S. companies to export water <strong>and</strong><br />
wastewater equipment technology.<br />
1. Global <strong>Water</strong> Supply <strong>and</strong> Sanitation Assessment: 2000 Report,<br />
World Health Organization, 2000.<br />
In many parts of the world, wastewater receives no<br />
treatment before being discharged into water bodies. The<br />
resulting pollution of the receiving waters threatens the<br />
human <strong>and</strong> animal populations that rely on these streams,<br />
lakes, <strong>and</strong> rivers as a source of drinking water or<br />
habitat.<br />
Today, it is estimated that only 66 percent of wastewater<br />
is treated in Europe, 35 percent in Asia, 14 percent<br />
in Latin America, <strong>and</strong> almost none in Africa. 2 Many important<br />
water bodies throughout the world are in violation<br />
of local water quality st<strong>and</strong>ards. More than 35<br />
percent of drinking water supplies in Africa are contaminated<br />
in violation of national health st<strong>and</strong>ards, 21 percent<br />
in Asia, <strong>and</strong> 18 percent in Latin America <strong>and</strong> the<br />
Caribbean.<br />
The principal constraints to the development of the<br />
water supply <strong>and</strong> sanitation sector are funding limitations,<br />
inadequate cost recovery, <strong>and</strong> inadequate operation <strong>and</strong><br />
maintenance. As water sources become contaminated,<br />
2. Ibid.<br />
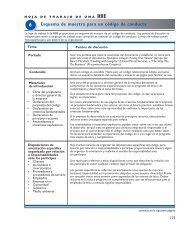
Figure 1.1. Global Facts about <strong>Water</strong> Supply <strong>and</strong> <strong>Wastewater</strong> Treatment, 2000<br />
Worldwide:<br />
• 18% of the world’s population<br />
lacks access to safe drinking<br />
water.<br />
• 40% of the world’s<br />
population lacks<br />
adequate sanitation.<br />
In Latin America:<br />
• 14% of wastewater is treated.<br />
• 18% of drinking water supplies<br />
in Latin America <strong>and</strong> the<br />
Caribbean violate national health<br />
st<strong>and</strong>ards.<br />
In Asia:<br />
• Only 35% of wastewater is treated.<br />
• 21% of drinking supplies are in<br />
violation of national health<br />
st<strong>and</strong>ards.<br />
In Africa:<br />
• Almost no wastewater is treated.<br />
• Over 35% of drinking supplies<br />
violate health st<strong>and</strong>ards.<br />
Source: World Health Organization, Global <strong>Water</strong> Supply <strong>and</strong> Sanitation Assessment: 2000 Report (Geneva: World Health Organization,<br />
2000).<br />
<strong>Water</strong> <strong>and</strong> <strong>Wastewater</strong> <strong>Export</strong> <strong>Market</strong> <strong>Plan</strong><br />
1
increasingly effective <strong>and</strong> costly treatment methods are<br />
required. The lack of access to water for drinking <strong>and</strong><br />
industrial uses, as well as to wastewater treatment, is<br />
thus a major limitation to sustainable development.<br />
The incentives for improving water <strong>and</strong> wastewater<br />
infrastructure in developed countries are primarily regulatory,<br />
particularly in Western Europe, where countries<br />
are struggling to comply with the European Union’s increasingly<br />
stringent regulations for drinking water quality<br />
<strong>and</strong> wastewater treatment st<strong>and</strong>ards. In developing<br />
countries, the driver is public health: 2.2 million people,<br />
most of them children, die there every year from diseases<br />
associated with the lack of safe drinking water,<br />
inadequate sanitation, or poor hygiene. 3<br />
As a result, the global water market has been growing<br />
rapidly over the last decade <strong>and</strong> constitutes well over<br />
a third of the global environmental market. This report<br />
is designed to serve as a guide for U.S. exporters of water<br />
<strong>and</strong> wastewater technologies <strong>and</strong> services <strong>and</strong> focuses<br />
on two segments of the water market:<br />
1. <strong>Water</strong> Equipment <strong>and</strong> Chemicals: Equipment,<br />
supplies, <strong>and</strong> maintenance for the delivery <strong>and</strong><br />
treatment of water <strong>and</strong> wastewater. About 2,800<br />
2 U.S. Department of Commerce, International Trade Administration<br />
private U.S. companies supply filters, pumps,<br />
valves, pipes, instruments, <strong>and</strong> other equipment, as<br />
well as chemical <strong>and</strong> biological products. However,<br />
only 800 of them can be regarded as potential<br />
exporters, while almost 300 are actually exporting<br />
their products. 4<br />
2. Consulting <strong>and</strong> Engineering Services: Engineering,<br />
consulting, design, management, operation,<br />
<strong>and</strong> maintenance, etc. There are several hundred<br />
water engineering <strong>and</strong> consulting firms in the<br />
United States, many of which offer their services<br />
internationally.<br />
This report does not address two other segments of<br />
the water market—water utilities <strong>and</strong> wastewater treatment<br />
works—for two reasons. First, municipal water <strong>and</strong><br />
wastewater utilities account for 81 percent <strong>and</strong> 95 percent<br />
of their respective market segments in the United<br />
States <strong>and</strong> are not involved in any exporting activities.<br />
The remaining newly privatized utilities are mostly<br />
owned by large French <strong>and</strong> British water companies. 5<br />
Second, U.S. private utility companies cannot compete<br />
for water utility markets overseas. The poor performance<br />
3. Ibid. 4. “The U.S. <strong>Water</strong> Industry,” Environmental Business Journal, Vol.<br />
XII, No. 7/8, 1999.<br />
5. Ibid.<br />
Figure 1.2. Global <strong>Market</strong> Size: <strong>Water</strong> <strong>and</strong> <strong>Wastewater</strong> Equipment <strong>and</strong> Chemicals, 1996–2002 (billions of dollars)<br />
$50<br />
40<br />
30<br />
20<br />
10<br />
0<br />
$38.4<br />
$40.1<br />
Source: “Global Environmental <strong>Market</strong>s 2000,” Environmental Business Journal, Vol. 12, No. 9/10 (Sept./Oct. 2000).<br />
$42.0<br />
$47.3<br />
1996 1997 1998 2002<br />
(estimate)
of Azurix in a water <strong>and</strong> wastewater concession in Buenos<br />
Aires, Argentina is a recent example of this phenomenon.<br />
By concentrating on the market segments where U.S.<br />
industry is most competitive, this report aims to engage<br />
more water <strong>and</strong> wastewater technology firms in exporting<br />
their products overseas.<br />
<strong>Market</strong> Size <strong>and</strong> Characteristics<br />
According to Environmental Business International, 6<br />
the global market for water <strong>and</strong> wastewater equipment<br />
<strong>and</strong> chemicals was about $42 billion in 1998, which represents<br />
a 5 percent growth over the 1996 figure. The<br />
market is expected to grow at a 4 percent rate over the<br />
next two years <strong>and</strong> reach almost $47.3 billion by 2002.<br />
<strong>Water</strong>-related services also represent a significant share<br />
of the $27.2 billion (1998) consulting <strong>and</strong> engineering<br />
market.<br />
The United States, Western Europe, <strong>and</strong> Japan represent<br />
over 80 percent of the total market size, but those<br />
are mature markets with an average growth of 3 to 4 percent.<br />
At the same time, the economic recovery of emerging<br />
markets in Southeast Asia <strong>and</strong> Latin America from<br />
the 1997 crisis, rapid expansion of the Chinese economy,<br />
<strong>and</strong> broadening dem<strong>and</strong> in the Middle East promise a<br />
return to the 10 to 20 percent pre-1997 market growth in<br />
the developing world.<br />
6. “Global Environmental <strong>Market</strong>s 2000,” Environmental Business<br />
Journal, Vol. XII, No. 9/10, 2000.<br />
Figure 1.3. Share of the Global <strong>Market</strong> for <strong>Water</strong> <strong>and</strong><br />
<strong>Wastewater</strong> Equipment, 1998<br />
Other<br />
Industrialized<br />
Countries<br />
41%<br />
United States<br />
39%<br />
Developing<br />
Countries<br />
20%<br />
Source: World Health Organization, Global <strong>Water</strong> Supply <strong>and</strong><br />
Sanitation Assessment: 2000 Report (Geneva: World Health<br />
Organization, 2000).<br />
With assistance from international donors, public sector<br />
agencies in developing countries, particularly in Asia,<br />
have launched multi-million-dollar spending programs<br />
in water supply <strong>and</strong> sanitation, <strong>and</strong> are encouraging private<br />
sector investments. The proportion of industrialized<br />
countries’ development assistance devoted to water supply<br />
<strong>and</strong> sanitation increased steadily from 1986 to 1996,<br />
rising from 3.4 percent to 6.6 percent of total assistance.<br />
In terms of cash, bilateral commitments from industrialized<br />
countries for assistance to developing countries in<br />
this sector rose from $1 billion in 1986 to $2.9 billion in<br />
1996 (these numbers do not include France). In absolute<br />
terms, Germany’s <strong>and</strong> Japan’s donor funding was particularly<br />
large: Germany spent nearly $3.4 billion, while<br />
Japan invested $9.5 billion. 7<br />
The <strong>Market</strong> in Industrialized Countries<br />
The water <strong>and</strong> wastewater equipment markets in industrialized<br />
countries, including the United States, comprise<br />
roughly 80 percent of the global market, or<br />
approximately $34 billion a year. The U.S. market for<br />
water <strong>and</strong> wastewater equipment accounts for about half<br />
of this amount ($16.6 billion in 1999). 8 However, these<br />
markets are growing slowly, <strong>and</strong> the dem<strong>and</strong> is mostly<br />
satisfied by existing suppliers. (See Chapter 4 for detailed<br />
country profiles.)<br />
In Japan, opportunities exist mainly in wastewater<br />
treatment (this market segment exceeds $6 billion annually<br />
9 ), due to water pollution control regulations, which<br />
were tightened in 1996–1997. This regulatory pressure<br />
has raised dem<strong>and</strong> for both upgrading municipal sewage<br />
treatment facilities <strong>and</strong> industrial effluent treatment<br />
equipment (particularly for toxic chemicals). A need also<br />
exists for “closed” systems for recycling industrial<br />
wastewater.<br />
Canada’s market is well penetrated by U.S. water <strong>and</strong><br />
wastewater equipment suppliers. Despite very slow market<br />
growth, some opportunities still exist in municipal<br />
wastewater treatment. Many Canadian municipalities<br />
have aging sewerage infrastructure <strong>and</strong> even discharge<br />
untreated sewage into the waterways.<br />
The EU market for water <strong>and</strong> wastewater treatment<br />
equipment is driven primarily by the need to comply with<br />
the EU Urban <strong>Wastewater</strong> Treatment Directive. In addition,<br />
large multinational food <strong>and</strong> beverage, <strong>and</strong> chemical<br />
companies are installing effluent treatment works at<br />
7. Global <strong>Water</strong> Supply <strong>and</strong> Sanitation Assessment: 2000 Report,<br />
World Health Organization, 2000.<br />
8. “The U.S. <strong>Water</strong> Industry,” Environmental Business Journal,<br />
Vol. XII, No. 7/8, 1999.<br />
9. Environmental <strong>Market</strong> in Japan, U.S. Department of Commerce,<br />
International Trade Administration, 1998.<br />
<strong>Water</strong> <strong>and</strong> <strong>Wastewater</strong> <strong>Export</strong> <strong>Market</strong> <strong>Plan</strong><br />
3
many of their European sites in response to local environmental<br />
regulations <strong>and</strong> the desire to enhance their<br />
public image.<br />
The biggest market opportunities in the European<br />
Union are for biological treatment equipment for both<br />
aerobic <strong>and</strong> anaerobic treatment systems. There is also<br />
significant dem<strong>and</strong> for separation equipment for new<br />
municipal wastewater treatment plants. The market for<br />
high purification (filtration, membrane) systems for industrial<br />
<strong>and</strong> other commercial applications is also expected<br />
to grow quickly in Western Europe: from about<br />
$300 million in 1999 to over $400 million in 2006. 10<br />
Overall, the market for newer, advanced technologies is<br />
exp<strong>and</strong>ing at the expense of traditional equipment.<br />
In France, where 9 percent of the population (mostly<br />
in rural areas) still does not have access to centralized<br />
wastewater treatment systems, wastewater treatment technologies<br />
represent the largest segment of the water market.<br />
In order to comply with EU regulations, all French<br />
towns must install secondary treatment by 2006. In environmentally<br />
sensitive areas, tertiary treatment is required<br />
in all communities with at least 10,000 residents.<br />
However, opportunities for U.S. firms are very limited<br />
in France: Vivendi (formerly Compagnie Générale des<br />
Eaux) <strong>and</strong> ONDEO (formerly Suez Lyonnaise des Eaux)<br />
dominate the French market, while their closest competitors<br />
hardly reach a 1 percent market share.<br />
The British market for water <strong>and</strong> wastewater equipment<br />
is among the largest <strong>and</strong> fastest growing in Europe,<br />
<strong>and</strong> is relatively open to foreign players. Recently privatized<br />
water utilities <strong>and</strong> major industrial users (for example,<br />
power <strong>and</strong> chemical companies) account for more<br />
than 60 percent of the market.<br />
A major market opportunity in Germany is the rehabilitation<br />
<strong>and</strong> upgrading of the water <strong>and</strong> wastewater infrastructure.<br />
The cost of constructing new sewerage<br />
systems in the New L<strong>and</strong>s (formerly East Germany) is<br />
about $50 billion, plus another $15 billion for water <strong>and</strong><br />
wastewater system modernization projects in the New<br />
L<strong>and</strong>s <strong>and</strong> $13 billion in the Old L<strong>and</strong>s. 11<br />
Countries in southern Europe (Italy, Spain, Portugal,<br />
<strong>and</strong> Greece) represent even greater opportunities, although<br />
mostly for EU companies. In Italy, over 60 percent<br />
of the population does not have access to adequate<br />
sewage treatment, <strong>and</strong> 30 percent of the wastewater is<br />
discharged untreated. An overall investment of about $62<br />
billion over the next ten years will be needed to bring<br />
Italy’s water <strong>and</strong> wastewater infrastructure up to EU st<strong>and</strong>ards.<br />
12 Spain has a similar situation, with 78 percent of<br />
10. European Commercial Scale <strong>Water</strong> Treatment Equipment <strong>Market</strong>s,<br />
Frost <strong>and</strong> Sullivan, no. 3822-15, 2000.<br />
11. Ibid.<br />
12. Ibid.<br />
4 U.S. Department of Commerce, International Trade Administration<br />
the major cities not meeting the European Union’s water<br />
pollution control directives, <strong>and</strong> just over 40 percent of<br />
the population having access to adequate drinking water<br />
treatment systems. Over the next five years, Spanish public<br />
<strong>and</strong> private companies will invest about $30 billion<br />
in water purification equipment <strong>and</strong> sewage treatment<br />
systems. 13<br />
The Organization for Economic Cooperation <strong>and</strong> Development<br />
(OECD) countries of Central Europe (Pol<strong>and</strong>,<br />
Hungary, <strong>and</strong> the Czech Republic) <strong>and</strong> other Central <strong>and</strong><br />
East European nations are also making efforts to improve<br />
their environmental performance in view of their planned<br />
accession to the European Union. The market is stimulated<br />
by the implementation of the European Union’s<br />
drinking water quality <strong>and</strong> wastewater management st<strong>and</strong>ards<br />
but is also restricted by limited availability of funds<br />
<strong>and</strong> administrative failings. As the Central European<br />
markets are being restructured to involve more private<br />
participation, the main opportunities are in industrial<br />
wastewater treatment, as well as rehabilitation of the antiquated<br />
water supply <strong>and</strong> municipal wastewater treatment<br />
systems. Optimistic assessments valued this market<br />
at as high as $4 billion in 1999, with substantial shortterm<br />
growth prospects, particularly due to the large lending<br />
program of the European Investment Bank. 14 For<br />
example, Hungary’s water <strong>and</strong> wastewater market is currently<br />
estimated at $200–250 million a year <strong>and</strong> is growing<br />
by 5 to 8 percent annually. 15 However, Central <strong>and</strong><br />
East European water markets are likely to be dominated<br />
by EU firms.<br />
The <strong>Market</strong> in Developing Countries<br />
Many developing countries are unable to meet their<br />
population’s need for safe drinking water <strong>and</strong> adequate<br />
sanitation. As the populations <strong>and</strong> economies of these<br />
countries grow, so does the dem<strong>and</strong> for water. The development<br />
of environmental regulations also contributes<br />
to the need for water <strong>and</strong> wastewater technology <strong>and</strong><br />
monitoring. This section discusses the current conditions<br />
in developing regions of the world.<br />
Table 1.1 shows average annual investments in water<br />
supply <strong>and</strong> municipal wastewater treatment in Africa,<br />
Asia, <strong>and</strong> Latin America <strong>and</strong> the Caribbean from 1990<br />
to 2000. The table demonstrates that investments in water<br />
supply are significantly higher than those in sanitation,<br />
which contributes to the large deficit of adequate<br />
13. Ibid.<br />
14. Central <strong>and</strong> Eastern European <strong>Water</strong> <strong>and</strong> <strong>Wastewater</strong> Treatment<br />
Equipment <strong>Market</strong>s, issued by Frost <strong>and</strong> Sullivan, no. 3792-15, 2000.<br />
15. Hungary: <strong>Water</strong> Treatment Equipment <strong>and</strong> Services, Industry Sector<br />
Analysis, U.S. <strong>and</strong> Foreign Commercial Service <strong>and</strong> U.S. Department<br />
of State, 2001.
Table 1.1. Average Annual Investments in <strong>Water</strong> Supply<br />
<strong>and</strong> Sanitation in Developing Countries, 1990–2000<br />
(billions of U.S. dollars)<br />
Latin<br />
Africa Asia America Total<br />
<strong>Water</strong> Supply 4.09 6.06 2.41 12.56<br />
National Investment 1.21 3.82 1.86 6.89<br />
External Support 2.88 2.24 0.55 5.67<br />
Sanitation 0.54 1.10 1.50 3.14<br />
National Investment 0.26 0.95 1.11 2.32<br />
External Support 0.28 0.15 0.39 0.82<br />
Total 4.63 7.16 3.91 15.70<br />
Source: World Health Organization, 2000.<br />
sanitation access in the developing world. It also shows<br />
that most of the investments come from domestic sources<br />
rather than international donors.<br />
Asia. Despite the financial crisis in 1997 <strong>and</strong> 1998, the<br />
Asian water market is stronger than ever. In fact, the economic<br />
turmoil made some Asian governments seek to<br />
increase the efficiency of the water <strong>and</strong> sewage infrastructure<br />
by attracting private capital. The potential dem<strong>and</strong><br />
is enormous: 80 percent of the global population without<br />
access to improved sanitation <strong>and</strong> almost two-thirds without<br />
access to improved water supply live in Asia. However,<br />
most of this dem<strong>and</strong> is concentrated in the markets<br />
that are in the early stages of development: Southeast Asia,<br />
China, <strong>and</strong> India. Many of these countries have recently<br />
promulgated new environmental regulations that are likely<br />
to give a boost to the industrial wastewater treatment<br />
market as well. Particularly large investments are made<br />
in water supply, a significant share of which comes from<br />
bilateral <strong>and</strong> multilateral lending sources. The market in<br />
China alone exceeds $1 billion per year, with annual<br />
growth approaching 15 percent.<br />
In more developed Asian economies, the market is either<br />
saturated (as in Japan) or growing very slowly (for<br />
example, in South Korea, Taiwan, <strong>and</strong> Singapore). At the<br />
same time, these more mature markets offer opportunities<br />
for sophisticated water <strong>and</strong> wastewater treatment<br />
technologies produced in the United States.<br />
Middle East/North Africa. <strong>Water</strong> is not only an environmental<br />
issue, it’s also a critical economic <strong>and</strong> political<br />
issue in the Middle East. Middle Eastern countries<br />
struggle to alleviate water shortages for drinking <strong>and</strong> irrigation<br />
through desalination <strong>and</strong> wastewater reuse. <strong>Water</strong><br />
supply <strong>and</strong> wastewater treatment systems, especially<br />
in rural areas, require upgrading <strong>and</strong> expansion. The desalination<br />
technologies market is projected to grow par-<br />
ticularly fast, from about $1 billion in 1999 to $2.5 billion<br />
in 2006. 16<br />
While oil-rich countries of the region (Saudi Arabia<br />
<strong>and</strong> the small states of the Persian Gulf) are able to fund<br />
these projects themselves, others (Egypt, Jordan) rely<br />
heavily on foreign donor assistance. Opportunities for<br />
U.S. firms exist mainly in countries that have good political<br />
relations with the United States: Saudi Arabia,<br />
Egypt, <strong>and</strong> Jordan. Egypt is the largest recipient of U.S.<br />
bilateral assistance in the world, with the U.S. Agency<br />
for International Development (USAID) having spent<br />
billions of dollars on this country’s water <strong>and</strong> wastewater<br />
infrastructure. (See Chapter 4 for more country-specific<br />
details.)<br />
Latin America. Latin America presents abundant market<br />
opportunities in water <strong>and</strong> wastewater treatment—<br />
both in contract operations of utilities (most of which are<br />
being privatized), as well as subsequent technology investments.<br />
Although drinking water coverage is relatively<br />
high in Latin America (85 percent), growing urban populations<br />
<strong>and</strong> obsolete, inefficient infrastructure create a<br />
dem<strong>and</strong> for investments in water supply. Most drinking<br />
water projects are publicly financed, with additional<br />
monies coming from the World Bank, the Inter-American<br />
Development Bank (IDB), <strong>and</strong>, increasingly, Japanese<br />
bilateral funding. At the same time, water utility<br />
privatization has been a major market driver in Chile,<br />
Argentina, Mexico, Colombia, <strong>and</strong>, most recently, Brazil.<br />
In municipal wastewater treatment, private sector<br />
participation has not yet materialized in most Latin American<br />
countries (except Argentina <strong>and</strong> Chile), with most<br />
funds coming from multilateral <strong>and</strong> bilateral lenders.<br />
According to Environmental Business International,<br />
opportunities focus on about 550 municipal projects<br />
across the continent, amounting to over $40 billion of<br />
investment. 17 Opportunities in industrial wastewater treatment<br />
are much fewer, since governments in Latin<br />
America are unwilling or unable to enforce environmental<br />
regulations on industrial producers.<br />
Africa. Africa has the lowest water supply coverage of<br />
any region, with only 62 percent of the population having<br />
access to improved water supply (the situation is much<br />
worse in rural areas). Sanitation coverage in Africa is also<br />
poor (60 percent), with only Asia having lower coverage<br />
levels. Almost all African countries depend entirely on<br />
donor assistance to help them solve these problems. Most<br />
of this aid comes from multilateral lenders <strong>and</strong> donors<br />
16. Middle Eastern, North African, <strong>and</strong> European Desalination <strong>Plan</strong>t<br />
<strong>Market</strong>s, Frost <strong>and</strong> Sullivan, no. 3857-15, 2000.<br />
17. ”Global Environmental <strong>Market</strong>s 2000,” Environmental Business<br />
Journal, vol. XII, no. 9/10, 2000<br />
<strong>Water</strong> <strong>and</strong> <strong>Wastewater</strong> <strong>Export</strong> <strong>Market</strong> <strong>Plan</strong><br />
5
(the World Bank, the African Development Bank, <strong>and</strong><br />
the United Nations Development Program), as well as<br />
French <strong>and</strong> British bilateral development agencies (for<br />
their former colonies). The traditional domination of<br />
French <strong>and</strong> British companies, in addition to the generally<br />
unfavorable business climate, have deterred U.S.<br />
companies from exploring water-related opportunities in<br />
Sub-Saharan Africa.<br />
The Republic of South Africa is the biggest water<br />
market in Sub-Saharan Africa. The greatest market potential<br />
lies in the efforts to provide potable water <strong>and</strong> sanitation<br />
in rural <strong>and</strong> poorer urban areas that still have no<br />
access to these services. The annual market for water <strong>and</strong><br />
wastewater equipment was about $100 million in 1996,<br />
<strong>and</strong> has been growing at 12 to 15 percent per year. 18<br />
Newly Independent States. The states of the former<br />
Soviet Union offer potentially enormous opportunities in<br />
the water sector, particularly in municipal <strong>and</strong> industrial<br />
wastewater treatment. However, local funding resources<br />
are extremely limited, <strong>and</strong> the uncertainties of the<br />
business climate hamper market expansion beyond<br />
donor-funded projects. Large water <strong>and</strong> wastewater infrastructure<br />
projects funded by multilateral development<br />
banks in Russia, Ukraine, the Caucasus states, <strong>and</strong> Central<br />
Asia are essentially the only source of water <strong>and</strong><br />
wastewater equipment supply opportunities in this region.<br />
Trends Affecting the <strong>Water</strong> <strong>and</strong> <strong>Wastewater</strong><br />
Industry<br />
The global water industry has entered a period of revolutionary<br />
changes. <strong>Water</strong> prices are being adjusted to reflect<br />
quality, quantity, <strong>and</strong> specific end-use values. <strong>Market</strong><br />
pricing, combined with the growing privatization of water<br />
<strong>and</strong> wastewater utilities, generates private capital to<br />
create <strong>and</strong> maintain rational water markets. The market<br />
is further enhanced by the more consistent enforcement<br />
of environmental regulations, worldwide consolidation<br />
of the water industry, <strong>and</strong> proliferation of e-business.<br />
Privatization<br />
An important trend in recent years has been the move<br />
toward privatization of water <strong>and</strong> wastewater infrastructure<br />
throughout the world. Governments, even in developed<br />
countries, are faced with the stark reality of aging<br />
<strong>and</strong> inadequate infrastructure, unable to effectively de-<br />
18. South Africa: <strong>Water</strong> Treatment Services, Industry Sector Analysis,<br />
U.S. <strong>and</strong> Foreign Commercial Service <strong>and</strong> U.S. Department of<br />
State, 2000.<br />
6 U.S. Department of Commerce, International Trade Administration<br />
liver services to their rapidly growing populations. The<br />
economic reality associated with these problems is overwhelming<br />
<strong>and</strong> leads governments to turn to the private<br />
sector for assistance.<br />
Among OECD countries, the United Kingdom represents<br />
the most vivid example, with completely privatized<br />
water <strong>and</strong> wastewater operations in Engl<strong>and</strong> <strong>and</strong> Wales.<br />
In developing countries, Latin America <strong>and</strong> East Asia<br />
have been on the forefront of the water utility privatization<br />
trend. The increased role of the private sector<br />
leads to greater levels of investment in infrastructure <strong>and</strong><br />
service improvements, thereby offering enhanced opportunities<br />
for water <strong>and</strong> wastewater equipment suppliers.<br />
Compared to other infrastructure sectors such as telecommunications,<br />
power, <strong>and</strong> transportation, the water<br />
sector is viewed as more difficult to privatize because<br />
water supply <strong>and</strong> sanitation are considered by many to<br />
be social services. Additionally, because regulatory <strong>and</strong><br />
pricing mechanisms for water <strong>and</strong> wastewater are less<br />
well-established than for other infrastructure industries,<br />
many investors view the water sector as having relatively<br />
higher risks <strong>and</strong> lower profit margins than other infrastructure<br />
sectors.<br />
Perhaps because consumers willingly pay for water,<br />
but are more reluctant to pay for the indirect benefits of<br />
sewage treatment, private participation in developing<br />
countries has been far more common in water than in<br />
wastewater. In Latin America, however, increasing wealth<br />
has led to an extension of concessions to the sewerage<br />
subsector.<br />
Several public-private mechanisms have evolved to<br />
provide water <strong>and</strong> wastewater services. These are: (1)<br />
management contract, (2) lease, (3) concession, (4) buildoperate-transfer<br />
(BOT) <strong>and</strong> build-own-operate (BOO)<br />
schemes, <strong>and</strong> (5) asset sale. Under contract operations, a<br />
company is hired to operate <strong>and</strong> maintain the entire utility<br />
or a portion of the utility functions for a specified term;<br />
the company does not finance or develop new facilities.<br />
Under a lease arrangement, the private contractor typically<br />
finances working capital for smaller equipment <strong>and</strong><br />
infrastructure, along with operating, maintaining, <strong>and</strong><br />
managing the utility facilities. A concession typically<br />
includes the financing of most infrastructure <strong>and</strong> the<br />
concessionaire receives the system revenues as compensation.<br />
BOT <strong>and</strong> BOO schemes are typically concessions<br />
that include the private development of new water or<br />
wastewater facilities. Asset sales, or sale of shares,<br />
formally transfer the utility into the private sector. Table<br />
1.2 illustrates the different privatization scenarios <strong>and</strong><br />
the roles of the public <strong>and</strong> private sectors under each<br />
arrangement.<br />
About 50 percent of the contracts awarded in the last<br />
decade have been concession contracts. Countries seem
Table 1.2. Types of Privatization Arrangements in the <strong>Water</strong> Industry<br />
Management Contracts Lease Contracts BOT or BOO Full Concession Asset Sale<br />
Ownership public public public public private<br />
Investment public public private private private<br />
Operation private private private private private<br />
Tariff Collection public/private public/private public private private<br />
Source: Silva et al., “Private Participation in the <strong>Water</strong> <strong>and</strong> Sewerage Sector—Recent Trends,” Public Policy for the Private Sector, The World<br />
Bank Group, 1998.<br />
to favor concessions over other forms of private involvement<br />
because such arrangements allow them to take advantage<br />
of the efficiencies offered by private operators<br />
while maintaining control over the assets. Outright divestiture<br />
of water <strong>and</strong> wastewater assets is relatively<br />
rare. 19<br />
Although the numbers of international companies investing<br />
in water <strong>and</strong> wastewater projects in developing<br />
countries is growing, to date only a h<strong>and</strong>ful of companies<br />
have sponsored most of the projects. French water<br />
companies ONDEO, Vivendi, <strong>and</strong> SAUR International,<br />
along with Spain’s Aguas de Barcelona <strong>and</strong> the British<br />
firm Thames <strong>Water</strong>, accounted for 58 of the 79 projects<br />
tracked by the PPI Database from 1990 to 1997. 20 Only<br />
Vivendi <strong>and</strong> ONDEO operate in every region of the<br />
world. These international companies often team up with<br />
local companies, many of which were never involved in<br />
the water <strong>and</strong> wastewater business before, to form consortia<br />
for bidding on concessions.<br />
Consolidation <strong>and</strong> Globalization<br />
The shape of the global water <strong>and</strong> wastewater industry<br />
has changed considerably in the last decade. Widespread<br />
consolidation among manufacturing <strong>and</strong> service<br />
companies, as well as utilities, has led to the emergence<br />
of giants in the industry. Consolidation in the name of<br />
efficiency <strong>and</strong> globalization has brought together utilities<br />
<strong>and</strong> manufacturers across the globe. These newly<br />
consolidated companies have the ability to provide fullpackage<br />
solutions to their customers.<br />
The globalization <strong>and</strong> consolidation trends dominating<br />
water markets around the world have had a major<br />
impact on the U.S. water industry in recent years. French<br />
firm Vivendi’s purchase of U.S. Filter for $6.2 billion in<br />
1998 has created a company (whose $3.1 billion U.S. arm<br />
is now called Vivendi <strong>Water</strong>) with global revenues of<br />
19. Silva, et al., “Private Participation in the <strong>Water</strong> <strong>and</strong> Sewerage<br />
Sector—Recent Trends,” Public Policy for the Private Sector, The<br />
World Bank Group, 1998.<br />
20. “Private Sector Note No. 196,” PPI Project Database, The World<br />
Bank Group, 1999.<br />
about $20 billion in equipment <strong>and</strong> chemicals, utilities,<br />
concessions, <strong>and</strong> services. Vivendi <strong>Water</strong> now incorporates<br />
over 100 companies previously acquired by U.S.<br />
Filter. In 1999, the French firm ONDEO acquired Nalco<br />
Chemical <strong>and</strong> United <strong>Water</strong> Resources to increase its<br />
worldwide water <strong>and</strong> wastewater revenues to $6.3<br />
billion. These acquisitions have further shrunk the<br />
U.S. industry’s global market share, but also opened<br />
more markets for companies with a large base of U.S.<br />
employment, if not ownership.<br />
In another key development, Azurix Corporation, after<br />
becoming a publicly traded company in 1999, acquired<br />
Britain’s Wessex <strong>Water</strong> (water technology, engineering,<br />
<strong>and</strong> services) <strong>and</strong> Germany’s Lurgi Bamag GmbH (water<br />
process engineering), making it the largest American<br />
firm in the international water market. However, Azurix<br />
has recently failed financially in its large water concession<br />
in Argentina, <strong>and</strong> has not been performing well in<br />
its other engagements in developing countries. As a result,<br />
Azurix was re-acquired by its former parent company,<br />
Enron Corporation, in March 2001.<br />
U.S. water treatment equipment manufacturing companies<br />
are also consolidating. With Vivendi <strong>Water</strong> almost<br />
beyond reach of its U.S. competitors, Ionics ($351 million)<br />
is firmly in second place, followed by Osmonics<br />
($177 million), which doubled in size between 1993 <strong>and</strong><br />
1998, <strong>and</strong> <strong>Water</strong>link ($135 million), which grew 440 percent<br />
between 1995 <strong>and</strong> 1998. Consolidation is also evident<br />
in the water chemicals market, with Hercules, Inc.,<br />
becoming the world’s largest supplier of specialty chemicals<br />
for water treatment programs through a number of<br />
acquisitions. At the same time, there is practically no<br />
short-term growth envisioned in the U.S. water equipment<br />
<strong>and</strong> chemicals manufacturing markets outside Vivendi<br />
<strong>Water</strong>. This demonstrates that equipment-only<br />
suppliers are bound to lose market share to integrated<br />
equipment <strong>and</strong> services providers.<br />
With the growing privatization of utilities, the line<br />
separating water <strong>and</strong> wastewater utilities from companies<br />
selling products <strong>and</strong> services is increasingly blurred.<br />
Large companies such as Vivendi that own <strong>and</strong> run utility<br />
operations are also producing the equipment used as<br />
<strong>Water</strong> <strong>and</strong> <strong>Wastewater</strong> <strong>Export</strong> <strong>Market</strong> <strong>Plan</strong><br />
7
part of the investment, thus putting the end-user <strong>and</strong> the<br />
supplier under the same roof. A former U.S. Filter executive<br />
noted: “Virtually none of Vivendi’s business was<br />
equipment sales <strong>and</strong> virtually all of ours was, now we<br />
have their operations <strong>and</strong> services to offer <strong>and</strong> they have<br />
our equipment <strong>and</strong> technology.” 21 Large companies also<br />
have the added benefit of increased financial resources<br />
<strong>and</strong> stability to enable them to provide financing assistance<br />
to their customers. As a result of economies of<br />
scale <strong>and</strong> a market that is difficult to break into, smaller<br />
water <strong>and</strong> wastewater companies are left at a disadvantage<br />
in the global market when competing against these<br />
large corporations.<br />
The globalization in the water <strong>and</strong> wastewater industry<br />
has progressed to such an extent that it is now difficult<br />
to define what constitutes an American company. For<br />
example, successful water <strong>and</strong> wastewater delivery companies,<br />
i.e., those producing pipes, pumps, <strong>and</strong> filters,<br />
build manufacturing plants abroad. Identifying whether<br />
a pipe made abroad for an American-owned company<br />
should be considered an American export is not a simple<br />
matter. As a result, it is particularly difficult to identify<br />
the competitive advantage of American water <strong>and</strong> wastewater<br />
companies. In many ways, geographic ties are no<br />
longer relevant in a world of multinational partnerships.<br />
<strong>Market</strong> Pricing<br />
Global population growth <strong>and</strong> urbanization, along with<br />
regional water shortages, are increasing the dem<strong>and</strong> for<br />
clean water at an unprecedented rate. These factors, along<br />
with accelerating privatization of water <strong>and</strong> wastewater<br />
utilities, has led to the growing recognition that water is<br />
an economic good, <strong>and</strong> that in order to deliver reliable,<br />
adequate services to a wide range <strong>and</strong> growing number<br />
of customers, full-cost pricing mechanisms need to be<br />
implemented.<br />
For years, public utilities have relied on subsidies in<br />
addition to user fees to cover the costs of water supply,<br />
particularly in rural, agricultural, <strong>and</strong> low-income areas.<br />
Governments are starting to realize that the use of subsidies<br />
results in overall inefficiencies <strong>and</strong> lack of resources<br />
for improvements. This realization has started the trend<br />
toward the use of full-cost pricing, where the total cost<br />
of service delivery is passed on to the consumer, thereby<br />
promoting water conservation <strong>and</strong> increasing the financial<br />
<strong>and</strong> physical health of the utility.<br />
With growing privatization of utilities, market pricing<br />
models that capture the cost of service delivery will<br />
21. “Vivendi Acquisition of U.S. Filter Fuels Global Growth to $13<br />
Billion in <strong>Water</strong>,” Environmental Business Journal, vol. XII, no. 7/8,<br />
1999.<br />
8 U.S. Department of Commerce, International Trade Administration<br />
continue to exp<strong>and</strong>. Privatized utilities must be able to<br />
provide a service <strong>and</strong> remain financially sound. Some<br />
critics contend that full-cost pricing of water will put basic<br />
water services beyond the reach of many poorer users,<br />
<strong>and</strong> that providers of basic services should not profit<br />
from user fees. This has made privatization of water services<br />
<strong>and</strong> full-cost pricing controversial. In the long run,<br />
utilities that are able to fully capture the costs associated<br />
with the provision of their services are better able to maintain<br />
their facilities, invest in <strong>and</strong> maintain equipment, <strong>and</strong><br />
service their customers.<br />
Financing Sources<br />
Financing is critical to the success of water <strong>and</strong> wastewater<br />
projects in emerging markets. Governments faced<br />
with the challenge of meeting the dem<strong>and</strong> for water <strong>and</strong><br />
sewerage infrastructure growth <strong>and</strong> improvement are increasingly<br />
turning to private sources to finance these capital-intensive<br />
projects. New players include commercial<br />
banks <strong>and</strong> funds, as well as large water <strong>and</strong> wastewater<br />
firms themselves. One new trend in water <strong>and</strong> wastewater<br />
financing is the stock market. More <strong>and</strong> more companies<br />
have gone public, relinquishing private ownership<br />
to investors in exchange for needed capital for project<br />
financing.<br />
Many utilities also are requesting extended payment<br />
terms as a precondition to placing an order for new technology<br />
<strong>and</strong> equipment. At present, few companies can<br />
afford to take on their customer’s credit risk by providing<br />
sufficient funding for extended payment plans, but<br />
leading industry experts contend that exporting companies<br />
must be able to provide extended payment terms to<br />
initially win orders <strong>and</strong> build long-term relationships with<br />
the clients.<br />
Finding a financing source is no less important than<br />
ensuring project financeability. Project financeability<br />
means the lender gets its money back—with a profit <strong>and</strong><br />
within a reasonable timeframe—<strong>and</strong> requires the existence<br />
of a cost-recovery mechanism. If a country does not<br />
have the political will to impose <strong>and</strong> collect reasonable<br />
user fees, the project is unlikely to attract private capital<br />
sources.<br />
Regulatory Development<br />
National governments worldwide are increasing the<br />
stringency of both ambient <strong>and</strong> drinking water quality<br />
st<strong>and</strong>ards to combat the deterioration of their water resources<br />
<strong>and</strong> halt the spread of pollution. Among developed<br />
countries, this trend is particularly visible in the<br />
European Union, where EU directives compel member<br />
countries (<strong>and</strong> stimulate accession c<strong>and</strong>idates) to com-
ply with new, tougher regulations. With increasing pressure<br />
from international donors <strong>and</strong> neighboring countries,<br />
these trends are spreading to the developing world.<br />
In the developing world, while environmental regulations<br />
have been established, little has been done until recently<br />
to ensure enforcement. The recent trend in many<br />
developing countries, particularly in Southeast Asia, is<br />
toward increased monitoring of regulatory compliance<br />
<strong>and</strong> tougher sanctions for violations. With increased enforcement,<br />
monetary penalties, <strong>and</strong> corrective action requirements,<br />
industries are starting to internalize the costs<br />
of environmental compliance by investing in cleaner process<br />
technology <strong>and</strong> end-of-pipe treatment equipment.<br />
The impact on the market is a greater level of dem<strong>and</strong><br />
for industrial wastewater treatment equipment.<br />
Another trend in regulatory development is the integration<br />
of economic incentives into traditional comm<strong>and</strong><strong>and</strong>-control<br />
regulations. The comm<strong>and</strong>-<strong>and</strong>-control<br />
system is often seen as too confrontational in many developing<br />
countries. It also tends to emphasize endof-pipe<br />
pollution control technologies. Economic instruments<br />
(such as effluent charges <strong>and</strong> user fees) give<br />
industry the flexibility to comply with environmental requirements.<br />
The system encourages polluters to invest<br />
in the most efficient pollution abatement measures, including<br />
pollution prevention. In fact, some countries have<br />
adopted import duty waivers for environmentally cleaner<br />
industrial process technologies. The increasing use of<br />
pollution prevention has the potential in the future to alter<br />
the technological needs of industrial wastewater<br />
treatment.<br />
E-Business<br />
In many industries, the Internet has already made many<br />
changes in the way business is conducted. However, ecommerce<br />
has not had the same dramatic impact on the<br />
water industry, either in business-to-consumer (B2C) or<br />
in business-to-business (B2B) applications. In 1999, only<br />
18 percent of water treatment equipment manufacturing<br />
companies had Web pages <strong>and</strong> only 0.2 percent had online<br />
ordering capability. 22 A survey of 100 of the largest<br />
water utilities in the United States determined that less<br />
than 5 percent had the capability for customers to access<br />
<strong>and</strong> pay their bills over the Internet. 23<br />
Nevertheless, the water industry has made advances<br />
in e-commerce, beginning with basic on-line catalogues<br />
where utilities <strong>and</strong> other businesses can review equipment<br />
specifications <strong>and</strong> make purchases directly from<br />
manufacturers. Auction sites have also been developed<br />
to facilitate used equipment sales. However, to date much<br />
of the business transacted on the Internet has been for<br />
commodities, typically equipment for maintenance, repair,<br />
<strong>and</strong> operations.<br />
Recently, several companies have attempted to take<br />
the next step in B2B transactions by establishing digital<br />
marketplaces or e-hubs, which are designed to allow for<br />
more complex transactions such as requesting qualifications<br />
<strong>and</strong> proposals for engineered products, along with<br />
on-line tracking of procurements. At least one e-hub has<br />
already exp<strong>and</strong>ed its services to include trading of water<br />
rights between parties. Two e-hubs now operating in the<br />
water industry are VerticalNet’s <strong>Water</strong> Online, <strong>and</strong><br />
Azurix’s <strong>Water</strong>Desk.<br />
Employing e-commerce in lieu of traditional procurement<br />
vehicles can save both time <strong>and</strong> money for water<br />
utilities, as well as for the manufacturers of equipment.<br />
Estimates of savings for the procurer in other industries<br />
range from 2 to 39 percent. 24 Fulfillment cycles can be<br />
reduced by two-thirds, as can administrative costs; <strong>and</strong><br />
inventory costs of manufacturers can be reduced by 25<br />
to 50 percent. 25<br />
22. “The U.S. <strong>Water</strong> Industry,” Environmental Business Journal, vol.<br />
XII, no. 7/8, 1999.<br />
23. Survey by PA Consulting Group, July 2000.<br />
24. “B2B: 2B or Not 2B?” version 1.1, part 1 of 5, Goldman Sachs,<br />
November 12, 1999.<br />
25. Aberdeen Group, June 1999.<br />
<strong>Water</strong> <strong>and</strong> <strong>Wastewater</strong> <strong>Export</strong> <strong>Market</strong> <strong>Plan</strong><br />
9
The annual growth of the U.S. water <strong>and</strong> wastewater<br />
equipment <strong>and</strong> services industry between 1999 <strong>and</strong> 2003<br />
is estimated at about 8 percent. While the domestic market<br />
for water equipment is growing very slowly (by<br />
1 percent in 1999), the industry’s expansion in this market<br />
segment translates directly into the fast growth in exports,<br />
which went up from 26 percent of the total<br />
production volume in 1998 to 29 percent in 1999 (or about<br />
$5.9 billion). 26<br />
Despite this promising growth in exports, the vast<br />
majority of U.S. water companies are still focused on the<br />
North American marketplace <strong>and</strong> lack the capacity to<br />
compete for large global projects with European <strong>and</strong> Japanese<br />
firms. This chapter looks at the competitiveness of<br />
U.S. firms vis-à-vis their main business rivals from other<br />
countries in different water <strong>and</strong> wastewater industry segments<br />
<strong>and</strong> in different regions of the world.<br />
Major Foreign Competitors<br />
Chapter 2<br />
U.S. Competitive Position in the <strong>Market</strong><br />
The major players in the global water <strong>and</strong> wastewater<br />
industry come from the United States, France, the United<br />
Kingdom, Japan, <strong>and</strong> Germany. Integrated, global companies<br />
generally have a competitive edge over U.S. firms<br />
that are smaller, more specialized, <strong>and</strong> operate in an environment<br />
in which information is often protected rather<br />
than shared. European water companies that have more<br />
experience in operating <strong>and</strong> serving privatized or partially<br />
privatized facilities will have a competitive edge in<br />
emerging markets where water <strong>and</strong> wastewater sectors<br />
are undergoing privatization.<br />
U.S. companies are generally competitive in the water<br />
equipment <strong>and</strong> chemicals market segment but face<br />
very tough competition from French, British, <strong>and</strong> Japanese<br />
firms. In the area of water <strong>and</strong> wastewater treatment<br />
works, the market is dominated by French <strong>and</strong> British<br />
companies. In particular, companies from France <strong>and</strong> the<br />
United Kingdom are by far the most competitive in providing<br />
integrated packages that include designing, building,<br />
managing, <strong>and</strong> even owning water infrastructure.<br />
26. “The U.S. <strong>Water</strong> Industry,” Environmental Business Journal, vol.<br />
XII, no. 7/8, 1999.<br />
10 U.S. Department of Commerce, International Trade Administration<br />
Table 2.1 contains the list of the top ten water companies<br />
in the world. Two French companies, Vivendi <strong>and</strong><br />
ONDEO, are by far the largest, while other competitors<br />
to U.S. firms occupy almost all the other positions on<br />
the list.<br />
France<br />
In France, municipalities are responsible for water <strong>and</strong><br />
sewerage services, either by providing those services<br />
themselves or, more commonly, contracting them out. The<br />
private sector’s share in drinking water supply has increased<br />
from about 30 percent in the mid-1950s to 77<br />
percent in the late 1990s, <strong>and</strong> about 60 percent of the<br />
wastewater market is operated by private companies.<br />
This move to private management in France has led<br />
to the emergence of the two largest full-service water<br />
companies in the world: Vivendi with over $20 billion<br />
in revenues in 2000 <strong>and</strong> ONDEO with $6.3 billion in revenues<br />
in 2000. These firms represent the result of significant<br />
horizontal integration in the French water<br />
business. In the late 1980s, there were five private water<br />
27. Thames <strong>Water</strong> became part of Germany’s RWE Group in September<br />
2000.<br />
Table 2.1. Top 10 <strong>Water</strong> Firms in the World, 2000<br />
Rank Company Country <strong>Water</strong>-Related<br />
Revenues,<br />
$ billion<br />
1 Vivendi<br />
2 ONDEO<br />
3 Ebara Corporation<br />
4 Hercules, Inc.<br />
5 Severn Trent<br />
6 Thames <strong>Water</strong>27 France<br />
20.5<br />
France<br />
6.3<br />
Japan<br />
4.3<br />
United States 3.1<br />
United Kingdom 2.5<br />
United Kingdom 2.2<br />
7 Aguas de Barcelona Spain<br />
1.7<br />
8 AWG (Anglian <strong>Water</strong>) United Kingdom 1.4<br />
9 United Utilities United Kingdom 1.4<br />
10 American <strong>Water</strong><br />
Works Co.<br />
United States 1.3<br />
Source: Hoover’s Online (www.hoovers.com).
companies; today, there are three. Vivendi, SAUR, <strong>and</strong><br />
ONDEO contract with the local municipalities to operate<br />
water services <strong>and</strong> build new facilities. Both Vivendi<br />
<strong>and</strong> ONDEO have grown into global conglomerates, having<br />
leveraged their capital to exp<strong>and</strong> from infrastructure<br />
management services to water equipment manufacturing<br />
<strong>and</strong> even such sectors as hazardous <strong>and</strong> solid waste management,<br />
<strong>and</strong> telecommunications.<br />
Vivendi is the world leader in revenues received from<br />
drinking water distribution. With the acquisition of U.S.<br />
Filter in 1999, Vivendi became the world’s largest water<br />
company with 1999 net sales of 10.7 billion euros in the<br />
water <strong>and</strong> wastewater sector. In addition, the firm controls<br />
approximately 40 percent of the water <strong>and</strong> 30 percent<br />
of the wastewater markets in France. Vivendi<br />
currently operates in 100 countries <strong>and</strong> employs 275,000<br />
people.<br />
ONDEO has a long history of involvement overseas.<br />
In 1914, the company was active in North Africa, Central<br />
Africa, <strong>and</strong> the Pacific. From 1980 to 1990, it exp<strong>and</strong>ed<br />
internationally in the water <strong>and</strong> wastewater sector,<br />
mainly in the United Kingdom, Spain, <strong>and</strong> the United<br />
States. In 1993, the company won contracts in Argentina<br />
<strong>and</strong> Australia, <strong>and</strong> intensified international development<br />
in 1997 with water contracts in the Philippines, Hungary,<br />
Morocco, <strong>and</strong> Indonesia. In 1997, Compagnie de<br />
Suez merged with Lyonnaise des Eaux, becoming Suez<br />
Lyonnaise des Eaux. The newly named company joined<br />
with United <strong>Water</strong> Resources, Inc., a U.S. company, <strong>and</strong><br />
each acquired a 50 percent interest in United <strong>Water</strong> Services.<br />
With this merger, the company now manages water<br />
works for municipalities <strong>and</strong> local utilities, mostly in<br />
the northeastern United States. In 1999, the company<br />
acquired all of United <strong>Water</strong> Services. In 2001, the water<br />
division of Suez Lyonnaise des Eaux changed its name<br />
to ONDEO. ONDEO also owns Nalco Chemical, the<br />
top water chemical company.<br />
With more than 201,000 employees, ONDEO serves<br />
over 100 million people in over 120 countries: 32 million<br />
in North America, 42 million in Europe, 18 million<br />
in Asia, 5 million in Africa, <strong>and</strong> 22 million in South<br />
America. The company is also Europe’s fifth-largest private<br />
electricity supplier <strong>and</strong> a leader in waste services<br />
<strong>and</strong> cable in France <strong>and</strong> Belgium. In 1999, the group’s<br />
core businesses generated 43 percent of its revenues outside<br />
France <strong>and</strong> Belgium; by 2002 the goal is to increase<br />
this figure to 50 percent. 28<br />
Several key factors have enabled Vivendi <strong>and</strong> ONDEO<br />
to be successful in the international water <strong>and</strong> wastewater<br />
markets. First, the concession mechanism that has<br />
28. ONDEO’s Internet site (www.ondeo-nalco.com).<br />
been used in France is being modeled throughout the<br />
world, which has given these companies a competitive<br />
edge in bidding on these types of projects. Second, these<br />
companies are integrated, providing potential clients a<br />
full package, including experience in operating <strong>and</strong> maintaining<br />
facilities as well as collecting fees. Third, French<br />
companies have an advantage in terms of investments in<br />
long-term water projects, because French stock owners<br />
include banks <strong>and</strong> large financial institutions that can afford<br />
longer-term investment approaches, which are usually<br />
necessary for water <strong>and</strong> wastewater treatment-type<br />
projects. In contrast, U.S. companies are driven by profitability<br />
<strong>and</strong> individual investors who cannot afford or<br />
do not wish to take such a long-term approach. Finally,<br />
the French giants have been able to conduct market intelligence<br />
work to edge out competitors in bidding processes,<br />
with substantial support from French foreign<br />
embassies. Given their experience, access to capital,<br />
<strong>and</strong> market intelligence, these large firms are formidable<br />
competitors.<br />
Both Vivendi <strong>and</strong> ONDEO have substantial holdings<br />
in U.S. water <strong>and</strong> wastewater companies. Vivendi’s<br />
U.S. presence includes not only U.S. Filter but Air <strong>and</strong><br />
<strong>Water</strong> <strong>Technologies</strong> Corporation <strong>and</strong> numerous other<br />
companies in water equipment <strong>and</strong> water-related<br />
instrumentation.<br />
United Kingdom<br />
In 1989, the <strong>Water</strong> Act restructured the water industry<br />
<strong>and</strong> privatized the water <strong>and</strong> wastewater operations of<br />
the 10 water authorities in Engl<strong>and</strong> <strong>and</strong> Wales. The<br />
privatization was motivated in part by the need for an<br />
enormous investment of resources to bring the infrastructure<br />
up to the European st<strong>and</strong>ards. From 1990 through<br />
2000, the private water industry invested over $52 billion<br />
in water <strong>and</strong> wastewater system infrastructure improvements<br />
(see the section on the United Kingdom in<br />
Chapter 4 for more information about the U.K. water <strong>and</strong><br />
wastewater market). 29 The market liberalization at home<br />
has positioned several of the larger British firms such as<br />
Thames <strong>Water</strong>, Severn Trent, <strong>and</strong> AWG (formerly<br />
Anglian <strong>Water</strong>) to successfully compete in the international<br />
market.<br />
Notably, several British companies have formed alliances<br />
with leading U.S. companies in order to access the<br />
U.S. market. These include:<br />
29. Financial Performance <strong>and</strong> Expenditure of the <strong>Water</strong> Companies<br />
in Engl<strong>and</strong> <strong>and</strong> Wales: 1999–2000 (Birmingham, United Kingdom:<br />
Office of <strong>Water</strong> Services, 2000). Available on the Internet at<br />
www.opfwab.gov.uk/pdffiles/capex2000.pdf.<br />
<strong>Water</strong> <strong>and</strong> <strong>Wastewater</strong> <strong>Export</strong> <strong>Market</strong> <strong>Plan</strong><br />
11
• A joint venture between AWG <strong>and</strong> American <strong>Water</strong><br />
Works Company to pursue the privatization of<br />
municipal wastewater services in the United States.<br />
• Ownership of several U.S. equipment <strong>and</strong> services<br />
firms, including PSC Environmental Services, by<br />
Severn Trent.<br />
• A joint venture between the Kelda Group (formerly<br />
Yorkshire <strong>Water</strong>) <strong>and</strong> Ogden.<br />
Japan<br />
Japanese water <strong>and</strong> wastewater companies tend to be<br />
highly integrated <strong>and</strong> fairly concentrated. Leading Japanese<br />
firms are technology- <strong>and</strong> equipment-oriented <strong>and</strong><br />
compete as conglomerates or trading companies in which<br />
every component required for a project is included—consulting,<br />
engineering, construction, equipment, supplies,<br />
materials, <strong>and</strong> financing.<br />
The $4.3 billion Ebara Corporation offers the most<br />
diversified portfolio of water <strong>and</strong> wastewater equipment<br />
<strong>and</strong> services, including equipment for all types of treatment<br />
processes, chemicals, sludge h<strong>and</strong>ling equipment,<br />
as well as plant design <strong>and</strong> construction, <strong>and</strong> process engineering<br />
<strong>and</strong> consulting services. Pump manufacturing<br />
is Ebara’s major business, <strong>and</strong> its manufacturing bases<br />
worldwide (Japan, Taiwan, Indonesia, Brazil, Italy, <strong>and</strong><br />
Spain) offer customers competitive prices <strong>and</strong> short delivery<br />
periods.<br />
The smaller Kurita <strong>Water</strong> Industries specializes entirely<br />
in the water market but focuses primarily on ultrapure<br />
water production for the electronics industry,<br />
membrane filtration <strong>and</strong> desalination equipment, water<br />
recycling technologies, <strong>and</strong> chemicals. Mitsubishi Heavy<br />
Industries has a large machinery <strong>and</strong> plants manufacturing<br />
business that produces, among others, package water,<br />
sewage, <strong>and</strong> industrial effluent treatment systems,<br />
pumps, <strong>and</strong> desalination plants. The Kubota Corporation<br />
is a major manufacturer of pipes for water supply <strong>and</strong><br />
sewerage systems.<br />
The Japanese government actively supports the development<br />
of business opportunities for Japanese firms by<br />
providing attractive financing along with technical assistance<br />
to promote their products.<br />
Germany<br />
German companies involved in the water <strong>and</strong> wastewater<br />
sectors are best known for their construction <strong>and</strong><br />
engineering services, although a few German firms have<br />
also been active in bidding on BOT projects. As<br />
Germany’s domestic market is limited, companies have<br />
had to look overseas to survive.<br />
12 U.S. Department of Commerce, International Trade Administration<br />
German companies are also consolidating to provide<br />
a more complete range of products <strong>and</strong> services in the<br />
international water <strong>and</strong> wastewater market. For example,<br />
RWE Group AG, a conglomerate of German utilities,<br />
offers a range of technical <strong>and</strong> financial expertise in the<br />
design, construction, <strong>and</strong> operation of waterworks.<br />
In September 2000, RWE took over Britain’s Thames<br />
<strong>Water</strong> to become one of the world’s largest water<br />
companies.<br />
Competition by Geographic Area<br />
Traditionally, U.S. companies have been most competitive<br />
in Latin America (particularly Central America),<br />
due to its geographic proximity <strong>and</strong> the fact that they are<br />
usually able to conduct their business in Spanish. However,<br />
giant French water companies have recently become<br />
very competitive, particularly in South America, due to<br />
their ability to take advantage of market opportunities<br />
created by the growing water utility privatization there.<br />
Japanese water equipment firms have also been active in<br />
South America, supported by the Japanese government’s<br />
aid programs.<br />
Although U.S. firms have a significant market share<br />
in water <strong>and</strong> wastewater equipment supplies in Europe,<br />
this share is unlikely to exp<strong>and</strong>. The pan-European integration<br />
process that has extended to Central <strong>and</strong> Eastern<br />
Europe creates advantages for European firms.<br />
In Asia, U.S. competitiveness is largely determined by<br />
the political relationships the U.S. government enjoys<br />
with individual countries <strong>and</strong> the corresponding amount<br />
of U.S. foreign aid going there. U.S. companies are most<br />
competitive in the Association of Southeast Asian Nations<br />
(ASEAN) countries: Indonesia, Malaysia, Thail<strong>and</strong>,<br />
the Philippines, <strong>and</strong> Singapore. In China <strong>and</strong> India, the<br />
United States is becoming more competitive as the bilateral<br />
political climate improves. Japanese <strong>and</strong>, to a smaller<br />
extent, French <strong>and</strong> British firms are the main competition<br />
in that part of the world.<br />
A similar situation exists in the Middle East, where<br />
the U.S. government has been pouring foreign aid into<br />
water projects in Egypt, Jordan, <strong>and</strong>, since recently, Palestine,<br />
thereby creating advantages for U.S. water <strong>and</strong><br />
wastewater equipment suppliers. The strategic partnerships<br />
between the United States <strong>and</strong> Saudi Arabia, <strong>and</strong> a<br />
number of smaller Gulf states also have a positive impact<br />
on the competitiveness of U.S. exporting firms. On<br />
the contrary, there is virtually no American business presence<br />
in “unfriendly” countries like Syria, Iraq, Libya, etc.<br />
In the Maghreb countries of North Africa (Morocco, Algeria,<br />
<strong>and</strong> Tunisia), U.S. firms’ competitiveness is impaired<br />
by the need to conduct business in French <strong>and</strong>
compete with well-connected French companies. In general,<br />
across the Middle East <strong>and</strong> North Africa, European<br />
firms, particularly French <strong>and</strong> German, are very tough<br />
competition.<br />
Finally, Africa has never been a priority region for U.S.<br />
exporters of water <strong>and</strong> wastewater technologies, partly<br />
because of the competition from the French <strong>and</strong> British<br />
firms in their former colonies, <strong>and</strong> partly because of the<br />
risky political <strong>and</strong> business climate in the region. Several<br />
U.S. firms are now trying to explore opportunities<br />
in Africa created by the international efforts to provide<br />
safe drinking water to the population.<br />
Competitiveness by <strong>Market</strong> Segment<br />
U.S. companies are major exporters of water <strong>and</strong><br />
wastewater equipment <strong>and</strong> chemicals. Overall, U.S. firms<br />
seek to compensate for the high risk of working in overseas<br />
water <strong>and</strong> wastewater markets through higher profitability<br />
of their exports. This makes industrial wastewater<br />
projects generally more attractive for them. While U.S.<br />
firms would probably not be competitive on price alone,<br />
they rely on the recognized quality of their work <strong>and</strong> their<br />
technological sophistication <strong>and</strong> reputation. Often, U.S.<br />
firms produce specialty equipment that is not available<br />
from other suppliers, which gives them a competitive<br />
edge in certain niche markets.<br />
At their October 1999 meeting, representatives of the<br />
U.S. environmental industry, non-profit organizations,<br />
<strong>and</strong> the federal government identified the following areas<br />
where U.S. water companies have substantial competitive<br />
advantage: 30<br />
• Micro-level water <strong>and</strong> wastewater treatment systems,<br />
especially decentralized packaged systems<br />
using membrane filtration, reverse osmosis, molecular<br />
sieve, <strong>and</strong> hollow fiber separation technologies;<br />
• <strong>Water</strong> <strong>and</strong> wastewater testing technologies; <strong>and</strong><br />
• Industrial process control technologies.<br />
It is difficult to estimate export volumes of specific<br />
water technologies, mainly because traditional classification<br />
methods are not yet geared specifically to environmental<br />
technologies. Therefore, some, if not most<br />
30. “Global Environmental <strong>Market</strong>s 2000,” Environmental Business<br />
Journal, vol. XII, no. 9/10, 2000.<br />
31. The Harmonized Tariff Schedule of the United States is published<br />
by the U.S. International Trade Commission based on the international<br />
Harmonized System, the global classification system that is<br />
used to describe most world trade in goods.<br />
harmonized tariff schedule (HTS) codes 31 designated<br />
as environmental items in the U.S. Department of<br />
Commerce’s September 2000 classification also include<br />
products intended for non-environmental applications.<br />
According to rough estimates based on the 1999 HTS<br />
code data for U.S. exports, biological wastewater treatment<br />
equipment is by far the largest export category for<br />
the U.S. water industry. The other principal exports include<br />
ozone generators, filters, pumps (including mixer,<br />
centrifugal, <strong>and</strong> vacuum pumps), as well as measuring<br />
<strong>and</strong> testing equipment.<br />
France, the United Kingdom, <strong>and</strong> Japan remain the<br />
major competitors in the global market for water equipment<br />
<strong>and</strong> chemicals. Germany <strong>and</strong> the United States also<br />
have a sizable market share. 32<br />
Process Equipment<br />
Process equipment includes separation, mixing, destruction,<br />
<strong>and</strong> chemical feed equipment for municipal <strong>and</strong><br />
industrial water <strong>and</strong> wastewater treatment. Overall, the<br />
market for U.S.-manufactured process equipment should<br />
continue to grow, especially if destruction technologies<br />
replace some existing separation technologies (for example,<br />
advanced oxygen technology vs. carbon adsorption).<br />
Potential export markets for process equipment are<br />
dependent upon the development of environmental regulations<br />
in importing countries; as these countries develop<br />
increasingly stringent regulations, more advanced treatment<br />
technologies <strong>and</strong> process equipment will be needed.<br />
Canada is the most lucrative foreign market for U.S.<br />
water treatment process equipment firms primarily because<br />
of its proximity to the United States <strong>and</strong> the strong<br />
ties between U.S. producers <strong>and</strong> the end-users, Canadian<br />
municipalities. Mexico is the next most lucrative market<br />
for U.S. process equipment for largely the same reasons,<br />
followed by the United Kingdom <strong>and</strong> Central <strong>and</strong> Southern<br />
Europe.<br />
U.S. companies are not seen as being highly competitive<br />
in the market for emerging process technologies (for<br />
example, membrane <strong>and</strong> advanced oxidization technology).<br />
Two Canadian companies (Trojan <strong>Technologies</strong> <strong>and</strong><br />
Zenon) dominate the North American market. Competing<br />
against these major Canadian exporters of water <strong>and</strong><br />
wastewater treatment process equipment are German,<br />
French, Japanese, <strong>and</strong> Dutch companies.<br />
Two highly successful U.S. ultraviolet industrial water<br />
treatment companies have been bought outright or<br />
have entered into joint ventures with the German giant<br />
WEDECO GmbH based in Dusseldorf. Ideal Horizons<br />
32. Ibid.<br />
<strong>Water</strong> <strong>and</strong> <strong>Wastewater</strong> <strong>Export</strong> <strong>Market</strong> <strong>Plan</strong><br />
13
(based in Poultney, Vermont) has been bought by<br />
WEDECO <strong>and</strong> is known now as WEDECO-Ideal Horizons.<br />
The firm remains prominent in the area of industrial<br />
process water UV disinfection systems, as well as<br />
residential <strong>and</strong> commercial units for home <strong>and</strong> office use<br />
in North America.<br />
Aquafine (based in Valencia, California) is competitive<br />
overseas in the area of ultraviolet water treatment<br />
equipment for pure <strong>and</strong> ultra pure applications (for example,<br />
the semiconductor <strong>and</strong> pharmaceutical industries).<br />
However, even successful companies like Aquafine are<br />
entering into multinational relationships to increase market<br />
exposure. Aquafine has recently formed a joint venture<br />
with WEDECO. The new company, Aquafine<br />
Wedeco Environmental Systems, Inc., will manufacture<br />
<strong>and</strong> sell WEDECO’s ozone generators, ultraviolet disinfection<br />
<strong>and</strong> oxidation systems, <strong>and</strong> fixed-film biological<br />
treatment equipment in North America <strong>and</strong> Mexico.<br />
Delivery Equipment<br />
<strong>Export</strong> of delivery equipment (pumps, pumping<br />
equipment, industrial valves, pipes, storage tanks, etc.)<br />
is constrained by the fact that these products are heavy<br />
<strong>and</strong> do not have high profit margins. As a result, the<br />
high cost of shipping <strong>and</strong> delivery leaves little room for<br />
profitability.<br />
Although the United States is the world’s single largest<br />
producer of water <strong>and</strong> wastewater delivery equipment,<br />
only 10 percent of all U.S. delivery equipment revenues<br />
Figure 2.1. Top Delivery Equipment Producing Countries<br />
United<br />
Kingdom<br />
United States<br />
France<br />
Japan Germany<br />
Source: “Global Environmental <strong>Market</strong>s 2000,” Environmental<br />
Business Journal, vol. 12, no. 9/10 (Sept./Oct.2000).<br />
14 U.S. Department of Commerce, International Trade Administration<br />
is from exports. The European Union produces twice the<br />
amount, in gross sales, of pumps <strong>and</strong> pumping equipment,<br />
compared to the United States. Delivery equipment<br />
industry leaders include firms in the United Kingdom,<br />
France, Germany, <strong>and</strong> Japan, with Germany being the<br />
largest producer. Most German firms in this business are<br />
medium-sized <strong>and</strong> specialize in one or two branches of<br />
the delivery equipment market.<br />
Two U.S. companies have proved to be competitive<br />
in the market for pumps: Gorman Rupp <strong>and</strong> Gould.<br />
Gorman Rupp produces pumps for the industrial, municipal,<br />
sewage, construction, <strong>and</strong> petroleum markets.<br />
Gould makes pumps for the industrial <strong>and</strong> water technology<br />
sectors. They are known for producing the world’s<br />
leading line of residential water well pumps. These two<br />
companies have positioned themselves well, <strong>and</strong> are competitive<br />
with the Swiss <strong>and</strong> German pump companies.<br />
Gorman Rupp has even managed to make inroads into<br />
the northern European markets.<br />
Many mergers, acquisitions, <strong>and</strong> consolidations have<br />
been occurring in this market segment. In France, the<br />
major integrated firms, specifically Vivendi <strong>and</strong> ONDEO,<br />
are involved in the water <strong>and</strong> wastewater delivery equipment<br />
market through subsidiaries. Many British delivery<br />
equipment producers are also mechanical engineering<br />
firms.<br />
Japan has shrunk its domestic production, so its competitiveness<br />
may have increased elsewhere. Japanese<br />
firms generally do not export or market delivery equipment<br />
exclusively, but instead rely on government technology<br />
transfer programs for developing countries. Japan<br />
is the largest distributor of water <strong>and</strong> wastewater delivery<br />
equipment in the Asia Pacific region, followed by<br />
the United States <strong>and</strong> the European Union.<br />
Chemicals<br />
Chlorine, the most prominent chemical used in water<br />
treatment, is produced virtually worldwide. Activated<br />
carbon, another large-volume product, is produced primarily<br />
in Japan, Belgium, France, Germany, Italy, the<br />
Netherl<strong>and</strong>s, <strong>and</strong> the United Kingdom (as well as the<br />
United States). To a lesser extent, activated carbon is also<br />
produced in East Asian countries. Two other common<br />
water treatment chemicals, aluminum sulfate (alum) <strong>and</strong><br />
calcium hydroxide (slaked lime) are produced throughout<br />
the world. In 1998, U.S. companies exported over<br />
8,000 tons of alum, <strong>and</strong> more than 6,800 tons of slaked<br />
lime. 33<br />
The fastest growing part of the water treatment chemical<br />
industry is specialty chemicals for advanced water<br />
33. <strong>Export</strong> Commodity Report, Oregon State University, 1994–1998.
Table 2.2. Global Specialty <strong>Water</strong> Chemicals <strong>Market</strong>, 1998 (millions of U.S. dollars)<br />
End User North America Western Europe Japan Other Total<br />
Heavy Industry 1,700 900 450 500 3,550<br />
Light Industry 700 300 150 100 1,250<br />
Commercial Sector 600 140 100 50 890<br />
Municipal Utilities 200 160 100 50 510<br />
Total 3,200 1,500 800 700 6,200<br />
Source: Environmental Business International, 1999.<br />
<strong>and</strong> wastewater treatment systems. Specialty chemicals,<br />
such as certain polymeric materials used in filtration devices,<br />
are produced mainly in the United States, Japan,<br />
<strong>and</strong> Western Europe.<br />
The total global market for specialty water management<br />
chemicals was estimated at $6.2 billion in 1998 <strong>and</strong><br />
is growing at 3.2 percent per year, with North America<br />
comprising more than half of this market, followed<br />
by Western Europe <strong>and</strong> Japan (see Table 2.2). 34 The<br />
European market is approaching saturation, while the<br />
Figure 2.2. Best Prospect <strong>Market</strong>s for Instrumentation<br />
Japan<br />
34. “The U.S. <strong>Water</strong> Industry,” Environmental Business Journal, vol.<br />
XII, no. 7/8, 1999.<br />
largest growth opportunities should arise in developing<br />
countries.<br />
The United States exports more chemicals than most<br />
other countries—20 percent of U.S. companies’ total revenues<br />
from water chemicals are generated by exports.<br />
Canada is the largest export market for the United States,<br />
followed by Japan <strong>and</strong> Mexico. Nearly 45 percent of total<br />
U.S. exports of water <strong>and</strong> wastewater treatment chemicals<br />
consist of activated carbon <strong>and</strong> ion exchange resins.<br />
Established <strong>Market</strong>s Up-<strong>and</strong>-Coming <strong>Market</strong>s<br />
Canada<br />
Germany<br />
United Kingdom<br />
France<br />
Mexico<br />
Taiwan<br />
South<br />
Korea<br />
Sources: “Global Environmental <strong>Market</strong>s 2000,” Environmental Business Journal, vol. 12, no. 9/10 (Sept./Oct. 2000); U.S. International<br />
Trade Commission, Global Competitiveness of U.S. Environmental Technology Industries: Municipal <strong>and</strong> Industrial <strong>Water</strong> <strong>and</strong> <strong>Wastewater</strong>,<br />
publication no. 2867 (Washington, D.C.: U.S. ITC, March 1995).<br />
<strong>Water</strong> <strong>and</strong> <strong>Wastewater</strong> <strong>Export</strong> <strong>Market</strong> <strong>Plan</strong><br />
15
Instrumentation<br />
The United States is the world’s largest producer of<br />
water <strong>and</strong> wastewater instrumentation. U.S. environmental<br />
instrument manufacturers generate more than a third<br />
of their revenues from water <strong>and</strong> wastewater applications.<br />
While the U.S. instrument industry is competitive in domestic<br />
<strong>and</strong> foreign markets, particularly due to high levels<br />
of investment in research <strong>and</strong> development,<br />
technological sophistication, after-sales service, <strong>and</strong> competitive<br />
pricing, it has been experiencing increased competition<br />
from foreign firms in recent years.<br />
Several U.S. instrument manufacturers have production<br />
<strong>and</strong> distribution capabilities in many industrialized<br />
countries (for example, Germany, Britain, Japan, <strong>and</strong><br />
Canada). Most water <strong>and</strong> wastewater instrumentation is<br />
produced by a large number of medium-sized <strong>and</strong> small<br />
companies. Smaller companies involved in the instrument<br />
sector typically market their instruments through independent<br />
distributors, while the larger companies generally<br />
market directly to end users.<br />
To date, the majority of U.S. instrumentation exports<br />
have gone to Canada, Japan, Germany, France, <strong>and</strong> Britain.<br />
At the same time, exports to emerging market nations,<br />
such as Mexico, South Korea, <strong>and</strong> Taiwan, have<br />
grown twice as fast in recent years as exports to OECD<br />
markets.<br />
The quality of instrument production in countries like<br />
Britain, France, Italy, Germany, <strong>and</strong> Japan is comparable<br />
to that of the United States. About 55 percent of the<br />
world’s process control instruments, analytical instruments,<br />
<strong>and</strong> on-line analyzers are produced by manufacturers<br />
in these countries, along with about 80 percent of<br />
water meters. Germany is the largest producer in the European<br />
Union, accounting for 50 percent of the production<br />
volume. 35<br />
Engineering <strong>and</strong> Construction Services<br />
U.S. engineering <strong>and</strong> construction firms are well<br />
known around the world for their expertise <strong>and</strong> quality<br />
of their work. Large design firms such as Montgomery<br />
Watson, Black <strong>and</strong> Veatch, <strong>and</strong> Earth Tech remain leaders<br />
in revenue from international water <strong>and</strong> wastewater<br />
projects. They share this distinction with NEDCO (Netherl<strong>and</strong>s)<br />
<strong>and</strong> Dar Al-H<strong>and</strong>asah (Egypt). 36 Over the past<br />
35. Global Competitiveness of U.S. Environmental Technology Industries:<br />
Municipal <strong>and</strong> Industrial <strong>Water</strong> <strong>and</strong> <strong>Wastewater</strong>, U.S. International<br />
Trade Commission, 1995.<br />
36. “The Top 200 International Design Firms,” Engineering News<br />
Record, July 17, 2000.<br />
16 U.S. Department of Commerce, International Trade Administration<br />
several years, with the downturn in the Asian <strong>and</strong> Brazilian<br />
economies, the international design market wavered<br />
<strong>and</strong> has yet to return to steady growth. The market is<br />
becoming more complex with international acquisitions<br />
<strong>and</strong> diversification into integrated service providers,<br />
meeting the design-build-turnkey needs of international<br />
clients. For example, Earth Tech, a global environmental<br />
<strong>and</strong> engineering technology company owned by Tyco<br />
International, has grown in the water market through varied<br />
acquisitions. Earth Tech’s acquisition of Brazil’s<br />
Multiservice Engineering Ltd. in 1998 opened up<br />
privatization opportunities in Latin America, the<br />
company’s primary area of focus. Similarly, the 1999<br />
purchase of the British firm Babcock <strong>Water</strong> Engineering<br />
was an essential step in Earth Tech’s business development<br />
in Western Europe.<br />
International contracting is continually plagued by risk,<br />
as confirmed by the financial troubles of Stone <strong>and</strong><br />
Webster (purchased by the Shaw Group in 2000), <strong>and</strong><br />
Germany’s Philipp Holzmann, <strong>and</strong> South Korea’s largest<br />
contractor, Hyundai Engineering <strong>and</strong> Construction.<br />
Nevertheless, the $2.5 billion of international wastewater<br />
construction activity in 1999 was led by the U.S.-based<br />
Bechtel Group, Inc., followed by Skanska AB (Sweden)<br />
<strong>and</strong> Ed. Zublin AG (Germany). The $3.2 billion international<br />
water construction activity was led by Italy’s<br />
Impreglio, SPA, followed by the Dragados Group (Spain)<br />
<strong>and</strong> Vinci (France). The future water <strong>and</strong> wastewater<br />
opportunities appear to be favorable in some Asian countries<br />
such as South Korea, Japan, <strong>and</strong> Taiwan, Eastern<br />
Europe, <strong>and</strong> the Middle East. 37<br />
Foreign firms providing engineering <strong>and</strong> construction<br />
services in the water <strong>and</strong> wastewater sectors, especially<br />
those in France, the United Kingdom, <strong>and</strong> Germany, tend<br />
to be larger <strong>and</strong> more integrated than those in the United<br />
States, <strong>and</strong> typically concentrate on these sectors. For<br />
example, Germany’s RWE Group (which has recently<br />
acquired Britain’s Thames <strong>Water</strong>) offers design <strong>and</strong> construction<br />
services for water <strong>and</strong> wastewater treatment<br />
plants but is also a supplier of water-related products <strong>and</strong><br />
other environmental services. When project specifications<br />
call primarily for engineering <strong>and</strong> construction services,<br />
U.S. companies are very competitive; however, when clients<br />
are looking for a turnkey project, integrated firms<br />
such as Vivendi, ONDEO, <strong>and</strong> RWE often have an<br />
advantage.<br />
37. “Slow Growth, High Hopes,” Engineering News Record, August<br />
14, 2000.
Chapter 3<br />
Increasing Competitiveness of the U.S. <strong>Water</strong> Industry<br />
In order to succeed in the international market for<br />
water <strong>and</strong> wastewater technologies <strong>and</strong> services, U.S.<br />
firms should be aware of the realities of doing business<br />
overseas, know <strong>and</strong> be able to take advantage of particular<br />
market characteristics, <strong>and</strong> use available information<br />
support services.<br />
A recent survey of the San Francisco Bay area’s environmental<br />
technology exporting firms 38 sought to identify<br />
critical success factors in overseas markets. In the<br />
survey, the following four themes were mentioned most<br />
frequently by the exporting companies:<br />
• Underst<strong>and</strong>ing country markets, or becoming<br />
familiar with a specific country, its culture, work<br />
habits, <strong>and</strong> language;<br />
• Building alliances <strong>and</strong> working effectively with<br />
partners in export countries;<br />
• Access to financing for export activities; <strong>and</strong><br />
• Having experienced in-house staff dedicated to<br />
exporting.<br />
This chapter presents market strategies for three of<br />
these success factors (staff dedication is a matter of internal<br />
company policies <strong>and</strong> is not considered here). It<br />
also describes other competitiveness strategies such as<br />
building joint ventures <strong>and</strong> consortia with U.S. <strong>and</strong> thirdcountry<br />
firms. It provides important hints on how to enter<br />
<strong>and</strong> compete in promising overseas markets <strong>and</strong> how<br />
to pursue international water <strong>and</strong> wastewater projects. It<br />
also refers exporters to the information resources available<br />
through a multitude of U.S. public sector service<br />
organizations.<br />
Underst<strong>and</strong>ing Local <strong>Market</strong>s<br />
The first step in a successful export market strategy is<br />
knowing where the markets are <strong>and</strong> how to access them.<br />
To a “new-to-market” company, export markets can seem<br />
daunting <strong>and</strong> inaccessible, particularly from an office in<br />
the United States. The most successful companies, be they<br />
38. “Global Environmental <strong>Market</strong>s 2000,” Environmental Business<br />
Journal, vol. XII, no. 9/10, 2000.<br />
large or small, are those that do their homework. Knowing<br />
the stage <strong>and</strong> pace of market development as well as<br />
the local business culture is critical in prioritizing business<br />
development efforts. Many companies find that to<br />
gain substantial market share, they must be the first one<br />
on the ground in the targeted country, which often involves<br />
years of education <strong>and</strong> product orientation prior<br />
to any direct sales. Because of the large amount of time<br />
<strong>and</strong> resources required for this approach, many early<br />
market opportunities are available only to the larger U.S.<br />
water <strong>and</strong> wastewater equipment manufacturers.<br />
Host Government Regulations<br />
Successful exporting requires an in-depth underst<strong>and</strong>ing<br />
of host government regulations <strong>and</strong> an underst<strong>and</strong>ing<br />
of how these regulations are implemented.<br />
Case Study 3.1. Developing <strong>Water</strong> Projects in<br />
Emerging <strong>Market</strong>s: What Does It Take to<br />
Succeed?<br />
Thierry Baudon, Managing Director of ONDEO’s<br />
International Finance Division, identified five success<br />
factors in emerging water <strong>and</strong> wastewater markets:<br />
1. Develop superior technical <strong>and</strong> customer management<br />
skills, through continuous research.<br />
2. Develop a thorough underst<strong>and</strong>ing of the local<br />
environment, including the local institutions, politics,<br />
<strong>and</strong> civilian society.<br />
3. Develop strong industrial <strong>and</strong> financial partnerships<br />
(with local business partners, international<br />
investors, <strong>and</strong> multilateral financial institutions).<br />
4. Develop innovative financial engineering capabilities<br />
<strong>and</strong> risk management techniques.<br />
5. Construct a corporate culture that rewards<br />
pioneering attitudes, strong ethics, <strong>and</strong> decentralized<br />
decision-making.<br />
Source: T. Baudon, “Developing <strong>Water</strong> Projects in Emerging<br />
<strong>Market</strong>s: What Are the Challenges <strong>and</strong> What Does It Take to<br />
Succeed?” Global Infrastructure Development: World <strong>Market</strong>s<br />
in 1999 (St<strong>and</strong>ard <strong>and</strong> Poors, 1998).<br />
<strong>Water</strong> <strong>and</strong> <strong>Wastewater</strong> <strong>Export</strong> <strong>Market</strong> <strong>Plan</strong><br />
17
Developing an underst<strong>and</strong>ing of local institutional, regulatory,<br />
<strong>and</strong> decision-making processes <strong>and</strong> frameworks,<br />
as well as establishing local political connections <strong>and</strong><br />
partnerships, are critical steps to achieving success in<br />
export markets.<br />
Most countries have business registration requirements,<br />
<strong>and</strong> tax <strong>and</strong> business issues that can be very unfamiliar<br />
to American companies. Many countries also<br />
require local incorporation. These requirements are not<br />
real barriers in most instances, but sometimes appear to<br />
be as approvals move slowly. Restrictive business practices,<br />
such as requiring local ownership of the majority<br />
of the business, are fading away in most countries, in<br />
part due to the trend of globalization.<br />
Since water <strong>and</strong> sewerage services are usually the responsibility<br />
of municipalities, there are relatively few<br />
bureaucratic hurdles for exporters to overcome. The industrial<br />
sector, on the other h<strong>and</strong>, is typically regulated<br />
at the national level through central or regional offices.<br />
Factories that have been targeted by the authorities <strong>and</strong><br />
are subject to enforcement actions often represent attractive<br />
opportunities to market industrial wastewater treatment<br />
equipment. Therefore, it is important to monitor the<br />
target country’s regulatory developments in the water<br />
sector.<br />
Local Business Culture<br />
U.S. businesses often find that local business customs<br />
<strong>and</strong> norms, as well as cultural practices, present more of<br />
a challenge to exporting than many of the bureaucratic<br />
hurdles. Establishing, maintaining, <strong>and</strong> exp<strong>and</strong>ing business<br />
overseas can be particularly frustrating because of<br />
the volume of communication required. Many companies<br />
identify a lack of underst<strong>and</strong>ing of the local culture<br />
as being a key factor in the difference between a successful<br />
<strong>and</strong> a failed business negotiation.<br />
Some of the most challenging areas for U.S. businesses<br />
are different notions of property <strong>and</strong> acceptable levels of<br />
risk, <strong>and</strong> different tax <strong>and</strong> contract laws. Local partners<br />
often do not underst<strong>and</strong> the need to address these risks,<br />
or simply want the U.S. firm to bear all the risks. Again,<br />
good communication is necessary to work out these issues<br />
with the local affiliate.<br />
U.S. companies have also long complained about the<br />
bribes <strong>and</strong> gratuities that officials in some countries expect<br />
for anything from copies of bid documents <strong>and</strong> key<br />
data, to final award of a contract. In some European countries,<br />
such payments are considered legitimate business<br />
expenses. U.S. firms typically must market on quality<br />
<strong>and</strong> price only, <strong>and</strong> cannot offer such gratuities due to<br />
the Foreign Corrupt Practices Act.<br />
18 U.S. Department of Commerce, International Trade Administration<br />
To avoid some of the problems discussed above, U.S.<br />
businesses should take advantage of the available resources<br />
to learn about the local business culture <strong>and</strong> to<br />
recruit the help of a local business advocate. For more<br />
details, see Appendix D.<br />
<strong>Market</strong> Intelligence Information<br />
A successful export market strategy relies on good information<br />
about the target overseas market conditions,<br />
competitors, business culture, <strong>and</strong> specific needs <strong>and</strong><br />
opportunities. The importance of developing an export<br />
strategy cannot be overstressed. Many small <strong>and</strong> medium-sized<br />
businesses, however, lack the resources or<br />
expertise to export on their own. In addition, many<br />
smaller companies find it difficult to develop an export<br />
strategy. The case study below illustrates the difficulties<br />
in exporting without a comprehensive, well-designed<br />
overseas marketing strategy.<br />
Case Study 3.2. Pipe Repair Manufacturer<br />
<strong>Export</strong> Activities Limited by a Lack of Strategy<br />
An American-owned <strong>and</strong> Texas-based company manufactures<br />
fittings <strong>and</strong> fabrications for the repair, connection,<br />
<strong>and</strong> branching/tapping of all types <strong>and</strong> sizes of pipes.<br />
Their products are used for water, wastewater, industrial,<br />
<strong>and</strong> manufacturing piping, as well as for irrigation <strong>and</strong><br />
natural gas pipelines. Currently, the company has 160<br />
employees <strong>and</strong> 2 to 3 percent of its business is international.<br />
The company’s limited successes exporting repair<br />
products have been in the border regions of Mexico,<br />
Panama, <strong>and</strong> the Caribbean.<br />
The company began exporting approximately five<br />
years ago when Mexican clients heard about it from colleagues<br />
in the Caribbean. Since then, however, it has not<br />
developed an export strategy to solidify <strong>and</strong> exp<strong>and</strong> its<br />
international presence.<br />
The company relies on contacts made at national <strong>and</strong><br />
international expositions to find leads <strong>and</strong> often waits for<br />
those who have expressed interest to call. In addition, it<br />
does not have a formalized process for finding local affiliates.<br />
The company has tried using a sales representative,<br />
but the mixed results have made it disinclined to<br />
rely as heavily on this approach. All of this suggests a<br />
poorly formed export strategy.<br />
The company wants to use its existing base to<br />
strengthen its presence in Central America, but is likely<br />
to continue to face substantial obstacles until it develops<br />
a strong marketing strategy.<br />
Source: Primary interview with company staff.
Gathering information on the market can be done with<br />
limited travel <strong>and</strong> expense by using e-mail, the Internet,<br />
a telephone, <strong>and</strong> a fax machine. U.S. government assistance<br />
programs provide several types of information that<br />
can be useful for U.S. companies seeking market intelligence,<br />
including:<br />
• <strong>Market</strong> reports (produced by the Department of<br />
Commerce <strong>and</strong> USAID), as well as Country Commercial<br />
Guides published by the Departments of<br />
State <strong>and</strong> Commerce for many countries (see Appendix<br />
D for more information); <strong>and</strong><br />
• Information from in-country U.S. Commercial<br />
Service Representatives <strong>and</strong>/or Technology Representatives<br />
supported under USAID’s U.S.-Asia<br />
Environmental Partnership (US-AEP) <strong>and</strong> Ecolinks<br />
initiatives (see Appendix B for more details).<br />
Other sources that can provide market intelligence information<br />
include the World Trade Centers Association,<br />
an association consisting of over three hundred trade centers<br />
worldwide, international accounting firms, as well<br />
as many consulting firms. For some companies, having<br />
access to proprietary information that gives them the edge<br />
over competitors is a worthwhile marketing investment,<br />
despite the steep costs. A company can utilize these resources<br />
to begin to identify <strong>and</strong> prioritize country markets<br />
for particular products or services. At the same time,<br />
firms can learn which U.S. <strong>and</strong> foreign companies are<br />
active in the country <strong>and</strong> evaluate their competitiveness.<br />
Companies can also take advantage of trade promotion<br />
opportunities, including catalogue shows, trade missions,<br />
agent distributor searches, <strong>and</strong> the U.S. Department<br />
of Commerce’s Gold Key Program, which help U.S. firms<br />
access overseas markets.<br />
Positioning to Enter the <strong>Market</strong><br />
When positioning themselves to enter foreign markets,<br />
companies must consider the differences in legal, political,<br />
<strong>and</strong> social environments between home <strong>and</strong> host<br />
countries. Developing an underst<strong>and</strong>ing of a foreign<br />
country’s business climate <strong>and</strong> customs is often greatly<br />
assisted by developing local relationships.<br />
<strong>Export</strong>ing firms can use two principal strategies in order<br />
to increase their competitiveness or establish a local<br />
presence:<br />
• Establishing local representation <strong>and</strong> partnerships,<br />
<strong>and</strong><br />
• Engaging in joint exporting activities (through joint<br />
ventures or consortia) with other U.S. firms.<br />
The case study of Komline-S<strong>and</strong>erson (see Case Study<br />
3.3) is an example of a medium-sized company that has<br />
effectively positioned itself overseas by remaining flexible,<br />
seizing opportunities when they arise, <strong>and</strong> developing<br />
strong relationships with its foreign colleagues.<br />
Case Study 3.3. Komline-S<strong>and</strong>erson: Small<br />
Company Effectively Develops New <strong>Export</strong><br />
Opportunities<br />
Komline-S<strong>and</strong>erson of Peapack, New Jersey, is a medium-sized<br />
business that makes water quality instruments,<br />
primarily for liquid/solid separation. It has been<br />
working to develop overseas opportunities for its products.<br />
Currently, 10 to 15 percent of the company’s business<br />
is with foreign industrial <strong>and</strong> municipal clients.<br />
Komline-S<strong>and</strong>erson has found its small size to be both<br />
a detriment <strong>and</strong> a benefit when exporting overseas. As<br />
Jabez Van Cleef, director of communications, stated in<br />
the Environmental Business Journal, “our size constrains<br />
us from building an extensive service <strong>and</strong> information<br />
infrastructure overseas, but it permits us to respond<br />
quickly if a market opportunity presents itself.” 39<br />
Komline’s flexibility has made it possible for it to get<br />
a foothold in new markets. The company has been content<br />
to sell different products to different markets <strong>and</strong> to<br />
use these footholds as a “springboard” into neighboring<br />
<strong>and</strong> other product markets. For example, it is currently<br />
selling industrial process <strong>and</strong> filter technology in Mexico,<br />
machinery for sludge concentration in municipal wastewater<br />
treatment in the United Kingdom, <strong>and</strong> filters for<br />
corn-syrup processing in China. Now the company’s associates<br />
in China <strong>and</strong> Mexico are actively working to<br />
develop the municipal wastewater side of the business.<br />
Driven by the idea that building a relationship of trust<br />
is key to successful exporting, the company’s marketing<br />
strategy has benefited from the company’s small size.<br />
Also, unlike the competition, Komline is unwilling to<br />
“oversell” its products <strong>and</strong> prefers instead to be forthright<br />
about such things as product lifetime. This honesty<br />
<strong>and</strong> the relationship of trust KS develops with its clients<br />
will further assist the company’s export efforts.<br />
For further information, visit the Komline-S<strong>and</strong>erson<br />
Web site at www.komline.com.<br />
39. “<strong>Wastewater</strong> Instrument Firm Sees Opportunity Abroad,” Global<br />
Environmental <strong>Market</strong>s 2000, Environmental Business Journal, vol.<br />
XII, no. 9/10, 2000.<br />
<strong>Water</strong> <strong>and</strong> <strong>Wastewater</strong> <strong>Export</strong> <strong>Market</strong> <strong>Plan</strong><br />
19
Building Local Relationships <strong>and</strong> Establishing a<br />
Local Presence<br />
Local partnerships <strong>and</strong> representation not only provide<br />
U.S. firms with the advantage of learning about opportunities<br />
before their competitors, but also provide a source<br />
of inside information on local business culture. Establishing<br />
a presence in a country requires both time <strong>and</strong><br />
investment of human <strong>and</strong> financial resources. Some type<br />
of “foreign presence” accounts for approximately 95 percent<br />
of foreign sales of water treatment <strong>and</strong> infrastructure<br />
equipment <strong>and</strong> systems. 40<br />
Methods for establishing local presence range from<br />
hiring a local consultant or agent to represent the firm,<br />
to setting up a local office. Perhaps the most common<br />
arrangement is to establish a relationship with a local<br />
business that has both a good reputation <strong>and</strong> solid industry<br />
contacts. This company can then effectively market<br />
<strong>and</strong> distribute the American company’s product for a percentage<br />
of the profit.<br />
In exploring the options for local representation, the<br />
firm must determine which option is the most viable given<br />
its financial <strong>and</strong> human resource limitations. U.S. companies<br />
should also be familiar with the host country’s<br />
rules <strong>and</strong> regulations concerning the establishment of local<br />
offices <strong>and</strong> partnerships with local organizations.<br />
Valuable information can be found in the U.S. Department<br />
of State’s Country Commercial Guides.<br />
There are several ways U.S. companies may establish<br />
a local presence in a developing country market:<br />
• Agents. U.S. equipment manufacturers may establish<br />
relationships with agents to import <strong>and</strong> sell<br />
their products in the local market. There are a<br />
number of U.S. government programs (see<br />
Appendix D) that assist exporters in finding local<br />
agents <strong>and</strong> distributors.<br />
• Local Office. Establishing a local office helps<br />
companies respond faster to sales opportunities. In<br />
equipment sales, a local branch can provide comprehensive<br />
service from the customized design <strong>and</strong><br />
installation of a technology to technical support <strong>and</strong><br />
after-sale maintenance. For a long-term commitment<br />
to a region or a country, a local subsidiary may lead<br />
to the best results. This strategy is generally also<br />
most effective for bidding on large infrastructure or<br />
technical assistance projects sponsored by USAID,<br />
the World Bank, <strong>and</strong> other donors whose tenders are<br />
open for U.S. companies.<br />
40. Competitive Analysis of U.S. Environmental <strong>Export</strong>s <strong>and</strong> Global<br />
<strong>Market</strong> Update, Environmental Business International, 1995.<br />
20 U.S. Department of Commerce, International Trade Administration<br />
• Joint Venture. U.S. companies may want to establish<br />
a joint venture or partnership with a local firm.<br />
Local firms bring critical familiarity with the incountry<br />
regulatory environment <strong>and</strong> exclusive<br />
technical knowledge important in adapting U.S.<br />
technologies <strong>and</strong> engineering to local conditions. In<br />
some countries, regulations require a link with a<br />
local firm, or even call for foreign companies to<br />
limit their participation to minority status. Local<br />
firms tend to provide cost-effective resources,<br />
allowing U.S. companies to be more competitive.<br />
This also allows access to projects that are bid in the<br />
country itself. Knowing the local partner <strong>and</strong> his/her<br />
credibility is critical to successful partnerships <strong>and</strong><br />
projects. Another critical factor is that of commitment,<br />
or a willingness to participate, on the part of<br />
the local partner. It is recommended that a firm<br />
conduct due diligence on its prospective partners, for<br />
it is much easier to form a partnership than it is to<br />
dissolve one. The costs of breaking ties with a local<br />
firm can cost a U.S. company its reputation in the<br />
local market.<br />
• Partnership with a Third-Country Firm. U.S.<br />
firms may choose to enter a country market through<br />
a partnership with a third-country firm that has<br />
strong local representation. For example, teaming<br />
with Indian firms can help U.S. companies gain<br />
access to other Asian markets. Teaming with European<br />
or Japanese firms that already have a substantial<br />
market share in the country may also prove<br />
beneficial.<br />
The Hach Company has successfully built an export<br />
business that relies on close relationships with distributors<br />
abroad. Their case is presented below.<br />
Joint <strong>Export</strong>ing Partnerships<br />
Before entering an overseas market, U.S. firms must<br />
decide whether they are able to enter that market <strong>and</strong><br />
whether it is worthwhile to do so—in terms of ability to<br />
compete <strong>and</strong> resource availability. By exporting in partnership<br />
with each other, U.S. firms can increase their<br />
competitiveness <strong>and</strong> each firm can benefit from lower<br />
individual export costs <strong>and</strong> increase its efficiency in every<br />
phase of exporting. Multinational companies can be<br />
important partners for small <strong>and</strong> medium-sized environmental<br />
firms seeking to supply goods <strong>and</strong> services to large<br />
donor-financed projects but unable to bid on such projects<br />
directly. Small <strong>and</strong> medium-sized enterprises can often<br />
provide niche services that will serve as an asset to a<br />
larger firm <strong>and</strong> increase the likelihood of overall success.<br />
Firms of all sizes <strong>and</strong> levels of international business ex-
Case Study 3.4. Building a Network of Top-Notch Local Distributors: The Hach Company<br />
“The advantages of entering into distributor <strong>and</strong> dealer<br />
relationships far outweigh the costs,” says Paul Goltz, director<br />
of international sales <strong>and</strong> marketing, The Hach<br />
Company.<br />
The Hach Company of Lovel<strong>and</strong>, Colorado, is an internationally<br />
recognized manufacturer <strong>and</strong> distributor of<br />
analytical instruments <strong>and</strong> reagents used to test the quality<br />
of water <strong>and</strong> other aqueous solutions. The company<br />
employs almost 1,000 people in the United States <strong>and</strong> has<br />
been selling its products overseas since the 1950s. Hach<br />
has built a professional distributor network in over 100<br />
countries; most dealers <strong>and</strong> sales representatives have well<br />
over 10 years of service working with the Hach Company<br />
<strong>and</strong> building markets for its products.<br />
The Hach Company believes that strong local relationships<br />
are key to export success. Local affiliates fulfill such<br />
critical functions as negotiating new <strong>and</strong> sometimes frustrating<br />
business climates, arranging payment, <strong>and</strong> addressing<br />
tariffs <strong>and</strong> other barriers.<br />
The Hach Company has established a formal process<br />
for selecting <strong>and</strong> training local distributors, but it also believes<br />
that the enthusiasm <strong>and</strong> capability of the selected<br />
local affiliate is critical. Hach representatives look for key<br />
characteristics such as honesty, motivation, <strong>and</strong> a strong<br />
commitment to growth.<br />
Hach identifies dealer prospects through the Agency/<br />
Distributor Service <strong>and</strong> the “Gold Key Service” of the<br />
Rocky Mountain U.S. <strong>Export</strong> Assistance Center <strong>and</strong> by<br />
making solid contacts at the U.S. Department of<br />
Commerce’s trade <strong>and</strong> catalogue shows. Other prospective<br />
dealers have been located through responses generated<br />
from their ongoing, multilingual promotional efforts<br />
<strong>and</strong> through overseas Technical Sales Seminars.<br />
perience can use joint exporting to reduce per unit export<br />
costs <strong>and</strong> develop proactive export strategies which<br />
may not be feasible for individual exporters.<br />
The ability to reduce export costs <strong>and</strong> risks is especially<br />
important when considering entry into a new or<br />
complex export market. While specific benefits will vary<br />
with the nature of the product <strong>and</strong> the targeted foreign<br />
markets, joint venture partners may enjoy the following<br />
advantages as a result of their alliance:<br />
• <strong>Market</strong> research. U.S. firms can cooperate to share<br />
the costs of foreign market research (including<br />
hiring expertise), travel, <strong>and</strong> overseas activities.<br />
Overseas dealers are required to become experts on all<br />
facets of the Hach product line. As a result, the company<br />
has established an exhaustive process for training its distributors.<br />
Distributors are encouraged to visit the headquarters<br />
<strong>and</strong> the Hach Technical Training Center for<br />
h<strong>and</strong>s-on training. In addition, they are required to attend<br />
factory-sponsored instrument repair courses presented in<br />
the United States <strong>and</strong> abroad. Since 1996, Hach has held<br />
technical sessions for its distributors in Australia, South<br />
Asia, Southern Africa, the Pacific Rim countries, the Caribbean,<br />
<strong>and</strong> Latin America.<br />
Recently, the Hach Company exp<strong>and</strong>ed its Central<br />
Asian presence into Kazakhstan. The business climate <strong>and</strong><br />
language in this former Soviet economy pose a challenge<br />
to American companies. Finding a good local distributor<br />
is critical to its success in this market. Hach’s approach<br />
was to send staff to the country to identify <strong>and</strong> build a<br />
relationship with a new distributor or sales representative.<br />
After a number of years of work, Hach identified a promising<br />
distributor c<strong>and</strong>idate. Hach staff sent used equipment<br />
to Kazakhstan so that the distributor <strong>and</strong> its customers<br />
could see <strong>and</strong> feel the products. Now, Hach has applied<br />
for U.S. Commerce Department funds to bring its Central<br />
Asian distributors to the United States for training. Growth<br />
has been slow in the new market, but the company is already<br />
beating internal projections. This is in large part due<br />
to the fact that its distributor demonstrates the real enthusiasm<br />
<strong>and</strong> excitement that Hach requires of its affiliates.<br />
For more information, contact Paul Goltz, director of<br />
international sales <strong>and</strong> marketing at (800) 227-4224 or the<br />
Web site at www.hach.com.<br />
Source: Primary interview with Paul Goltz.<br />
• <strong>Market</strong> development. U.S. firms can reduce the<br />
costs of market development activities (for example,<br />
overseas trade shows <strong>and</strong> missions) through joint<br />
activities. Firms with complementary products can<br />
offer more attractive “full line” packages to prospective<br />
buyers. Cost reductions can also be achieved by<br />
jointly conducting generic advertising intended to<br />
cultivate or increase dem<strong>and</strong> for U.S. products <strong>and</strong><br />
services.<br />
• Joint bidding. U.S. firms can increase sales <strong>and</strong><br />
profits through joint bidding. As a consortium, the<br />
companies can bid on projects that go beyond the<br />
capacity of the individual member firms.<br />
<strong>Water</strong> <strong>and</strong> <strong>Wastewater</strong> <strong>Export</strong> <strong>Market</strong> <strong>Plan</strong><br />
21
• Joint selling arrangements. The partners can have<br />
joint selling arrangements – use the same overseas<br />
representative, agree to sell separate products as a<br />
unit, prepare joint catalogs, <strong>and</strong> allocate among<br />
participating partners the sales which result from<br />
joint bidding or selling arrangements.<br />
• Combined sales support. Joint exporting partners<br />
may engage in a variety of activities that will<br />
promote or support their combined export sales.<br />
These activities might include establishing shared<br />
warranty service <strong>and</strong> training centers, conducting<br />
joint trade shows or missions, <strong>and</strong> joint advertising.<br />
In addition, the pooling of credit information may<br />
open up new avenues for export financing.<br />
Joint export ventures undertaken by domestic competitors<br />
might raise questions under U.S. antitrust laws. Fortunately,<br />
any company may apply to the Department of<br />
Commerce for an <strong>Export</strong> Trade Certificate of Review.<br />
The certificate provides exporters with antitrust protection<br />
with regard to all export activities specified in the<br />
certificate.<br />
Funding <strong>and</strong> Financing Options<br />
This section identifies funding <strong>and</strong> financing sources<br />
for exports of U.S. water <strong>and</strong> wastewater technologies<br />
<strong>and</strong> services. Development assistance is a primary driver<br />
in the water <strong>and</strong> wastewater sectors of emerging market<br />
countries. Multilateral development agencies strongly<br />
support, through technical <strong>and</strong> financial assistance, water<br />
supply infrastructure, wastewater treatment systems,<br />
<strong>and</strong> watershed clean-up projects, representing significant<br />
market opportunities. This section also considers U.S.<br />
investment <strong>and</strong> export credit programs that are particularly<br />
relevant to U.S. technology <strong>and</strong> services companies,<br />
as well as other funding <strong>and</strong> financing sources.<br />
Multilateral <strong>and</strong> Bilateral Projects<br />
Bilateral <strong>and</strong> multilateral development agencies provide<br />
the bulk of funding <strong>and</strong> financing for environmental<br />
<strong>and</strong> infrastructure projects in developing countries<br />
(Appendix A contains a summary of ongoing multilateral<br />
<strong>and</strong> bilateral water-related projects). Among the various<br />
types of market opportunities that arise from bilateral<br />
<strong>and</strong> multilateral funding sources, the two primary opportunities<br />
are equipment sales <strong>and</strong> technical assistance. To<br />
reduce the risk for U.S. companies providing goods <strong>and</strong><br />
services, payments are typically made in foreign exchange<br />
(often U.S. dollars), which makes donor-supported<br />
projects particularly attractive to U.S. firms.<br />
22 U.S. Department of Commerce, International Trade Administration<br />
Project funds are used to procure the goods, equipment,<br />
contract works, <strong>and</strong> consultant services needed to design<br />
<strong>and</strong> implement these projects, either directly from<br />
the funding agency or through loans to the host country<br />
government.<br />
Multilateral Development Banks<br />
The multilateral development banks that are central<br />
to many U.S. companies’ export market strategies include<br />
the World Bank, the Asian Development Bank (ADB),<br />
the Inter-American Development Bank (IDB), <strong>and</strong>, to a<br />
lesser extent, the North American Development Bank<br />
(NADBank), the European Bank for Reconstruction <strong>and</strong><br />
Development (EBRD), <strong>and</strong> the African Development<br />
Bank (AfDB). The World Bank also manages the Global<br />
Environment Facility (GEF), which has emerged as a<br />
key funding source for international waters protection<br />
programs.<br />
An overview of the key multilateral <strong>and</strong> bilateral development<br />
banks is provided below (contact information<br />
for these institutions is listed in Appendix B). Information<br />
can be gathered by contacting each individual<br />
agency.<br />
The World Bank Group. The World Bank Group is the<br />
largest source of international development financing <strong>and</strong><br />
includes the International Bank for Reconstruction <strong>and</strong><br />
Development (IBRD), the International Development<br />
Agency (IDA), the Multilateral Investment Guarantee<br />
Agency (MIGA), <strong>and</strong> the International Finance Corporation<br />
(IFC). The borrower, not the bank, is always responsible<br />
for procurement. The Bank provides financing<br />
from its loans for the contracts, but the contract itself is<br />
between the borrower <strong>and</strong> the supplier or contractor. The<br />
Bank’s role is to make sure that the borrower’s work is<br />
done properly, that the agreed procurement procedures<br />
(for example, international competitive bidding) are observed,<br />
<strong>and</strong> that the entire process is conducted with efficiency,<br />
fairness, transparency, <strong>and</strong> impartiality.<br />
Suppliers, contractors, <strong>and</strong> consultants can learn more<br />
about this process by attending a Monthly Business Briefing<br />
at World Bank headquarters in Washington, D.C., or<br />
reading the Guide to International Business Opportunities.<br />
The briefings explore strategies for keeping informed<br />
about projects <strong>and</strong> methods for pursuing foreign investment<br />
opportunities. The bank issues numerous publications,<br />
including Environment Matters, which summarizes<br />
its environmental operations. The World Bank’s environmental<br />
projects are summarized in its published portfolio,<br />
Facing the Global Challenge: A Progress Report on<br />
the World Bank Global Environment Operations.
To assess the qualifications of firms <strong>and</strong> to assist borrowers<br />
in establishing a short list, the bank maintains a<br />
computerized roster of consulting firms interested in doing<br />
business on bank-financed projects, called the Data<br />
on Consulting Firms (DACON) system. (There is no<br />
similar registration system for manufacturers <strong>and</strong> other<br />
suppliers of goods or contractors for works.)<br />
The United Nations publishes a biweekly digest called<br />
Development Business which is available by subscription.<br />
Development Business carries information on business<br />
opportunities generated through the World Bank,<br />
regional development banks, <strong>and</strong> other development<br />
agencies. Development Business is also available by<br />
online subscription. More information may be obtained<br />
by contacting the World Bank’s Development Business<br />
Liaison Office (http//www.devbusiness.com).<br />
Global Environment Facility (GEF). Projects funded<br />
by the GEF are implemented by the World Bank, the<br />
United Nations Development Program (UNDP), <strong>and</strong> the<br />
United Nations Environment Program (UNEP). GEF<br />
projects to reverse the degradation of international waters<br />
help realize the objectives of various regional <strong>and</strong><br />
international water agreements. The three categories of<br />
water projects are: water bodies; integrated l<strong>and</strong> <strong>and</strong> water<br />
projects; <strong>and</strong> contaminants. From 1991 to 1999, GEF<br />
allocated nearly $360 million to international waters<br />
initiatives.<br />
Inter-American Development Bank (IDB). The IDB<br />
provides capital for different types of infrastructure<br />
projects in 26 Latin American <strong>and</strong> Caribbean nations. The<br />
Bank uses funds to sponsor the development of its<br />
member countries by supplementing private investment<br />
when private capital is inaccessible. Technical<br />
assistance for the preparation, financing, <strong>and</strong> implementation<br />
of development plans <strong>and</strong> projects is also provided<br />
by the IDB. Individuals, firms, <strong>and</strong> organizations that<br />
want to learn how to bid on contracts to provide goods<br />
<strong>and</strong> services for projects financed by the IDB should attend<br />
its business seminars. The topics covered in the seminars<br />
will help participants develop or exp<strong>and</strong> their<br />
participation as suppliers of goods <strong>and</strong> services in the<br />
wide variety of sectors financed by the Bank. These seminars<br />
are highly recommended for equipment manufacturers,<br />
goods suppliers, work <strong>and</strong> construction<br />
contractors, independent consultants, <strong>and</strong> consultants<br />
from universities, think tanks, <strong>and</strong> non-governmental organizations<br />
(NGOs). The IDB publishes the IDB Project<br />
Magazine.<br />
Asian Development Bank (ADB). The ADB provides<br />
assistance to 33 developing countries in the Asia-Pacific<br />
region, including China, India, <strong>and</strong> the Philippines. The<br />
Bank makes loans <strong>and</strong> equity investments, <strong>and</strong> provides<br />
technical assistance for the preparation <strong>and</strong> execution of<br />
development projects <strong>and</strong> programs. The ADB holds<br />
Business Opportunities Seminars in different member<br />
countries throughout the year (the ADB’s North American<br />
office is located in Washington, D.C.). The ADB also<br />
publishes the ADB Business Opportunities on a monthly<br />
basis. The online edition of the ADB Business Opportunities<br />
can be found on the ADB website <strong>and</strong> is updated<br />
weekly.<br />
African Development Bank (AfDB). The AfDB primarily<br />
assists the governments or government-owned corporations<br />
in member African countries. To better direct<br />
financial assistance to environmental sectors, the bank<br />
has prepared country environmental profiles. The AfDB’s<br />
operational program has four main priorities: elimination<br />
of poverty, reconstruction <strong>and</strong> rehabilitation, development<br />
of the private sector, <strong>and</strong> increasing trade <strong>and</strong> economic<br />
integration. The AfDB is also involved in various other<br />
sectors, ranging from infrastructure to the economy, including<br />
the environment, health care, <strong>and</strong> demography.<br />
European Bank for Reconstruction <strong>and</strong> Development<br />
(EBRD). The EBRD, based in London, assists countries<br />
of Central <strong>and</strong> Eastern Europe <strong>and</strong> the former Soviet<br />
Union. The financial assistance provided by the EBRD<br />
is directed at restructuring <strong>and</strong> privatizing industries or<br />
financing infrastructure in support of these two aims. By<br />
m<strong>and</strong>ate, at least 60 percent of EBRD financing must be<br />
for private sector operations.<br />
North American Development Bank (NADBank). This<br />
bilateral institution, agreed to by the United States <strong>and</strong><br />
Mexico in connection with the North American Free<br />
Trade Agreement (NAFTA), assists U.S. <strong>and</strong> Mexican<br />
border states in addressing environmental problems.<br />
NADBank is providing financial assistance for water <strong>and</strong><br />
wastewater treatment projects along the U.S.-Mexican<br />
border.<br />
To participate successfully in multilateral donor-assisted<br />
projects, companies must underst<strong>and</strong> the donor’s<br />
project cycles <strong>and</strong> bidding procedures. Companies can<br />
identify <strong>and</strong> track project opportunities by subscribing<br />
to a donor agency’s project notices publication. The typical<br />
stages of a project cycle are identification, preparation,<br />
appraisal, <strong>and</strong> implementation. The cycle can last<br />
as long as several years. During this long lead time, companies<br />
should familiarize themselves with relevant host<br />
country institutions <strong>and</strong> market conditions.<br />
Although companies may contact donor agencies <strong>and</strong>/<br />
or relevant recipient country agencies at any stage of the<br />
<strong>Water</strong> <strong>and</strong> <strong>Wastewater</strong> <strong>Export</strong> <strong>Market</strong> <strong>Plan</strong><br />
23
project preparation, early involvement is often critical.<br />
For example, feasibility studies sometimes conducted in<br />
the early phases of the project usually contain valuable<br />
technical <strong>and</strong> contact information. It is also advisable to<br />
start forming alliances with local counterparts at the early<br />
stages of project development.<br />
United States Agency for International Development<br />
(USAID). USAID is the main U.S. bilateral donor<br />
agency. It offers economic development <strong>and</strong> humanitarian<br />
assistance (in the form of grants) to advance U.S. economic<br />
<strong>and</strong> political interests overseas. U.S. foreign aid<br />
also creates markets abroad for U.S. goods <strong>and</strong> services<br />
by offering a competitive advantage to U.S. suppliers<br />
(procuring from U.S. suppliers is m<strong>and</strong>ated by USAID).<br />
Case Study 3.5. Tied Aid Restricts the <strong>Export</strong><br />
Activities of Aqua-Aerobic Systems, Inc.<br />
Aqua-Aerobic Systems, Inc., of Rockford, Illinois, is a<br />
leading manufacturer of wastewater treatment products<br />
<strong>and</strong> systems for industrial <strong>and</strong> municipal applications.<br />
The company has over 100 sales representatives globally,<br />
<strong>and</strong> approximately 130 employees in Rockford.<br />
Aqua-Aerobic Systems has had notable successes in<br />
the developing world where municipal wastewater<br />
projects received USAID <strong>and</strong> multilateral development<br />
bank funds. Still, it estimates that its market opportunities<br />
in this area have been limited by as much as 50 percent<br />
due to the phenomenon of tied aid, according to<br />
Sharon DeDoncker, the company’s vice president of international<br />
sales.<br />
Shortly before the Asian financial crisis erupted in<br />
1997, the German government provided bilateral aid for<br />
a large municipal wastewater project in Indonesia. Aqua-<br />
Aerobic had the necessary vendor qualifications <strong>and</strong><br />
worked hard to meet the source requirements of the German<br />
aid. Its efforts at developing vendor relationships<br />
in Germany were not successful, <strong>and</strong> it ended up losing<br />
the project to a German company.<br />
Aqua-Aerobic is writing letters to members of Congress<br />
regarding its tied aid concerns. In addition, the company<br />
continues to work to develop foreign partnerships<br />
that will open up bilaterally-funded projects to it.<br />
For further information, contact Peter Bugg, International<br />
Sales Department, at (815) 654-2501 or visit the<br />
company’s Internet site at www.aqua-aerobic.com.<br />
Source: Primary interview with Sharon DeDoncker.<br />
24 U.S. Department of Commerce, International Trade Administration<br />
USAID promotes environmental improvements in host<br />
countries by providing technical demonstrations designed<br />
to help industries recognize the need for <strong>and</strong> benefits of<br />
cleaner production <strong>and</strong> cleaner technology. The agency<br />
also provides policy <strong>and</strong> institutional support to aid host<br />
country governments in developing environmental<br />
management <strong>and</strong> pollution prevention policies <strong>and</strong><br />
regulations.<br />
USAID projects are usually bid out of in-country<br />
USAID missions <strong>and</strong> are announced in the Commerce<br />
Business Daily. Contracts are typically one to five years<br />
in duration, with value between $1 million <strong>and</strong> $100 million.<br />
Consortia of several companies, usually consulting<br />
<strong>and</strong> engineering firms, have greater chances for success<br />
in bidding for USAID projects than individual companies.<br />
Companies with local offices that are known to<br />
USAID missions find themselves in an advantageous<br />
position compared to firms unfamiliar to USAID.<br />
Tied Aid Issues<br />
“Tied aid” is government-to-government assistance—<br />
including loans, grants, or concessional (subsidized) financing—that<br />
is tied to, or conditioned on, the purchase<br />
of goods or services from the donor country <strong>and</strong>/or a restricted<br />
number of countries. Many industrialized countries<br />
(Japan, France, Germany, etc.) use tied aid as a<br />
subsidy program to facilitate market entry <strong>and</strong> expansion<br />
for their private companies, making such funding unavailable<br />
to U.S. companies.<br />
Executives of U.S. environmental exporting companies<br />
complain that many foreign governments are spending<br />
far more on the promotion of exports of their national<br />
companies to developing countries, placing U.S. firms<br />
at a distinct disadvantage in the global market. 41 The case<br />
study presented below illustrates this issue.<br />
The U.S. policy with respect to tied aid has been to<br />
avoid an expensive export subsidy race <strong>and</strong> to negotiate<br />
with other OECD countries to minimize the use of tradedistorting<br />
tied aid. Successive rounds of multilateral negotiations<br />
led by the Treasury Department <strong>and</strong> the U.S.<br />
<strong>Export</strong>-Import Bank (Ex-Im Bank) produced the Helsinki<br />
Package, an agreement that went into effect in 1992 <strong>and</strong><br />
established rules prohibiting tied aid for projects that are<br />
commercially viable—that is, capable of generating cash<br />
flows sufficient to repay st<strong>and</strong>ard commercial loans.<br />
41. David R. Berg, Meeting the Challenge: U.S. Industry Faces the<br />
21st Century: The U.S. Environmental Industry (Washington, D.C.:<br />
U.S. Department of Commerce, Office of Technology Policy, 1998).
While the Helsinki Package agreement has largely<br />
eliminated tied aid for commercially viable projects, the<br />
U.S. Ex-Im Bank has also created the Tied Aid Capital<br />
Projects Fund to match other countries’ tied aid offers<br />
for certain key projects in order to counter <strong>and</strong> preempt<br />
foreign donor governments’ efforts to use aid to gain longterm<br />
commercial advantages for their exporters. 42<br />
Relevant U.S. Government Investment <strong>and</strong> <strong>Export</strong><br />
Credit Programs<br />
USAID Development Credit Authority. The Development<br />
Credit Authority (DCA) is a general authority that<br />
permits USAID to offer credit assistance for any development<br />
purpose of the U.S. Foreign Assistance Act. The<br />
DCA is intended to serve as an alternative funding vehicle<br />
to assist USAID missions in meeting their specific<br />
strategic objectives. DCA is intended for countries <strong>and</strong><br />
regions where USAID has an active presence. Global climate<br />
change activities are the key sector for which<br />
USAID intends to use DCA.<br />
The credit assistance is in the form of direct loans <strong>and</strong><br />
loan guarantees. Loan terms are related to the needs of<br />
each project but will not exceed 20 years. Loan guarantees<br />
are used only where lenders engage in true risk sharing<br />
with USAID <strong>and</strong> will cover no more than 50 percent<br />
of the lender’s risk of loss. For projects to be eligible,<br />
they must have positive financial rates of return so that<br />
the loans can be repaid. Loan amounts are in the range<br />
of $2 million to $20 million, depending on the project.<br />
The maximum loan amount is $100 million. These loans<br />
<strong>and</strong> loan guarantees can have a substantial effect on water<br />
<strong>and</strong> wastewater investment projects, as evidenced by<br />
the Aqua-Chem case study presented below.<br />
<strong>Export</strong>-Import Bank of the United States (Ex-Im<br />
Bank). The U.S. <strong>Export</strong>-Import Bank is an agency of the<br />
U.S. government that provides export credit support either<br />
to U.S. exporters on a short-term basis or to foreign<br />
purchasers on a longer term basis (2-10 years). Through<br />
loan guarantees <strong>and</strong> insurance, the agency fosters exports<br />
by making working capital available to U.S. exporters.<br />
Alternatively, through similar mechanisms plus the extension<br />
of direct loans (<strong>and</strong>, on occasion, grants), the Ex-<br />
Im Bank provides credit at attractive interest rates to<br />
foreign buyers to encourage their purchase of U.S. goods<br />
<strong>and</strong> services. The Ex-Im Bank insures a wide variety<br />
of U.S. environmental exports, giving priority to small-<br />
42. For more information, visit the Ex-Im Bank’s Web site at<br />
www.exim.gov or contact the Ex-Im Bank’s Tied Aid Coordinator at<br />
(202) 565-3814.<br />
Case Study 3.6. <strong>Export</strong>-Import Bank Loan<br />
Guarantee Supports Aqua-Chem’s Sale of<br />
Desalination Equipment to the Caribbean<br />
Aqua-Chem, Inc.’s <strong>Water</strong> <strong>Technologies</strong> Division manufactures<br />
boilers <strong>and</strong> seawater desalination equipment.<br />
Headquartered in Milwaukee, Wisc., the division has<br />
developed a worldwide reputation as a supplier of industrial<br />
water equipment. It currently employs 1,300<br />
people in the United States.<br />
Aqua-Chem sold a complete desalination system to<br />
the Dutch colony of Aruba in 1998. This $8 million system<br />
provides 11.2 million gallons per day of desalted<br />
water to the Caribbean isl<strong>and</strong>. Used for both industrial<br />
applications <strong>and</strong> for potable water, the water generated<br />
by the desalination plant has helped the isl<strong>and</strong> keep up<br />
with the tourism-driven dem<strong>and</strong>.<br />
Aqua-Chem had provided desalination units to Aruba<br />
in the past <strong>and</strong> the <strong>Water</strong> <strong>and</strong> Electricity Board was<br />
pleased with its products. However, the utility had recently<br />
gone through a partial privatization <strong>and</strong> was particularly<br />
sensitive about capital costs. In order for the<br />
utility to purchase the more expensive but higher quality<br />
Aqua-Chem units, the company had to structure a<br />
particularly attractive financial package.<br />
Aqua-Chem turned to the <strong>Export</strong>-Import Bank for assistance.<br />
The Ex-Im Bank facilitated the sale by providing<br />
a loan guarantee to the <strong>Water</strong> <strong>and</strong> Electricity Board<br />
for this project. Ron Thimm, treasurer, stated that “without<br />
the Ex-Im Bank money, Aqua-Chem would very<br />
likely have lost the job to a foreign competitor.”<br />
Aqua-Chem used a banker to structure the financing<br />
<strong>and</strong> to complete the Ex-Im Bank application. Mr. Thimm<br />
highly recommends the use of a banker who underst<strong>and</strong>s<br />
both Ex-Im Bank’s financial assistance tools <strong>and</strong> other<br />
financing sources. He also stressed the importance of<br />
educating sales staff about the financing solutions <strong>and</strong><br />
countries where Ex-Im funds are available.<br />
For more information, contact Ron Thimm, treasurer,<br />
(414) 577-2845 or visit the company’s Web site at<br />
www.aqua-chem.com.<br />
business transactions <strong>and</strong> the expansion of the overseas<br />
presence of the U.S. environmental goods <strong>and</strong> services<br />
industry. The Ex-Im Bank does not compete with<br />
commercial lenders, but assumes the risks they cannot<br />
accept.<br />
The Bank has designed a special Environmental <strong>Export</strong>s<br />
Program that will provide enhanced levels of support<br />
for a broad range of environmental exports. The<br />
<strong>Water</strong> <strong>and</strong> <strong>Wastewater</strong> <strong>Export</strong> <strong>Market</strong> <strong>Plan</strong><br />
25
program demonstrates the Bank’s resolve to reach out to<br />
small <strong>and</strong> large exporters of environmental products <strong>and</strong><br />
services. In 1997, the Environmental <strong>Export</strong>s Program<br />
approved 47 transactions for a total export value of $1.9<br />
billion. 43 The major features of the program are:<br />
• A short-term Environmental <strong>Export</strong> Insurance Policy<br />
provides enhanced short-term multi-buyer <strong>and</strong><br />
single-buyer insurance coverage for small environmental<br />
exporters. The program features policies that<br />
deliver 95 percent commercial risk coverage <strong>and</strong> 100<br />
percent political risk (risk due to unexpected political<br />
events in the host country) coverage with no<br />
deductible.<br />
• Enhanced medium- <strong>and</strong> long-term support for<br />
environmental projects, products, <strong>and</strong> services.<br />
These enhancements, which are reflected in the Ex-<br />
Im Bank’s loan <strong>and</strong> guarantee programs, include:<br />
local cost coverage equal to 15 percent of the U.S.<br />
contract price, capitalization of interest during<br />
construction, <strong>and</strong> maximum allowable repayment<br />
terms permissible under OECD guidelines.<br />
Overseas Private Investment Corporation (OPIC).<br />
OPIC, a U.S. government agency, helps U.S. businesses<br />
of all sizes invest <strong>and</strong> compete in 140 emerging markets<br />
<strong>and</strong> developing nations worldwide. OPIC finances medium-<br />
to long-term investment projects through loan guarantees<br />
<strong>and</strong> direct loans. Direct loans are geared for small<br />
businesses or cooperatives <strong>and</strong> usually range between<br />
$2 million <strong>and</strong> $10 million. Loan guarantees range between<br />
$10 million <strong>and</strong> $200 million. OPIC protects U.S.<br />
business activities in emerging markets through its Investment<br />
Insurance Programs against currency inconvertibility,<br />
expropriation (loss of investment due to<br />
expropriation, nationalization, or confiscation by a foreign<br />
government), <strong>and</strong> political instability. The insurance<br />
programs also can be used to cover exp<strong>and</strong>ing investments.<br />
OPIC also offers the Small Contractor’s Guarantee<br />
Program, which assists small business construction<br />
<strong>and</strong> service contractors. However, OPIC does not provide<br />
export financing.<br />
There are also several funds operating under the aegis<br />
of OPIC that support U.S. environmental exports <strong>and</strong> investment<br />
overseas (see the section on commercial financing<br />
sources, below).<br />
U.S. Small Business Administration (SBA). The SBA<br />
has an <strong>Export</strong> Working Capital Program that guarantees<br />
43. Financing Environmental <strong>Export</strong>s: A Guide to the Fundamentals<br />
<strong>and</strong> Sources, U.S. Department of Commerce, International Trade<br />
Administration, 1998.<br />
26 U.S. Department of Commerce, International Trade Administration<br />
up to $750,000 of either short- or long-term loans to help<br />
small businesses increase their export sales of products<br />
or services. This program is designed to assist small businesses<br />
requiring capital to exp<strong>and</strong> sales or manufacturing<br />
for international markets, as well as meet their<br />
working capital needs. Loan proceeds may not be used<br />
to establish operations overseas.<br />
Commercial Financing Sources<br />
Private <strong>Export</strong> Funding Corporation (PEFCO).<br />
PEFCO is a consortium of private lenders which acts as<br />
a supplemental lender to traditional export financing<br />
sources. It works with the Ex-Im Bank by using private<br />
capital to finance U.S. exports. PEFCO makes loans of<br />
up to $225 million to public <strong>and</strong> private borrowers located<br />
outside of the United States who require medium<strong>and</strong>/or<br />
long-term financing on purchases of U.S. goods<br />
<strong>and</strong> services through traditional lenders or suppliers. In<br />
all cases, the loans made by PEFCO must be covered by<br />
the comprehensive guarantee of repayment of principal<br />
<strong>and</strong> interest by the Ex-Im Bank. The loan requests must<br />
come through a commercial bank.<br />
Global Environment Fund Family of Funds. This<br />
group of funds specializes in high-growth markets for<br />
environmental technologies, products, <strong>and</strong> services. The<br />
Global Environment Fund is a partnership that invests<br />
up to $4 million per venture in public <strong>and</strong> private environmental<br />
companies around the world. Global Environment<br />
Finance Partners invests in advanced-stage private<br />
firms for investments ranging from $500,000 to $2 million.<br />
The Global Environment Emerging <strong>Market</strong>s Funds<br />
(GEEMF I <strong>and</strong> II) are capitalized by OPIC <strong>and</strong> focus on<br />
environmental infrastructure in developing countries<br />
where OPIC operates.<br />
Allied Capital International Small Business Fund.<br />
This is a $20 million equity fund that invests in OPICdesignated<br />
countries <strong>and</strong> is managed by the Allied Capital<br />
Corporation. Eligible companies are small U.S.<br />
businesses seeking risk capital to exp<strong>and</strong> overseas. The<br />
preferred investment size is $2 million to $5 million. One<br />
of the sectors targeted by the Fund is environmental<br />
services.<br />
Aqua International Partners Environmental Fund.<br />
Aqua International Partners, a $232 million investment<br />
fund, makes private equity investments in companies providing<br />
water <strong>and</strong> water-related products or services to<br />
emerging market economies. Aqua invests in operating<br />
<strong>and</strong> special purpose companies that are devoted to water
<strong>and</strong> wastewater treatment operations (either being privatized<br />
or newly formed); manufacturing equipment or<br />
products (pipes, pumps, meters, filters, etc.) for commercial,<br />
industrial, <strong>and</strong> residential water users; <strong>and</strong> other related<br />
activities or services.<br />
U.S. Commercial Banks. U.S. commercial banks provide<br />
the bulk of trade <strong>and</strong> investment finance. In addition,<br />
various types of private <strong>and</strong> public infrastructure<br />
funds can be used to support technology exports. The U.S.<br />
Department of Commerce maintains a national clearinghouse<br />
of private <strong>and</strong> public financial institutions that offer<br />
trade finance. Also, the Office of Finance within the<br />
Department of Commerce’s International Trade Administration<br />
has developed a Web-based export finance<br />
matching service. This service is designed to match U.S.<br />
exporters with sources of export financing or risk mitigation.<br />
The site also provides links to U.S. commercial<br />
financing sources by state.<br />
Local Commercial Banks. Local financial institutions<br />
have an important role to play in financing small (under<br />
Case Study 3.7. Lemna: Finding Funds for International Clients<br />
Lemna International, Inc., of Minneapolis, Minn., is recognized<br />
worldwide as a supplier of innovative wastewater<br />
treatment systems. Lemna offers complete treatment<br />
plant designs <strong>and</strong> equipment for municipal <strong>and</strong> industrial<br />
applications globally, <strong>and</strong> has completed more than 100<br />
facilities. About 60 of these are in the United States, with<br />
the remainder located in developing countries, including<br />
Turkey, Pol<strong>and</strong>, <strong>and</strong> Slovakia. Lemna International’s sister<br />
company, Lemna <strong>Technologies</strong>, works with municipalities<br />
of fewer than 100,000 people. Lemna also<br />
provides its technologies to industries, including food processing<br />
plants, dairies, wineries, packaging production<br />
facilities, rendering plants, pig farms, <strong>and</strong> many others.<br />
In Pol<strong>and</strong>, Lemna has worked with more than 30 municipalities,<br />
from small rural communities to medium-sized<br />
cities of 100,000 to 200,000 inhabitants.<br />
When Lemna found that obtaining funds to build water<br />
<strong>and</strong> wastewater infrastructure was a major problem for<br />
many of its clients, the company designed an innovative<br />
strategy to help its clients secure needed project funds.<br />
The Lemna Infrastructure Financing Enterprise (LIFE) was<br />
set up to identify possible funding sources <strong>and</strong> help clients<br />
arrange appropriate financing terms. LIFE staff help<br />
Lemna International’s clients determine which financing<br />
structure will best meet their needs, <strong>and</strong> then assist them<br />
$1 million) environmental investments, particularly in the<br />
industrial sector. Credit is generally tight in developing<br />
countries, making current conditions in local capital markets<br />
a significant factor in financing energy efficiency<br />
investments. Chile is a positive example of a fairly welldeveloped<br />
local capital market, including a long-term<br />
bond market. However, in most other developing countries,<br />
capital markets are immature, <strong>and</strong> U.S. firms often<br />
find it too difficult <strong>and</strong> expensive to borrow money locally,<br />
unless local financial institutions act as intermediaries<br />
for external financing sources such as multilateral<br />
development banks.<br />
Self-Financing Mechanisms. Very few U.S. water <strong>and</strong><br />
wastewater companies have set up their own financing<br />
arms to complement their technology exports. However,<br />
the larger, total solution-oriented companies can often<br />
successfully create their own entities for identifying funding<br />
sources <strong>and</strong> structuring debt <strong>and</strong> equity financing.<br />
The case study below highlights the success of Lemna<br />
International in setting up a financing arm.<br />
in securing all or part of the funds. LIFE works with debt,<br />
equity, <strong>and</strong> lease-back arrangements, <strong>and</strong> is experienced<br />
in working with private <strong>and</strong> institutional investors, private<br />
lenders, <strong>and</strong> export credit agencies, including the U.S.<br />
<strong>Export</strong>-Import Bank.<br />
LIFE structured a $25 million loan package for the design<br />
<strong>and</strong> construction of a sewage system <strong>and</strong> wastewater<br />
treatment plant for a Turkish municipality of 400,000<br />
people. The loan package included funds from Ex-Im <strong>and</strong><br />
two international banks. The first phase of this project has<br />
been constructed, <strong>and</strong> LIFE is beginning work on financing<br />
for Phase II, also for $25 million. LIFE is nearing<br />
completion of a debt <strong>and</strong> equity package for a wastewater<br />
treatment plant in China, to be built through a joint venture<br />
that includes Lemna International. The total financing<br />
for this project will be about $120 million. Other<br />
current LIFE projects range in size from wastewater treatment<br />
projects in Pol<strong>and</strong> valued at less than $6 million to a<br />
$36 million water supply project in Romania <strong>and</strong> a $50<br />
million water supply expansion project in sub-Saharan<br />
Africa.<br />
For more information, contact Poldi Gerard, vice president<br />
of marketing, at pgerard@lemna.com or (612) 253-<br />
2000, or visit Lemna’s Web site at www.lemna.com.<br />
Source: Primary interview with Poldi Gerald.<br />
<strong>Water</strong> <strong>and</strong> <strong>Wastewater</strong> <strong>Export</strong> <strong>Market</strong> <strong>Plan</strong><br />
27
Chapter 4<br />
Best Prospects in <strong>Water</strong> <strong>and</strong> <strong>Wastewater</strong> Treatment<br />
The countries that represent best prospects for U.S.<br />
exporters of water <strong>and</strong> wastewater equipment <strong>and</strong> services<br />
are determined by a number of factors, including,<br />
but not limited to, the:<br />
• Overall size of the water <strong>and</strong> wastewater market in<br />
the country;<br />
• Openness of that market to imports (partly reflected<br />
in the share of imports in the total market);<br />
• <strong>Market</strong>’s growth rate; <strong>and</strong><br />
• Historic U.S. position in the market <strong>and</strong> the U.S.<br />
import market share.<br />
This chapter contains market profiles of 12 countries<br />
that fit several of these criteria. The profiled countries<br />
are Australia, Brazil, China, Egypt, India, Japan, South<br />
Korea, Mexico, Saudi Arabia, Spain, Taiwan, <strong>and</strong> the<br />
United Kingdom, representing a mix of developed <strong>and</strong><br />
developing countries.<br />
Each of the country profiles provides general statistical<br />
data, 44 a market overview, <strong>and</strong> discussions of the<br />
44. Unless otherwise noted, the general statistical data were taken from<br />
Global <strong>Water</strong> Supply <strong>and</strong> Sanitation Assessment 2000, World Health<br />
Organization, 2000, with the exception of the GDP growth data that<br />
were taken from World Development Report, World Bank, 2000.<br />
28 U.S. Department of Commerce, International Trade Administration<br />
regulatory <strong>and</strong> institutional framework for the water sector,<br />
the status of privatization of the water supply <strong>and</strong><br />
sewerage infrastructure, U.S. market share <strong>and</strong> competition,<br />
<strong>and</strong> market opportunities.<br />
Brazil, China, India, Japan, South Korea, Mexico,<br />
Spain, Taiwan, <strong>and</strong> the United Kingdom all have water<br />
<strong>and</strong> wastewater markets that exceed $1 billion in size.<br />
Such emerging markets as China, India, South Korea, Taiwan,<br />
Mexico, <strong>and</strong> Brazil have enormous potential due to<br />
the extent of unmet water supply <strong>and</strong> sewerage needs.<br />
These countries’ growth rates usually exceed 10 percent<br />
per year. Japan, the United Kingdom, <strong>and</strong> Spain are mature<br />
markets with slower growth, but their sheer size <strong>and</strong><br />
favorable business climate make them worth exporters’<br />
consideration. Australia is another mature market of<br />
smaller size than Japan, the United Kingdom, <strong>and</strong> Spain,<br />
but it is a market that favors U.S. firms. Egypt <strong>and</strong> Saudi<br />
Arabia are niche markets for U.S. exporters. Egypt is an<br />
exclusively donor-driven market, where U.S. foreign aid<br />
gives a significant advantage to American companies.<br />
Saudi Arabia is a highly specialized market with a focus<br />
45. Includes Hong Kong.<br />
46. The numbers cover the desalination market only.<br />
Table 4.1. Principal <strong>Water</strong> <strong>and</strong> <strong>Wastewater</strong> <strong>Market</strong> Characteristics in Selected Countries<br />
Country Total <strong>Market</strong> Size Annual Growth Percent of Total U.S. Import <strong>Market</strong><br />
(millions of dollars) (percent) <strong>Market</strong> from Imports Share (percent)<br />
Australia 603 (1999) 7 70 55<br />
Brazil 1,700 (1998) n.a. 20 35<br />
China2 5,336 (1999) 25-35 35 12<br />
Egypt 856 (1998) 10 90 35<br />
India 1,180 (2000) 15 40 25<br />
Japan 6,000 (1996) 5-8 n.a. n.a.<br />
S. Korea 3,400 (2000) n.a. 40 20<br />
Mexico 2,390 (2000) 10 80 70<br />
Saudi Arabia46 357 (1998) 5 85 16<br />
Spain 4,000 (1998) n.a. n.a. n.a.<br />
Taiwan 1,900 (1999) n.a. 75 28<br />
United Kingdom 4,000 (2000) 4 55 25<br />
n.a. = not available<br />
Sources: Various—see references in individual country profiles.
on desalination technology, where the U.S. also has a<br />
good strategic position.<br />
Table 4.1 presents a summary of the estimates of the<br />
principal market indicators for the profiled countries.<br />
Table 4.2 presents data on the value of U.S. water <strong>and</strong><br />
wastewater technology exports to 32 countries. These<br />
data represent exports of potable water treatment equipment,<br />
water <strong>and</strong> wastewater monitoring <strong>and</strong> analysis<br />
equipment, <strong>and</strong> wastewater management equipment. 47<br />
The countries that are profiled here are indicated in gray.<br />
47. These data were obtained by analyzing the appropriate 10-digit<br />
HTS codes.<br />
Table 4.2. U.S. <strong>Export</strong>s of Key Categories of <strong>Water</strong> <strong>and</strong> <strong>Wastewater</strong> Equipment, 1999 (thous<strong>and</strong>s of U.S. dollars)<br />
Rank Country Potable <strong>Water</strong> Treatment Monitoring <strong>and</strong> Analysis <strong>Wastewater</strong> Management Total<br />
1 Mexico 173,533 2,399,198 1,710,963 4,283,694<br />
2 Canada 68,955 2,789,464 1,014,083 3,872,502<br />
3 Japan 232,961 1,023,557 143,317 1,399,835<br />
4 United Kingdom 78,869 664,966 119,326 863,161<br />
5 Germany 78,946 633,498 92,968 805,412<br />
6 South Korea 178,534 384,983 68,827 632,344<br />
7 Taiwan 174,857 354,546 62,139 591,542<br />
8 Singapore 141,393 317,748 33,108 492,249<br />
9 China (w/Hong Kong) 38,284 337,081 92,386 467,751<br />
10 Netherl<strong>and</strong>s 94,100 332,198 30,681 456,979<br />
11 France 9,174 320,599 115,835 445,608<br />
12 Italy 40,966 245,110 4,773 290,849<br />
13 Belgium 735 119,342 51,064 171,141<br />
14 Malaysia 40,968 107,197 12,800 160,965<br />
15 Australia 4,919 87,109 48,568 140,596<br />
16 Brazil 4,727 92,290 15,809 112,826<br />
17 Israel 46,572 55,127 5,244 106,943<br />
18 Philippines 54,655 32,289 1,478 88,422<br />
19 Spain 805 49,336 24,674 74,815<br />
20 Thail<strong>and</strong> 0 64,228 4,094 68,322<br />
21 Aruba 58,662 0 0 58,662<br />
22 Saudi Arabia 559 25,188 31,827 57,574<br />
23 Russia 0 23,012 24,617 47,629<br />
24 Irel<strong>and</strong> 0 29,074 11,689 40,763<br />
25 Switzerl<strong>and</strong> 0 33,913 3,353 37,266<br />
26 Venezuela 9,609 14,475 12,593 36,677<br />
27 United Arab Emirates 151 23,260 3,954 27,365<br />
28 Sweden 0 24,382 786 25,168<br />
29 India 0 14,879 6,888 21,767<br />
30 Argentina 2,961 10,986 5,944 19,891<br />
31 Dominican Republic 173 11,691 1,645 13,509<br />
32 Egypt 1,057 930 9,360 11,347<br />
33 Turkey 448 4,922 5,197 10,567<br />
34 Colombia 2,267 2,215 5,133 9,615<br />
35 Austria 5,149 1,997 0 7,146<br />
Source: U.S. International Trade Commission, Harmonized Tariff Schedule.<br />
<strong>Water</strong> <strong>and</strong> <strong>Wastewater</strong> <strong>Export</strong> <strong>Market</strong> <strong>Plan</strong><br />
29
Australia<br />
Population: 19 million (2000)<br />
Urban population: 84 percent (2000)<br />
GNP per capita: $20,640 (1999)<br />
GDP average annual growth rate: 3.8 percent (1990–1998)<br />
<strong>Water</strong> supply coverage (urban/rural): 100 percent/<br />
100 percent (2000)<br />
Sanitation coverage (urban/rural): 100 percent/<br />
100 percent (2000)<br />
<strong>Market</strong> Overview<br />
The sewerage systems in most of Australia’s major<br />
cities are old <strong>and</strong> overloaded. Infiltration of rainwater <strong>and</strong><br />
overflows of sewage are frequent problems. Large investments<br />
are needed to increase sewer capacity <strong>and</strong> improve<br />
their condition, as well as to improve the quality of treatment.<br />
In addition, municipalities are turning to the practice<br />
of recycling wastewater in order to alleviate the<br />
pollution load of the country’s rivers <strong>and</strong> coastal waters.<br />
<strong>Water</strong> supply problems in Australia are not as urgent as<br />
wastewater ones, with nearly all the population connected<br />
to centralized water supply, most of which is treated to<br />
some degree, if only by disinfection.<br />
<strong>Water</strong> <strong>and</strong> wastewater treatment are the largest segments<br />
of environmental business in Australia, representing<br />
67 percent of the total environmental market. The<br />
total market for water <strong>and</strong> wastewater equipment was<br />
estimated at $603 million in 1999, with 70 percent of<br />
the dem<strong>and</strong> satisfied by imported equipment. Investment<br />
in water supply infrastructure was roughly $232 million<br />
in 1999, compared to $374 million for municipal wastewater<br />
treatment plants. The distribution of these invest-<br />
Table 4.3. Investment in <strong>Water</strong> <strong>and</strong> <strong>Wastewater</strong><br />
Treatment <strong>Plan</strong>ts in Australia, 1999 (millions of<br />
U.S. dollars)<br />
State/Territory Investment Amount<br />
New South Wales<br />
203.4<br />
Victoria<br />
155.5<br />
Queensl<strong>and</strong><br />
93.5<br />
South Australia<br />
56.2<br />
Western Australia<br />
67.8<br />
Tasmania<br />
10.6<br />
Australian Capital Territory<br />
18.5<br />
Northern Territory<br />
0.7<br />
Total<br />
606.2<br />
Source: The <strong>Water</strong> <strong>and</strong> <strong>Wastewater</strong> <strong>Market</strong> in Australia, Canada, Department<br />
of Foreign Affairs <strong>and</strong> International Trade (Ottawa, 1999).<br />
30 U.S. Department of Commerce, International Trade Administration<br />
ments by state <strong>and</strong> territory is shown in Table 4.3. The<br />
market is growing at about 7 percent a year, due mainly<br />
to the water <strong>and</strong> sewerage infrastructure rehabilitation <strong>and</strong><br />
expansion programs. 48<br />
The industrial wastewater treatment market is much<br />
smaller but has been growing recently as the regulatory<br />
requirements for pretreating industrial effluents become<br />
more stringent. The Australian <strong>Water</strong> <strong>and</strong> <strong>Wastewater</strong><br />
Association estimates that the Australian industry<br />
spends about $59 million per year for on-site effluent<br />
pretreatment. 49<br />
Regulatory <strong>and</strong> Institutional Framework<br />
Australia’s federal government has limited environmental<br />
responsibilities, with most functions administered<br />
by states <strong>and</strong> territories. The Department of Primary Industries<br />
<strong>and</strong> Energy oversees water resource issues. The<br />
National Environment Protection Council <strong>and</strong> the Environmental<br />
Protection Agency are responsible for coordinating<br />
environmental management programs at the<br />
federal <strong>and</strong> state levels. The Council oversees the implementation<br />
of environmental regulations at the federal<br />
level. However, pollution licenses are issued <strong>and</strong> enforced<br />
by state authorities. In some states (for example,<br />
Queensl<strong>and</strong>), the licensing <strong>and</strong> enforcement have been<br />
delegated to the local councils. States have recently<br />
undertaken initiatives aimed at using guidelines <strong>and</strong><br />
codes of practice for certain polluting industries,<br />
as part of the general trend away from a rigid comm<strong>and</strong><strong>and</strong>-control<br />
system toward industrial self-monitoring <strong>and</strong><br />
self-regulation.<br />
State governments are responsible for water supply <strong>and</strong><br />
wastewater treatment in Australia, although day-to-day<br />
operational management is carried out at the local level.<br />
Privatization<br />
Australian state governments are starting the process<br />
of restructuring <strong>and</strong> reforming public utilities by setting<br />
up state-owned corporations. The move is supposed to<br />
promote greater efficiency through increased competition.<br />
To date, almost all Australian public water authorities<br />
have been incorporated, <strong>and</strong> most states are looking<br />
toward eventual privatization, primarily due to the lack<br />
of investment funds. Presently, although state-owned<br />
utilities are still the main purchasers of wastewater treatment<br />
equipment, some of them have already been opened<br />
48. The <strong>Water</strong> <strong>and</strong> <strong>Wastewater</strong> <strong>Market</strong> in Australia, Canada, Department<br />
of Foreign Affairs <strong>and</strong> International Trade (Ottawa, 1999).<br />
49. Ibid.
to private participation via management contracts. New<br />
sewage treatment plants are usually privatized under<br />
BOO contracts.<br />
Trade <strong>and</strong> Investment Policy<br />
No trade restrictions or other non-tariff barriers exist<br />
for imported water <strong>and</strong> wastewater equipment. The general<br />
import tariff rate varies from 0 to 5 percent, depending<br />
on whether or not local manufacturers exist for the<br />
same product. Certain state-of-the-art capital equipment<br />
may be imported duty free for specific projects.<br />
There are no tight controls that govern imported water<br />
<strong>and</strong> wastewater equipment. Each technology or type<br />
of equipment is evaluated on its own merits. Details of<br />
applicable state-level technology requirements may be<br />
obtained from the environmental departments or relevant<br />
industry associations.<br />
U.S. <strong>Market</strong> Share <strong>and</strong> Competition<br />
Australia has developed world-class expertise in some<br />
areas of wastewater treatment, <strong>and</strong> a number of local environmental<br />
firms sell competitive sewage treatment process<br />
equipment. The majority of pipes <strong>and</strong> fittings are<br />
also manufactured locally. The industry is dominated by<br />
small <strong>and</strong> medium-sized companies with sales less than<br />
$1 million. The principal Australian manufacturers in this<br />
market include Acron Noble Pty. Ltd. (biological wastewater<br />
treatment systems), Australian Ultraviolet Services<br />
(ultraviolet disinfection equipment), Sepa <strong>Wastewater</strong><br />
Treatment (turnkey treatment plants), Tubemakers of<br />
Australia (pipes <strong>and</strong> fittings), Warman International Ltd.<br />
(pumps), etc.<br />
Domestic sales, however, have historically been hampered<br />
by the unwillingness of the water utilities to trust<br />
the local industry or to support local innovations. In addition,<br />
the local industry sometimes lacks investment<br />
capital to fund research <strong>and</strong> development projects <strong>and</strong> to<br />
commercialize their products.<br />
The United States dominates the import market for<br />
wastewater treatment equipment with a 55 percent market<br />
share, followed by Germany, Britain, <strong>and</strong> Japan (see<br />
Figure 4.1). <strong>Wastewater</strong> equipment is also imported from<br />
France, Sweden, <strong>and</strong> Italy. The major overseas players<br />
include French companies ONDEO <strong>and</strong> Vivendi <strong>and</strong> the<br />
British company Thames <strong>Water</strong>. ONDEO is basing its<br />
Asia/Pacific wastewater research program in Sydney, creating<br />
a great potential for future exports. The success of<br />
these firms can be partly attributed to Australia’s historical<br />
choice of European over U.S.-designed sewerage systems.<br />
Another obstacle for U.S. suppliers is their<br />
reluctance to meet Australian quality assurance st<strong>and</strong>ards.<br />
Figure 4.1. Import <strong>Market</strong> Shares for <strong>Wastewater</strong><br />
Treatment Equipment in Australia<br />
United Kingdom<br />
10%<br />
Germany<br />
15%<br />
Other Countries<br />
15%<br />
Many large wastewater treatment BOO projects have<br />
been awarded recently to French <strong>and</strong> British companies<br />
in consortia with Australian firms. A consortium led by<br />
Vivendi that includes Thames <strong>Water</strong> has recently won a<br />
$1 billion 15-year operations <strong>and</strong> management contract<br />
for Adelaide’s water <strong>and</strong> wastewater utility. U.S. companies<br />
have been largely absent from these projects.<br />
Nonetheless, U.S. water <strong>and</strong> wastewater equipment suppliers<br />
still have opportunities to sell to local companies<br />
bidding on such concessions.<br />
<strong>Market</strong> Opportunities<br />
Japan<br />
5%<br />
United States<br />
55%<br />
Source: U.S. <strong>and</strong> Foreign Commercial Service <strong>and</strong> U.S. Department<br />
of State, Industry Sector Analysis; Australia: <strong>Wastewater</strong> Treatment<br />
Equipment (Washington, D.C.: 1998).<br />
The biggest opportunities exist in wastewater treatment<br />
systems. Some of the major projects currently underway<br />
include:<br />
• Upgrade of the Woodman Point wastewater treatment<br />
plant in Western Australia ($79 million)<br />
• Expansion of the Perth sewerage network, Western<br />
Australia ($174 million)<br />
• Construction of a sewerage tunnel <strong>and</strong> a sludge<br />
h<strong>and</strong>ling plant in Camellia, New South Wales ($178<br />
million)<br />
• The Hunter Sewerage Project, New South Wales<br />
($205 million)<br />
• Upgrade of the wastewater treatment plant at<br />
Cronulla, New South Wales ($60 million)<br />
<strong>Water</strong> <strong>and</strong> <strong>Wastewater</strong> <strong>Export</strong> <strong>Market</strong> <strong>Plan</strong><br />
31
• Expansion of the Picton sewerage network, New<br />
South Wales ($36 million)<br />
• The Northwestern Sewerage Project, Victoria ($152<br />
million)<br />
• Upgrade of the Bolivar wastewater treatment plant,<br />
South Australia ($66 million)<br />
The largest water supply infrastructure projects are the<br />
upgrade of 30 inl<strong>and</strong> water treatment plants in New South<br />
Wales ($180 million), 10 water treatment plants in South<br />
Australia ($54 million), <strong>and</strong> the Gladstone water supply<br />
expansion project in Queensl<strong>and</strong> ($114 million).<br />
Best sales prospects include biofiltration systems,<br />
sludge presses <strong>and</strong> stabilizers, oxidation systems for industrial<br />
wastewater treatment, filtration equipment, <strong>and</strong><br />
membrane technologies for water recycling. Given the<br />
strength of local manufacturers, fewer opportunities exist<br />
for pumping equipment.<br />
Some industrial wastewater treatment opportunities<br />
exist at gold <strong>and</strong> copper mines, wool scour mills, steel<br />
mills, pulp <strong>and</strong> paper mills, breweries, petrochemical<br />
plants, chemical <strong>and</strong> pharmaceutical plants, abattoirs, <strong>and</strong><br />
food processing facilities.<br />
Brazil<br />
Population: 170 million (2000)<br />
Urban population: 81 percent (2000)<br />
GNP per capita: $4,420 (1999)<br />
GDP average annual growth rate: 3.2 percent (1990–1998)<br />
<strong>Water</strong> supply coverage (urban/rural): 95 percent/<br />
45 percent (2000)<br />
Sanitation coverage (urban/rural): 85 percent/<br />
45 percent (2000)<br />
<strong>Market</strong> Overview<br />
Brazil’s water supply <strong>and</strong> sanitation sector is experiencing<br />
a wide range of technical, operational, financial,<br />
<strong>and</strong> other problems. The water supply network is exp<strong>and</strong>ing<br />
slowly <strong>and</strong> cannot cope with the rapid population<br />
growth. Up to 50 percent of water loss occurs in the distribution<br />
system. Municipal wastewater treatment has<br />
historically received even less investment than water supply.<br />
Only 20 percent of the wastewater collected is treated.<br />
Large quantities of untreated sewage are discharged into<br />
open waters, resulting in a serious public health hazard,<br />
particularly in such states as São Paulo, Minas Gerais,<br />
<strong>and</strong> Rio de Janeiro. There are also stark differences in<br />
the extent <strong>and</strong> quality of water supply <strong>and</strong> sanitation services<br />
between the richer south <strong>and</strong> southeast regions of<br />
the country (about 60 percent sewerage coverage) <strong>and</strong><br />
32 U.S. Department of Commerce, International Trade Administration<br />
the poorer north <strong>and</strong> northeast (less than 5 percent<br />
coverage). 50<br />
In metropolitan centers such as Rio de Janeiro <strong>and</strong> São<br />
Paulo, industrial effluents represent around 30 percent<br />
of the organic load in the total wastewater discharges.<br />
About 20 percent of the industrial facilities are responsible<br />
for almost 80 percent of the industrial effluent load.<br />
Almost all the large polluters have signed agreements<br />
with regulatory agencies that defined their compliance<br />
plans.<br />
Investment needs are estimated at $33 billion through<br />
2010 to overcome existing gaps in water supply <strong>and</strong> sewerage<br />
coverage, as well as to respond to the growing dem<strong>and</strong><br />
for these services. 51 The water <strong>and</strong> wastewater<br />
technologies market was estimated at $1.7 billion in<br />
1998. 52 The dem<strong>and</strong> for consulting services will likely<br />
be around $100 million per year through 2004. 53<br />
Regulatory <strong>and</strong> Institutional Framework<br />
The 1997 <strong>Water</strong> Law introduced the river basin management<br />
approach in Brazil, with multi-stakeholder water<br />
basin committees being responsible for long-term<br />
water resources planning <strong>and</strong> charging water use <strong>and</strong><br />
wastewater discharge fees (established in a 2000 regulation).<br />
The federal agency responsible for the regulation<br />
<strong>and</strong> overall supervision of the water resources sector is<br />
the Division of Sanitation of the Secretariat of Urban<br />
Policy of the Ministry of <strong>Plan</strong>ning <strong>and</strong> Budget. The policy<br />
stipulates that water supply <strong>and</strong> sanitation services can<br />
be provided by state-wide water <strong>and</strong> wastewater companies<br />
(under current concessions), municipal public utilities,<br />
or private companies. In 2000, a new law created<br />
the National <strong>Water</strong> Agency, which will coordinate the<br />
national water policy <strong>and</strong> the privatization of state-owned<br />
water companies.<br />
The 1990 National Environmental Policy Act defined<br />
water quality st<strong>and</strong>ards <strong>and</strong> a national discharge permit<br />
system that are based on nine water use categories (for<br />
example, domestic consumption, recreation, irrigation,<br />
etc.). The permit system is administered by the National<br />
Environmental Council. States have the authority to make<br />
their regulations more stringent than the federal st<strong>and</strong>ards.<br />
For example, the environmental agencies in the states of<br />
Rio de Janeiro <strong>and</strong> São Paulo have adopted effluent stan-<br />
50. “Brazil: <strong>Water</strong> <strong>and</strong> <strong>Wastewater</strong> Concession Opportunities,” Industry<br />
Sector Analysis, U.S. <strong>and</strong> Foreign Commercial Service <strong>and</strong><br />
U.S. Department of State, 1998.<br />
51. Ibid.<br />
52. Brazil Environmental <strong>Technologies</strong> <strong>Market</strong>, Latin America Business<br />
Development Mission, U.S. Department of Commerce, 2000.<br />
53. Brazilian <strong>Wastewater</strong> Industry Forecast 2000, InfoAmericas<br />
(http://infoamericas.com).
dards that require secondary treatment of wastewater discharges.<br />
Recent regulations require effluent self-monitoring<br />
<strong>and</strong> reporting from municipal sewage treatment<br />
plants <strong>and</strong> several types of industry. The 1998 Environmental<br />
Law contributed significantly to the improvement<br />
of environmental enforcement in the country by raising<br />
sanctions for environmental violations.<br />
Privatization<br />
In the 1990s, privatization of state-owned enterprises<br />
began to be recognized as a tool for economic change,<br />
as the government strove to reduce subsidies to unprofitable<br />
companies. Public service monopolies started to<br />
open up to competition <strong>and</strong> impartial regulation. Ambitious<br />
privatization programs have been undertaken in the<br />
telecommunications, power, <strong>and</strong>, to a lesser extent, water<br />
<strong>and</strong> sanitation sectors.<br />
According to the Law on Concessions, the authority<br />
to issue water <strong>and</strong> wastewater concessions rests at the<br />
municipal level. However, the state authorities continue<br />
to oversee regional distribution networks <strong>and</strong> utilities that<br />
service more than one municipality. In fact, state governments<br />
are better positioned than municipalities to design<br />
concessions <strong>and</strong> provide financing guarantees for<br />
projects.<br />
Resources are available through the Brazilian Economic<br />
Development Bank to finance privatization studies<br />
<strong>and</strong> projects, both at the state <strong>and</strong> municipal levels.<br />
The Bank is more inclined to support post-privatization<br />
investments by operators than finance the privatization<br />
process itself.<br />
The private sector participation models currently used<br />
in Brazil’s water sector include service contracts (most<br />
commonly used), full concessions (used mostly in smaller<br />
cities), BOT schemes (in the states of São Paulo <strong>and</strong><br />
Minas Gerais), <strong>and</strong> joint ownership arrangements (so far,<br />
the only example of this scheme is the Parana State <strong>Water</strong><br />
Company).<br />
The majority of private participation projects (16) are<br />
taking place in the state of São Paulo, most under the<br />
BOT scheme, with six of them involving investments of<br />
over $10 million. The largest project in the state is the<br />
$124 million concession that has been granted to Aguas<br />
de Limeira, a joint venture between the French conglomerate<br />
ONDEO <strong>and</strong> Compahnia Brasiliera de Projectos e<br />
Obras, a Brazilian civil construction firm. The state of<br />
Rio de Janeiro uses only the full concession model, <strong>and</strong><br />
the four largest mixed water/wastewater concessions in<br />
the state are worth almost $400 million in investments. 54<br />
54. “Brazil: <strong>Water</strong> <strong>and</strong> <strong>Wastewater</strong> Concession Opportunities,” Industry<br />
Sector Analysis, U.S. <strong>and</strong> Foreign Commercial Service <strong>and</strong><br />
U.S. Department of State, 1998.<br />
Another breakthrough for the private sector occurred in<br />
1998, when Vivendi acquired 30 percent of the shares of<br />
Sanepar, which serves seven million people in the state<br />
of Parana.<br />
At the same time, water utility privatization faces opposition<br />
from some political groups <strong>and</strong> unions. For example,<br />
the privatization of CEDAE (the Rio de Janeiro<br />
state public company), the second-largest water company<br />
in Brazil, has been canceled due to political controversy<br />
<strong>and</strong> legal actions.<br />
Trade <strong>and</strong> Investment Policy<br />
Brazil is a member of Mercosur—a regional free trade<br />
agreement that also includes Argentina, Paraguay, <strong>and</strong><br />
Uruguay. However, Brazil’s industry remains protected<br />
from imports from non-Mercosur countries. Tariffs for<br />
environmental equipment are still high (even though they<br />
have dropped dramatically over the last decade) <strong>and</strong> average<br />
19 percent.<br />
Despite the fact that Brazil must comply with World<br />
Trade Organization (WTO) regulations requiring equal<br />
treatment of foreign <strong>and</strong> domestic companies, there is a<br />
non-official “buy Brazilian” policy for government procurement.<br />
Foreign companies that have production facilities<br />
in Brazil are usually chosen over those that have<br />
not committed to investment in the country. Brazilian law<br />
requires foreign bidders to be associated with a local firm.<br />
U.S. <strong>Market</strong> Share <strong>and</strong> Competition<br />
Over 80 percent of the water supply <strong>and</strong> sanitation<br />
equipment in Brazil is produced by Brazilian manufacturers,<br />
although roughly half of them are engaged in some<br />
form of technology agreement with foreign partners. For<br />
instance, the market for pipes <strong>and</strong> fittings is dominated<br />
by the French company Pont-à-Mousson, which operates<br />
under the name Barbara in Brazil. 55 Filsan <strong>and</strong> its subsidiaries,<br />
Enfil <strong>and</strong> Aquamec, are other examples of Brazilian<br />
water <strong>and</strong> wastewater equipment suppliers having<br />
a significant market share. These companies have operated<br />
for over 30 years <strong>and</strong> have established solid relationships<br />
with most municipal <strong>and</strong> state clients.<br />
Partnering with a Brazilian company is almost imperative<br />
for foreign exporters in this market.<br />
U.S. exports represent about 35 percent of the import<br />
market for municipal water supply <strong>and</strong> wastewater treatment<br />
equipment, followed by France, Germany, <strong>and</strong><br />
Sweden. In the industrial wastewater treatment market<br />
segment, the U.S. holds a 60 percent import market share,<br />
followed by France <strong>and</strong> Japan (see Figure 4.2). The best<br />
55. Ibid.<br />
<strong>Water</strong> <strong>and</strong> <strong>Wastewater</strong> <strong>Export</strong> <strong>Market</strong> <strong>Plan</strong><br />
33
Figure 4.2. Import <strong>Market</strong> Shares for Industrial<br />
<strong>Wastewater</strong> Treatment Equipment in Brazil<br />
France<br />
25%<br />
Japan<br />
10%<br />
Source: Canada, Department of Foreign Affairs <strong>and</strong> International<br />
Trade, The <strong>Water</strong> <strong>and</strong> <strong>Wastewater</strong> <strong>Market</strong> in Brazil (Ottawa, 1999).<br />
established European water companies in Brazil are the<br />
French groups Vivendi <strong>and</strong> ONDEO, Britain’s Thames<br />
<strong>Water</strong>, <strong>and</strong> Aguas de Portugal.<br />
<strong>Market</strong> Opportunities<br />
Other Countries<br />
5%<br />
United States<br />
60%<br />
All around Brazil, significant potential opportunities<br />
abound for investors <strong>and</strong> suppliers of water <strong>and</strong> wastewater<br />
equipment <strong>and</strong> services to participate in the<br />
privatization program. A strong market growth can be<br />
expected for BOT projects in the construction <strong>and</strong> operation<br />
of wastewater treatment plants, particularly in<br />
cities with over 100,000 inhabitants.<br />
About 80 percent of the funds allocated for improvements<br />
of water <strong>and</strong> wastewater systems in low-income<br />
areas is distributed through Brazil’s Social Action <strong>and</strong><br />
Sanitation Program. Between 1995 <strong>and</strong> 1998, the program<br />
spent $440 million on water supply improvements<br />
<strong>and</strong> $930 million on wastewater treatment projects.<br />
Other opportunities come from large projects implemented<br />
with support from multilateral development<br />
banks, including the IDB’s Tiete River Cleanup Project<br />
($400 million), the Federal District Basic Sanitation Program<br />
($260 million), the Guaiba <strong>Water</strong>shed Environmental<br />
Management Program ($221 million), as well as the<br />
World Bank’s Bahia <strong>Water</strong> Resources Management<br />
project ($51 million), <strong>and</strong> São Paulo <strong>Water</strong> Quality <strong>and</strong><br />
Pollution Control Program ($245 million).<br />
Private industry, particularly textile, petrochemical,<br />
<strong>and</strong> pulp <strong>and</strong> paper industries, pressured by stricter en-<br />
34 U.S. Department of Commerce, International Trade Administration<br />
Table 4.4. Brazilian <strong>Wastewater</strong> Equipment Dem<strong>and</strong><br />
Forecast, 2001–2004 (millions of U.S. dollars)<br />
Equipment Type<br />
<strong>Wastewater</strong><br />
treatment<br />
2001 2002 2003 2004<br />
equipment 200 270 350 450<br />
Pipes 450 500 520 550<br />
Hydrometers<br />
Pipe cleaning<br />
98 123 131 135<br />
equipment 15 17 21 23<br />
Valves 15 20 26 33<br />
Pumps 45 52 58 67<br />
Other 32 38 44 52<br />
Total 855 1,020 1,050 1,310<br />
Source: Brazilian <strong>Wastewater</strong> Industry Forecast 2000, InfoAmericas<br />
(http://infoamericas.com).<br />
vironmental laws, will also invest more in effluent treatment<br />
equipment.<br />
<strong>Wastewater</strong> treatment accounted for 41 percent of investments<br />
in this sector in 2000, water infrastructure improvements<br />
for 38 percent, sewerage system upgrades<br />
for 15 percent, <strong>and</strong> engineering <strong>and</strong> consulting services<br />
for 6 percent. 56 Table 4.4 presents projected opportunities<br />
for sales of different types of wastewater equipment.<br />
Despite the strength of local manufacturers of pipes,<br />
valves, pumps, <strong>and</strong> septic tanks, there are still technology<br />
gaps in Brazil’s water <strong>and</strong> wastewater market that<br />
need to be filled by imports. These include hydrometers,<br />
leak detection equipment, <strong>and</strong> wastewater treatment<br />
equipment <strong>and</strong> chemicals, as well as automation<br />
software.<br />
People’s Republic of China<br />
Population: 1.278 billion (2000)<br />
Urban population: 32 percent (2000)<br />
GNP per capita: $780 (1999)<br />
GDP average annual growth rate: 11.2 percent<br />
(1990–1998)<br />
<strong>Water</strong> supply coverage (urban/rural): 94 percent/<br />
66 percent (2000)<br />
Sanitation coverage (urban/rural): 68 percent/<br />
24 percent (2000)<br />
This market profile covers both mainl<strong>and</strong> China <strong>and</strong><br />
Hong Kong. On July 1, 1997, Hong Kong reverted to<br />
56. The <strong>Water</strong> <strong>and</strong> <strong>Wastewater</strong> <strong>Market</strong> in Brazil, Canada, Department<br />
of Foreign Affairs <strong>and</strong> International Trade, 1999.
Chinese sovereignty under the concept of “one country,<br />
two systems” <strong>and</strong>, as a Special Administrative Region, is<br />
run with a high degree of autonomy.<br />
<strong>Market</strong> Overview<br />
<strong>Water</strong> supply <strong>and</strong> wastewater treatment are presently<br />
top priorities of China’s environmental protection <strong>and</strong><br />
infrastructure development policies. <strong>Water</strong> shortages,<br />
caused by uneven distribution, inefficient use, <strong>and</strong> contamination<br />
of water resources, affect approximately 400<br />
cities in China. Thirty cities, including Beijing, are expected<br />
to face long-term water shortages.<br />
Ambient water quality has deteriorated dramatically<br />
due to the phenomenal growth in industrial development<br />
over the last two decades, lack of enforcement of environmental<br />
st<strong>and</strong>ards, poor treatment of industrial effluents,<br />
<strong>and</strong> inadequate investments in infrastructure.<br />
Presently, in urban areas, less than 20 percent of wastewater<br />
is treated, <strong>and</strong> close to 90 percent of urban drinking<br />
water sources are polluted to some degree. 57 China<br />
has committed to continue its efforts to improve water<br />
supply <strong>and</strong> sanitation. The government has set a target<br />
of a 40 percent treatment rate for sewage by 2010. This<br />
will require approximately $24 to $36 billion, excluding<br />
operating costs. 58<br />
In Hong Kong, water pollution from sewage <strong>and</strong> industrial<br />
wastewater discharges is the most visible environmental<br />
concern. Roughly 10 percent of wastewater<br />
receives biological treatment before discharge, 40 percent<br />
receives partial treatment, <strong>and</strong> the remaining 50 percent<br />
is discharged into the sea without any treatment. 59<br />
Under China’s Ninth Five-Year <strong>Plan</strong> (1996–2000), the<br />
clean-up of three lakes (Tai, Chao, <strong>and</strong> Dianchi) <strong>and</strong> three<br />
rivers (Huai, Hai, <strong>and</strong> Liao) were top priorities of the<br />
state economic development policy. The clean-up effort<br />
achieved some positive results. However, the construction<br />
of 131 new municipal wastewater treatment plants<br />
has yet to begin, <strong>and</strong> 535 industrial plants have to install<br />
effluent treatment systems. 60<br />
China’s water <strong>and</strong> wastewater technologies market is<br />
enormous—over $5.3 billion in 1999. Even though most<br />
of the market dem<strong>and</strong> is covered by local production, the<br />
import market alone amounts, according to the U.S. Commercial<br />
Service, to almost $2 billion a year.<br />
57. The Environmental Industries <strong>Market</strong> in China, Canada, Department<br />
of Foreign Affairs <strong>and</strong> International Trade, 2001.<br />
58. China Environmental <strong>Technologies</strong> <strong>Export</strong> <strong>Market</strong> <strong>Plan</strong>, U.S. Department<br />
of Commerce, International Trade Administration, 2002.<br />
59. The Environmental Industries <strong>Market</strong> in Hong Kong, Canada,<br />
Department of Foreign Affairs <strong>and</strong> International Trade, 2001.<br />
60. The Environmental Industries <strong>Market</strong> in China, Canada, Department<br />
of Foreign Affairs <strong>and</strong> International Trade, 2001.<br />
Table 4.5. Estimated Size of the <strong>Water</strong> <strong>and</strong> <strong>Wastewater</strong><br />
<strong>Technologies</strong> <strong>Market</strong> in China, 1999 (millions of U.S.<br />
dollars)<br />
Total Growth Rate,<br />
Local <strong>Market</strong> 2000–2001<br />
Production Imports Size (percent)<br />
<strong>Water</strong> treatment<br />
<strong>and</strong> supply<br />
<strong>Wastewater</strong><br />
1,506 646 2,152 35%<br />
treatment 1,911 1,273 3,184 25%<br />
Total 3,417 1,919 5,336<br />
Sources: China: “<strong>Water</strong> Treatment <strong>and</strong> Supply” <strong>and</strong> “China: <strong>Wastewater</strong><br />
Treatment <strong>Technologies</strong>,” Industry Sector Analyses, U.S. <strong>and</strong><br />
Foreign Commercial Service <strong>and</strong> U.S. Department of State, 1998.<br />
The size of the market for water <strong>and</strong> wastewater technologies<br />
is enormous <strong>and</strong> the scope of the country’s water<br />
<strong>and</strong> wastewater projects is gargantuan. For example,<br />
the Chinese government has committed to a plan to transfer<br />
water to the parched north from the wet southern regions.<br />
In 2001, the PRC government has committed to a<br />
schedule to make this South-North <strong>Water</strong> Transfer project<br />
a reality. Three transfer channels will be constructed, the<br />
first two in the east <strong>and</strong> in the center. The eastern route<br />
will be completed by 2010 with a total cost of $7.25 billion.<br />
Phase I of the construction of the central route will<br />
be completed by 2010. The total cost of this effort will<br />
be approximately $10 billion. The western route is still<br />
in the early planning phases.The government has stressed<br />
that this project is to be linked with enhanced efforts to<br />
increase water use efficiency, prevent pollution, <strong>and</strong><br />
charge appropriate water prices. 61<br />
Regulatory <strong>and</strong> Institutional Framework<br />
China’s State Environmental Protection Agency is responsible<br />
for drafting <strong>and</strong> interpreting national environmental<br />
laws <strong>and</strong> regulations. As part of the 1998<br />
government reorganization, the agency was upgraded to<br />
full ministerial rank. Responsibility for enforcement rests<br />
with provincial <strong>and</strong> local Environmental Protection Bureaus.<br />
Responsibility for water management in China is<br />
divided among several ministries, including the Ministry<br />
of <strong>Water</strong> Resources <strong>and</strong> the Ministry of Construction.<br />
<strong>Water</strong> <strong>and</strong> wastewater utilities are run by municipalities<br />
under the direction of provincial <strong>and</strong> municipal <strong>Plan</strong>ning<br />
Commissions.<br />
China is implementing a national “one control, two<br />
st<strong>and</strong>ards” policy, which requires provinces to set limits<br />
61. Issues Surrounding China’s South-North <strong>Water</strong> Transfer Project,<br />
U.S. Embassy, Beijing, April 2001.<br />
<strong>Water</strong> <strong>and</strong> <strong>Wastewater</strong> <strong>Export</strong> <strong>Market</strong> <strong>Plan</strong><br />
35
on the volume of discharges <strong>and</strong> meet industrial effluent<br />
st<strong>and</strong>ards.<br />
In general, the responsibility <strong>and</strong> power of local authorities<br />
seems to be increasing. Key cities are required<br />
to meet water quality st<strong>and</strong>ards. The 1984 Clean <strong>Water</strong><br />
Law was amended in 1996, requiring all cities with populations<br />
over 250,000 to build municipal wastewater treatment<br />
plants. The amendments also required industries<br />
to pay a “pollution discharge fee” for their effluents.<br />
Although the environmental regulatory framework is<br />
comprehensive, enforcement remains a problem because<br />
laws established by the central agency are supposed to<br />
be enforced by local governments, which are often reluctant,<br />
for political, economic, <strong>and</strong> social reasons, to<br />
penalize industries within their jurisdiction. There is evidence,<br />
however, that this is changing. For example, late<br />
last year in the Huai River area, over 1,000 businesses<br />
were forced to close for noncompliance.<br />
In 1997, the State Development <strong>and</strong> <strong>Plan</strong>ning Commission<br />
approved policies concerning water conservation.<br />
The policies defined the functions of the central <strong>and</strong><br />
local governments in water resource management. Investment<br />
from the central government is earmarked for construction<br />
of large-scale, inter-provincial infrastructure<br />
projects. Inter-basin <strong>and</strong> local projects should be financed<br />
through local budgets <strong>and</strong> commercial channels.<br />
One of the largest constraints to the development of<br />
the Chinese water <strong>and</strong> wastewater market is the lack of<br />
market pricing for water. High government subsidies for<br />
water have meant that water is supplied to consumers at<br />
a loss, resulting in a lack of return on investments in water<br />
projects for both local <strong>and</strong> foreign investors. In 1998,<br />
China’s State Council required a three-year timetable for<br />
water price market reform. As a result, the price of water<br />
for agricultural use will likely triple in the near future.<br />
Urban <strong>and</strong> industrial users will also face increases.<br />
Between 1996 <strong>and</strong> 1998 alone, the residential water rate<br />
in Beijing doubled to 1 RMB per ton. However, it is estimated<br />
that the true cost of water is actually 5 RMB per<br />
ton. 62<br />
The State Development <strong>and</strong> <strong>Plan</strong>ning Commission<br />
addressed wastewater treatment pricing in its 1999 Notice<br />
on Increasing <strong>Wastewater</strong> Fees <strong>and</strong> Establishing an<br />
Urban <strong>Wastewater</strong> Treatment System. This rule states that<br />
wastewater treatment fees shall be based on operation<br />
<strong>and</strong> maintenance costs of wastewater treatment plants.<br />
Urban public utility bureaus will be responsible for collection.<br />
Prices have been increased subsequently. 63<br />
62. “Beijing Residential <strong>Water</strong> Rate is 1 RMB per Ton,” Beijing<br />
Wanbao (September 10, 1998), 1.<br />
63. China Environmental <strong>Export</strong> <strong>Market</strong> <strong>Plan</strong>, U.S. Department of<br />
Commerce, International Trade Administration, 2002.<br />
36 U.S. Department of Commerce, International Trade Administration<br />
Privatization<br />
Growth rates in different industrial sectors continue<br />
to shift the composition of the economy from the public<br />
to the private sector. The government has made serious<br />
efforts to downsize the large state sector <strong>and</strong> many stateowned<br />
enterprises have been sold or closed. However,<br />
the current policy of administrative price controls is at<br />
odds with the goal of achieving greater economic efficiency<br />
through market-oriented reforms. Recent contracts<br />
in water supply indicate that there are opportunities in<br />
BOT schemes (see the section on market opportunities).<br />
However, foreign exchange guarantees are not readily<br />
available <strong>and</strong> operators often bear all foreign currency<br />
risks. The State Development <strong>and</strong> <strong>Plan</strong>ning Commission<br />
stipulated that “the government will not provide a direct<br />
guarantee for the project return rate. Neither China’s stateowned<br />
financial nor non-financial institutions are allowed<br />
to provide direct guarantee to the project contractor.” In<br />
1998, the People’s Bank of China further tightened control<br />
over the guarantee issue in response to the Asian financial<br />
crisis. 64<br />
The Hong Kong government is looking to privatize<br />
water treatment operations over the next five years. A<br />
feasibility study is currently underway to assess the different<br />
privatization models <strong>and</strong> evaluate which would be<br />
best suited for Hong Kong’s market conditions.<br />
Trade <strong>and</strong> Investment Policy<br />
China is currently negotiating entry into the WTO,<br />
which would recognize its role as a major trading nation.<br />
Membership would require China to revise <strong>and</strong> reduce<br />
most of its trade barriers. Presently, import tariff<br />
rates are divided into two categories: the general tariff<br />
<strong>and</strong> the minimum or Most Favored Nation tariff. Imports<br />
from the U.S. are assessed at the minimum tariff rate due<br />
to an agreement between the two countries that contains<br />
reciprocal preferential tariff clauses. There is a 14 to 30<br />
percent duty on imports of environmental products, with<br />
the highest duties imposed on water filtering <strong>and</strong> purifying<br />
machinery. 65 Five Special Economic Zones (Dalian,<br />
Tianjin, Shanghai, Guanzhou, <strong>and</strong> Hainan), open cities,<br />
<strong>and</strong> foreign trade zones offer preferential duty reduction<br />
or exemption.<br />
A common problem faced by many U.S. firms that<br />
have entered the Chinese market is the inconsistent ap-<br />
64. “China: <strong>Water</strong> Treatment <strong>and</strong> Supply,” International <strong>Market</strong> Insight,<br />
U.S. <strong>and</strong> Foreign Commercial Service <strong>and</strong> U.S. Department of<br />
State, 1999.<br />
65. “China: <strong>Wastewater</strong> Treatment in Guangdong,” Industry Sector<br />
Analysis, U.S. <strong>and</strong> Foreign Commercial Service <strong>and</strong> U.S. Department<br />
of State, 2000.
plication of import regulations. In customs procedures,<br />
it is not uncommon for the same product to be subject to<br />
different levies in different ports, as they each add to the<br />
basic import tariff the local jurisdiction’s own administrative<br />
<strong>and</strong> miscellaneous fees. This creates uncertainty<br />
in the calculation of export costs <strong>and</strong> impedes the establishment<br />
of consistent, long-term commercial ties.<br />
China also administers a complex system of non-tariff<br />
trade barriers that include import licensing, quotas,<br />
<strong>and</strong> administration controls such as import registration.<br />
The United States is putting considerable pressure on<br />
China to reduce tariffs, phase out non-tariff import restrictions,<br />
publicize all trade-related regulations, <strong>and</strong><br />
grant unconditional national treatment to foreign investors<br />
as a prerequisite of its accession to the WTO.<br />
China has opened a number of sensitive sectors to investment<br />
on an experimental <strong>and</strong> limited basis <strong>and</strong> has<br />
introduced new incentives for foreign investors designed<br />
to modernize Chinese industry. Most of the investment<br />
has been in the coastal regions of the five Special Economic<br />
Zones <strong>and</strong> now in the western portions of the<br />
country.<br />
The government continues to pursue reforms in foreign<br />
exchange controls, taxation, foreign trade, <strong>and</strong> state<br />
enterprise restructuring that affect the foreign investment<br />
climate. In 1996, China announced full convertibility of<br />
its currency on the current account <strong>and</strong> instituted new,<br />
more liberal regulations allowing both domestic enterprises<br />
<strong>and</strong> those backed by foreign investment to freely<br />
convert currencies for current account transactions.<br />
However, China’s restrictive foreign trade <strong>and</strong> investment<br />
regulations deny foreign companies national treatment<br />
in almost all industry <strong>and</strong> service sectors. There is<br />
also a general lack of transparency <strong>and</strong> inconsistent enforcement<br />
with regard to China’s legal <strong>and</strong> regulatory<br />
system, which leads to ambiguities <strong>and</strong> excessive bureaucratic<br />
influence. Although it is at the discretion of procuring<br />
government agencies to determine their own<br />
suppliers <strong>and</strong> forms of procurement, a number of project<br />
types must first get approval from the central government.<br />
These include public construction projects exceeding<br />
$9 million (which would include all water <strong>and</strong><br />
wastewater infrastructure projects), <strong>and</strong> foreign enterprises<br />
or joint ventures that exceed $45 million. This approval<br />
process may take a long time.<br />
In general, Chinese government procurement is highly<br />
centralized <strong>and</strong> is not known for being transparent. The<br />
U.S. State Department has noted that China’s procurement<br />
practices “have often not been consistent with open<br />
<strong>and</strong> competitive bidding <strong>and</strong>, for the most part, non-transparent.<br />
. . . All information, from solicitation to award,<br />
remains secret <strong>and</strong> is known only to companies involved<br />
or to officials in the planning <strong>and</strong> industrial ministries.” 66<br />
Tenders for projects funded by international organizations<br />
are usually openly announced, whereas most Chinese<br />
“government procurement is by invitation only.” This<br />
scheme is supposed to change under new regulations issued<br />
by the Chinese State Development <strong>Plan</strong>ning Commission<br />
in 1999.<br />
Foreign companies are currently not allowed to engage<br />
directly in distributing imported goods in mainl<strong>and</strong><br />
China, although this will change once China joins the<br />
WTO. Presently, foreign suppliers must either distribute<br />
their products through a Chinese agent, form a joint venture<br />
with a Chinese firm, or manufacture the goods locally.<br />
Each region has its individual distribution<br />
requirements, so hiring multiple agents is essential.<br />
Hong Kong is a free port <strong>and</strong> does not impose any<br />
customs tariff on imports, has no tariff quota or surcharge,<br />
<strong>and</strong> no value-added or general services taxes. Public sector<br />
procurement in Hong Kong complies with the WTO’s<br />
Agreement on Government Procurement.<br />
U.S. <strong>Market</strong> Share <strong>and</strong> Competition<br />
There are currently about 32,000 water equipment<br />
manufacturing companies in China <strong>and</strong> that number is<br />
increasing. Although most of these companies produce<br />
low-quality, unsophisticated technologies, domestic production<br />
should not be underestimated. Domestic suppliers<br />
now h<strong>and</strong>le approximately two-thirds of the market.<br />
One of the largest environmental firms in Beijing currently<br />
supplies 50 percent of the wastewater market in<br />
the city, while its branch office in Shenzhen covers 90<br />
percent of the market there. 67 Domestic production will<br />
continue to increase for a number of reasons. One of them<br />
is China’s desire to become self-sufficient in the area of<br />
environmental technologies. Another is that small enterprises<br />
are moving into the market because of the opportunities<br />
presented by increased government funding.<br />
In 1997, the U.S. had the third-largest import share in<br />
both the water supply <strong>and</strong> wastewater treatment markets<br />
(at 11 percent <strong>and</strong> 12 percent, respectively), after Japan<br />
<strong>and</strong> Germany (see Figure 4.3). The U.S. wastewater technology<br />
industry already has a strong presence in the filter<br />
technology market, supplying over 60 percent of<br />
66. FY 2001 Country Commercial Guide: China, U.S. Department of<br />
State <strong>and</strong> U.S. <strong>and</strong> Foreign Commercial Service (prepared by the U.S.<br />
Embassy, Beijing), July 2000.<br />
67. “China: <strong>Wastewater</strong> Treatment <strong>Technologies</strong>,” Industry Sector<br />
Analysis, U.S. <strong>and</strong> Foreign Commercial Service <strong>and</strong> U.S. Department<br />
of State, 1998.<br />
<strong>Water</strong> <strong>and</strong> <strong>Wastewater</strong> <strong>Export</strong> <strong>Market</strong> <strong>Plan</strong><br />
37
Figure 4.3. Import <strong>Market</strong> Shares for <strong>Water</strong> <strong>and</strong> <strong>Wastewater</strong> <strong>Technologies</strong> in China<br />
Germany<br />
15%<br />
Other<br />
Countries<br />
18%<br />
France<br />
7%<br />
United States<br />
11%<br />
<strong>Water</strong> Supply<br />
Italy 7%<br />
Taiwan<br />
7%<br />
Japan<br />
28%<br />
South<br />
Korea<br />
17%<br />
Source: Canada, Department of Foreign Affairs <strong>and</strong> International Trade, The Environmental <strong>Market</strong> in China (Ottawa, 2001).<br />
wastewater filters in China. 68 However, it is critical to<br />
remember that competition is fierce.<br />
Cost is the primary inhibitor for importing U.S. water<br />
<strong>and</strong> wastewater technology into China. While U.S. technologies<br />
are acknowledged to be of superb quality, Chinese<br />
buyers are often more concerned with financing <strong>and</strong><br />
price. Grants from foreign governments strongly affect<br />
Chinese end users’ purchasing decisions. Japan <strong>and</strong> many<br />
European governments often provide low-interest soft<br />
loans with extended repayment terms to help finance their<br />
countries’ technology exports, giving them a major advantage<br />
over U.S. firms.<br />
U.S. competitors are very active in China’s emerging<br />
BOT market. The 18-year concession in Chengdu<br />
(Sichuan Province) was awarded in 1998 to the consortium<br />
of Vivendi (France) <strong>and</strong> Marubeni Company (Japan).<br />
69 In 1997, ONDEO was awarded a 30-year BOT<br />
contract for a 450,000 m 3 /day drinking water treatment<br />
plant in Shenyang, the capital of Liaoning Province.<br />
ONDEO also got a similar contract for a 500,000 m 3 /<br />
day drinking water treatment plant in Guangzhou<br />
(Guangdong Province), <strong>and</strong> smaller contracts in Gaozhou<br />
(Guangdong Province) <strong>and</strong> Nachang (Jiangxi Province).<br />
Another BOT concession (for 22.5 years) was awarded<br />
to a consortium of British companies, Bovis Construc-<br />
68. “China: <strong>Wastewater</strong> Treatment in Guangdong,” Industry Sector<br />
Analysis, U.S. <strong>and</strong> Foreign Commercial Service <strong>and</strong> U.S. Department<br />
of State, 2000.<br />
69. Ibid.<br />
United States<br />
12%<br />
38 U.S. Department of Commerce, International Trade Administration<br />
Other Countries<br />
18%<br />
Germany<br />
30%<br />
tion Group <strong>and</strong> Thames <strong>Water</strong>, to build a $73 million<br />
water treatment plant in a district of Shanghai. 70<br />
The first joint project between a U.S. company <strong>and</strong> a<br />
Chinese partner for the development of a municipal<br />
wastewater treatment plant was signed in 1999 between<br />
Lemna International <strong>and</strong> the Guangzhou Tunnel Development<br />
Authority. The project is estimated at $120 million.<br />
U.S. firms will supply $18 million worth of<br />
equipment exports <strong>and</strong> $2 million worth of environmental<br />
services. As the Guangzhou Municipality is looking<br />
to undertake 10 similar projects over the next few years,<br />
the signing of a U.S. firm for the first project creates a<br />
good precedent for other U.S. companies.<br />
The notion of guanxi (relationships) is very important<br />
to any kind of venture in China. U.S. companies must be<br />
willing to develop close relationships with their Chinese<br />
partners, as well as local governments. Good personal<br />
relationships are often the most critical success factor.<br />
<strong>Market</strong> Opportunities<br />
<strong>Wastewater</strong> Treatment<br />
Japan<br />
40%<br />
Responding to the country’s serious water resource<br />
problems, the World Bank <strong>and</strong> the Asian Development<br />
Bank have dramatically increased their funding in China<br />
on water infrastructure projects, creating significant com-<br />
70. “Global Environmental <strong>Market</strong>s 2000.” Environmental Business<br />
Journal, vol. XII, no. 9/10, 2000.
mercial opportunities for U.S. firms. 71 In the past, projects<br />
funded by multilateral development banks presented opportunities<br />
for foreign companies in Eastern China. As<br />
the Chinese government has shifted its focus to promoting<br />
development of the western provinces, so have the<br />
World Bank <strong>and</strong> the Asian Development Bank. An estimated<br />
$1.26 billion worth of water supply <strong>and</strong> wastewater<br />
management projects are currently underway or in<br />
preparation. (As noted above, large projects funded by<br />
international organizations are often more transparent<br />
than those funded solely by the Chinese government.)<br />
The following are just some of the water <strong>and</strong> wastewater<br />
projects in China funded through World Bank or<br />
Asian Development Bank loans (see Appendix A for more<br />
details on these <strong>and</strong> other ongoing <strong>and</strong> forthcoming multilateral<br />
development bank projects):<br />
• Beijing Environmental Protection Project (World<br />
Bank). Among the goals of the second phase of this<br />
project is to improve the city’s sewage collection <strong>and</strong><br />
treatment system.<br />
• Sh<strong>and</strong>ong Environment Project (World Bank).<br />
The project focuses on wastewater management <strong>and</strong><br />
efficient use of water resources in the city of Jinan,<br />
Sh<strong>and</strong>ong province.<br />
• Hubei Urban Environmental Project (World<br />
Bank). The goal of this $223 million project is to<br />
improve water quality in the urban areas of the mid-<br />
Yangtze River basin by constructing interseptor<br />
sewer systems <strong>and</strong> wastewater treatment facilities.<br />
• Chongqing Industrial Reform <strong>and</strong> Pollution<br />
Control Program (World Bank). This long-term<br />
program for water resource management includes<br />
construction of wastewater treatment plants as well<br />
as upgrading water supply <strong>and</strong> distribution systems.<br />
• Liao River Basin Project (World Bank). The<br />
investment component of this river basin pollution<br />
cleanup project is expected to include water supply<br />
<strong>and</strong> wastewater management.<br />
• Huai River Basin Pollution Control Project<br />
(World Bank). The project will help local governments<br />
in the Anhui <strong>and</strong> Sh<strong>and</strong>ong provinces develop<br />
<strong>and</strong> finance municipal pollution control investments.<br />
• Tianjin <strong>Wastewater</strong> Treatment <strong>and</strong> <strong>Water</strong> Resource<br />
Protection Project (Asian Development<br />
Bank). The $300 million project includes the construction<br />
of Beicang wastewater treatment facilities<br />
71. However, loans are capable of supplying a mere 15 percent of the<br />
funding requirements, making the lack of hard currency financing an<br />
important constraint to accessing China’s water <strong>and</strong> wastewater<br />
market.<br />
<strong>and</strong> implementation of a water resource protection<br />
scheme for the Luan-Tianjin diversion system.<br />
• Suzhou Creek Rehabilitation Program (Asian<br />
Development Bank). The $445 million effort includes<br />
improving sewage treatment systems, treating<br />
contaminated sediments, <strong>and</strong> introducing water<br />
resource management <strong>and</strong> quality control methods.<br />
• Hai <strong>and</strong> Luan <strong>Wastewater</strong> Program (Asian<br />
Development Bank). The objective of this $900<br />
million program is to improve water quality in one<br />
of three river basins on the Chinese government’s<br />
priority list.<br />
Public authorities continue to be the main end-users<br />
of water <strong>and</strong> wastewater technologies <strong>and</strong> services in<br />
China. As domestic Chinese firms are strong in smallscale<br />
wastewater treatment technology projects, the best<br />
market for U.S. water <strong>and</strong> wastewater treatment equipment<br />
is in large <strong>and</strong> medium-sized municipal facilities.<br />
The greatest dem<strong>and</strong> is for low-cost but highly efficient<br />
systems, including aerators, pumps, valves, sludge scrapers<br />
<strong>and</strong> mixers, disinfecting equipment <strong>and</strong> chemical<br />
agent production equipment, water quality monitoring<br />
<strong>and</strong> automatic control systems, dewatering machines, <strong>and</strong><br />
various kinds of pipes.<br />
In the industrial wastewater treatment market, the best<br />
opportunities exist in the pharmaceutical, food processing,<br />
fish farming, paper, textile, paint, chemical, <strong>and</strong> fertilizer<br />
industries. These industry sectors are the main<br />
targets of the “three lakes, three rivers” government program.<br />
There are also opportunities with large multinational<br />
companies working in China, many of which are<br />
complying with higher, worldwide corporate environmental<br />
st<strong>and</strong>ards.<br />
In addition, there is an exp<strong>and</strong>ing market for smaller<br />
water <strong>and</strong> wastewater facilities in rural areas. For example,<br />
Phase II of the Chongqing Urban Environmental<br />
Management Project includes an emphasis on provision<br />
of infrastructure to rural communities.<br />
Some of the better equipment sales prospects in China<br />
are water monitoring instruments, drinking water purification<br />
systems, industrial wastewater treatment equipment,<br />
<strong>and</strong> resource recovery technologies. 72<br />
The Hong Kong government has designed a Strategic<br />
Sewage Disposal Scheme, an ambitious plan to link major<br />
urban developments around Victoria Harbor to new<br />
sewage treatment facilities. The various options for ultimate<br />
disposal of sewage from the metropolitan area are<br />
72. FY 2001 Country Commercial Guide: China, U.S. Department of<br />
State <strong>and</strong> U.S. <strong>and</strong> Foreign Commercial Service (prepared by the U.S.<br />
Embassy, Beijing), July 2000.<br />
<strong>Water</strong> <strong>and</strong> <strong>Wastewater</strong> <strong>Export</strong> <strong>Market</strong> <strong>Plan</strong><br />
39
currently being reviewed. The project’s total cost is estimated<br />
at $5.2 billion. 73<br />
While Hong Kong by itself represents a strong market<br />
for wastewater equipment, it is also a gateway to the<br />
enormous mainl<strong>and</strong> China market. Hong Kong remains<br />
China’s largest port <strong>and</strong> the entry point for most of<br />
China’s imports, particularly goods exported by small <strong>and</strong><br />
medium-sized enterprises.<br />
U.S. water <strong>and</strong> wastewater equipment <strong>and</strong> technology<br />
are seen as being high quality <strong>and</strong> cutting edge. However,<br />
it is also often more expensive than competitors’<br />
equipment <strong>and</strong> technology. The best sales prospects are<br />
in the areas of water monitoring equipment, home water<br />
filtration systems, <strong>and</strong> turnkey solutions to large-scale<br />
water treatment problems.<br />
Egypt<br />
Population: 68 million (2000)<br />
Urban population: 45 percent (2000)<br />
GNP per capita: $1,400 (1999)<br />
GDP average annual growth rate: 4.2 percent (1990-1998)<br />
<strong>Water</strong> supply coverage (urban/rural): 96 percent/<br />
94 percent (2000)<br />
Sanitation coverage (urban/rural): 98 percent/<br />
91 percent (2000)<br />
<strong>Market</strong> Overview<br />
The Nile is the source for more than 95 percent of<br />
Egypt’s water, supplying a large population, a burgeoning<br />
industrial base, <strong>and</strong> over seven million acres of highly<br />
productive irrigated l<strong>and</strong>s. The Nile is also the ultimate<br />
recipient of Egypt’s wastewater. A rapidly exp<strong>and</strong>ing<br />
population <strong>and</strong> the disposal of untreated wastes are putting<br />
increased dem<strong>and</strong>s on the country’s water supply.<br />
Only large cities such as Cairo <strong>and</strong> Alex<strong>and</strong>ria provide<br />
treated drinking water to all of their residents. Existing<br />
surface water filtration plants use conventional<br />
water treatment plant processes consisting of pre-chlorination,<br />
aluminum sulfate coagulation/flocculation, sedimentation,<br />
rapid s<strong>and</strong> filtration, <strong>and</strong> post-chlorination.<br />
The municipal water supply is often unreliable, particularly<br />
in rural areas. The distribution system cannot satisfy<br />
peak dem<strong>and</strong>s, <strong>and</strong>, in some cases, water has to be<br />
rationed.<br />
Approximately 40 of 60 Egyptian cities have sewerage<br />
systems connected to existing (or under construction)<br />
73. The Environmental Industries <strong>Market</strong> in Hong Kong, Canada,<br />
Department of Foreign Affairs <strong>and</strong> International Trade, 2001.<br />
40 U.S. Department of Commerce, International Trade Administration<br />
primary or secondary treatment plants, which provides<br />
70 percent of the urban population with access to some<br />
kind of sanitation services. However, 85 percent of the<br />
total load of municipal sewage receives little or no treatment.<br />
In rural areas, the overwhelming majority of the<br />
population does not have access to either sewer systems<br />
or treatment facilities. The rural population uses on-site<br />
disposal systems—leaching pits, septic tanks adjacent to<br />
houses, or direct discharges of raw sewage to drains <strong>and</strong><br />
canals. The disposal of untreated sewage creates a threat<br />
to public health <strong>and</strong> the environment.<br />
Industrial wastewater discharges are considered one<br />
of the major sources of water pollution in Egypt. The<br />
major wastewater dischargers in Greater Cairo are metallurgical,<br />
sugar, <strong>and</strong> chemical industries. Large sources<br />
of effluents in Alex<strong>and</strong>ria are the pulp <strong>and</strong> paper, chemical,<br />
metallurgical, <strong>and</strong> textile industries. Industrial wastewater<br />
is either discharged directly into the waterways (for<br />
example, in the cities of Suez, Port Said, Ismailia) or<br />
through municipal systems which discharge into the Nile<br />
<strong>and</strong> its canals. Over 80 percent of industrial discharges<br />
do not receive any treatment. Industrial wastewater<br />
dumped into public sewers without pretreatment causes<br />
damage to sewerage systems through corrosion or by inhibiting<br />
biological processes.<br />
In 1998, the total market for water <strong>and</strong> wastewater<br />
technologies in Egypt was $856 million <strong>and</strong> growing at<br />
an average rate of 10 percent a year. Imports comprised<br />
over 90 percent of the market. 74<br />
Regulatory <strong>and</strong> Institutional Framework<br />
<strong>Wastewater</strong> discharges in Egypt are regulated by<br />
Law 93 of 1962 (<strong>and</strong> its Executive Regulations,<br />
Decree 649 of 1962) <strong>and</strong> Law 48 of 1982 (<strong>and</strong> its<br />
Executive Regulations, Decree 8 of 1983). Law 48 prohibits<br />
the discharge of untreated wastewater into groundwater<br />
<strong>and</strong> surface waters used as sources of potable water.<br />
Discharges of treated wastewater into a waterway require<br />
a license from the Ministry of Public Works <strong>and</strong> <strong>Water</strong><br />
Resources. Decree 8/1983 contains discharge st<strong>and</strong>ards<br />
for treated industrial <strong>and</strong> municipal wastewater to be discharged<br />
into potable <strong>and</strong> non-potable surface waters <strong>and</strong><br />
groundwater.<br />
Industries in Egypt are required to discharge their<br />
wastewater into public sewers, except when they are located<br />
outside the coverage area. Decree 649 lists the types<br />
of industrial establishments that need licenses to discharge<br />
wastewater into public sewers <strong>and</strong> the st<strong>and</strong>ards<br />
they must adhere to.<br />
74. Egypt: <strong>Water</strong> Resources Equipment, Industry Sector Analysis, U.S.<br />
Foreign <strong>and</strong> Commercial Service <strong>and</strong> U.S. Department of State, 1998.
At the national level, Law 4 of 1994 designates the<br />
Egyptian Environmental Affairs Agency (EEAA) as the<br />
overall national environmental coordination <strong>and</strong> supervision<br />
authority. In addition to the EEAA, many sectoral<br />
ministries exercise environmental management responsibilities.<br />
The responsibilities of the relevant government<br />
agencies in the water sector are summarized below:<br />
• The EEAA coordinates with the appropriate authorities<br />
to issue <strong>and</strong> enforce licenses for projects in the<br />
coastal zone.<br />
• The Ministry of Health sets drinking water st<strong>and</strong>ards,<br />
industrial <strong>and</strong> municipal discharge st<strong>and</strong>ards<br />
<strong>and</strong> monitors the quality of drinking water sources<br />
<strong>and</strong> drinking water quality.<br />
• The Ministry of Housing, Utilities, <strong>and</strong> New Communities<br />
(MHUNC) designs <strong>and</strong> constructs water<br />
supply <strong>and</strong> treatment systems, sewerage <strong>and</strong> sewage<br />
treatment facilities, issues <strong>and</strong> enforces licenses for<br />
discharges to public sewers, <strong>and</strong> enforces relevant<br />
discharge st<strong>and</strong>ards.<br />
• The Ministry of Public Works <strong>and</strong> <strong>Water</strong> Resources<br />
(MPWWR) issues <strong>and</strong> enforces licenses for discharges<br />
to surface waters <strong>and</strong> groundwater, enforces<br />
relevant discharge st<strong>and</strong>ards, <strong>and</strong> monitors ambient<br />
water quality.<br />
• The Ministry of Interior’s <strong>Water</strong> Police Force<br />
controls pollution of inl<strong>and</strong> waters <strong>and</strong> coastal areas.<br />
Enforcement of environmental regulations has been<br />
poor <strong>and</strong> inconsistent. Enforcement responsibilities are<br />
generally divided between the EEAA <strong>and</strong> the sectoral<br />
ministries. The level of enforcement depends on the<br />
power of responsible authorities <strong>and</strong> the willingness of<br />
officials in the governorates (provinces) <strong>and</strong> municipal<br />
governments to cooperate with these enforcers.<br />
High rates of unemployment make the government a<br />
reluctant enforcer where enterprise shut-down is widely,<br />
though mistakenly, understood as the only enforcement<br />
option available. Furthermore, the fact that the EEAA is<br />
not the only enforcement agency complicates enforcement<br />
efforts. Since the regulations have been enacted,<br />
the Egyptian government realizes that enforcement is<br />
costly <strong>and</strong> technically complex. The government intends,<br />
therefore, to focus first on major polluters <strong>and</strong> assist them<br />
in moving toward compliance, while developing a longterm<br />
monitoring <strong>and</strong> enforcement program.<br />
Overall, Egypt’s environmental regulatory <strong>and</strong> institutional<br />
framework suffers from:<br />
• the lack of effective operational strategies;<br />
• redundancies <strong>and</strong> fragmentation of responsibilities<br />
between the EEAA, sectoral ministries, governorates,<br />
<strong>and</strong> municipal authorities;<br />
• weak monitoring capacity at the national <strong>and</strong> local<br />
level; <strong>and</strong><br />
• limited technical, management, <strong>and</strong> enforcement<br />
capabilities to address the major environmental<br />
issues of the country.<br />
Privatization<br />
In the 1990s, the Egyptian government launched a<br />
comprehensive Economic Reform <strong>and</strong> Structural Adjustment<br />
Program supported by the International Monetary<br />
Fund (IMF), the World Bank, <strong>and</strong> other international donors.<br />
As part of its reform program, the government is<br />
focusing on liberalizing its trade regime, encouraging<br />
private sector growth, <strong>and</strong> improving the investment<br />
climate.<br />
In 1996, the Egyptian government began to make<br />
progress toward selling off state-owned companies. It is<br />
considering offering concessions for water <strong>and</strong> wastewater<br />
utilities. For example, as part of its five-year plan<br />
(1998–2002), the government is planning to upgrade 150<br />
facilities so that they can be transferred to the private<br />
sector, as well as construct 12 new facilities for the new<br />
industrial cities through BOT arrangements.<br />
Trade <strong>and</strong> Investment Policy<br />
One of the key areas of Egypt’s economic policy reform<br />
has been trade liberalization. In 1995, Egypt joined<br />
the WTO. Egypt <strong>and</strong> the United States agreed in May<br />
1998 to begin talks on a Trade <strong>and</strong> Investment Framework<br />
Agreement (TIFA). The TIFA is expected to be an<br />
intermediary step before starting talks on a free trade area<br />
agreement at some future date. Egypt has been in negotiations<br />
with the European Union on an association agreement<br />
under the Mediterranean initiative since 1995. New<br />
import <strong>and</strong> export regulations adopted in January 1998<br />
reduced import duties <strong>and</strong> eliminated some non-tariff<br />
trade barriers. However, Egypt has yet to change many<br />
of its protectionist policies.<br />
The 1997 investment law reaffirms basic guarantees<br />
for investors <strong>and</strong> clarifies the framework for investment<br />
incentives. In an effort to improve coordination between<br />
the central government <strong>and</strong> the localities on investment<br />
issues, Egypt has also established investment offices in<br />
the governorates.<br />
However, Egypt has yet to reduce trade barriers <strong>and</strong><br />
eliminate unnecessary regulations <strong>and</strong> restrictions on<br />
business activities. Law 228/1997 reduces import duties<br />
on finished goods that have at least 30 percent local content,<br />
from an average of 50 percent to 45 percent. These<br />
reductions are part of the IMF-approved economic liberalization<br />
program <strong>and</strong> are meant to encourage invest-<br />
<strong>Water</strong> <strong>and</strong> <strong>Wastewater</strong> <strong>Export</strong> <strong>Market</strong> <strong>Plan</strong><br />
41
ments in local manufacturing. In addition to the import<br />
duty, a sales tax ranging from 5 percent to 25 percent is<br />
added to the final customs value of the imported item.<br />
The current tariff policies <strong>and</strong> structures do not give special<br />
treatment to environmental equipment.<br />
The domestic industry also remains protected by many<br />
non-tariff import barriers, including service fees <strong>and</strong> the<br />
m<strong>and</strong>atory product inspection list. In addition, administrative<br />
procedures regarding customs clearances appear<br />
to be causing unnecessary delays to bringing environmental<br />
equipment into the country. Egyptian customs<br />
authorities do not have to justify their decisions, <strong>and</strong> there<br />
is no formal appeals process. The customs procedures<br />
are subjective in determining whether a commodity fits<br />
in one tariff category or another, <strong>and</strong> experience has<br />
shown that the same commodity may be classified differently<br />
<strong>and</strong> consequently be subject to different tariff<br />
rates under different shipments.<br />
In FY 1999, the U.S. Congress reduced the amount of<br />
aid under the Egypt Economic Support Fund, with the<br />
objective of moving the U.S.-Egypt partnership from an<br />
aid-based relationship to more mature cooperation based<br />
on trade. Nonetheless, Egypt remains the world’s largest<br />
recipient of U.S. foreign assistance, with $695 million<br />
worth of aid expected in FY 2001.<br />
U.S. <strong>Market</strong> Share <strong>and</strong> Competition<br />
U.S. companies have a lead in Egypt’s water <strong>and</strong><br />
wastewater sector, mostly due to the large USAID procurements.<br />
The U.S. market share was about 35 percent<br />
in 1998. 75 French firms are the main competitors of U.S.<br />
suppliers of water supply equipment, while British companies<br />
have a high profile in the municipal wastewater<br />
treatment market. German <strong>and</strong> Italian firms are also active<br />
in this market.<br />
<strong>Market</strong> Opportunities<br />
USAID/Egypt operates the largest environmental program<br />
of all USAID missions. The United States is also<br />
by far the biggest donor for environmental initiatives in<br />
Egypt.<br />
Egypt’s water <strong>and</strong> wastewater sector represents enormous<br />
opportunities for U.S. equipment suppliers, mostly<br />
through direct USAID procurement. USAID’s water/<br />
wastewater program also supports the commercialization<br />
of water <strong>and</strong> wastewater management through private<br />
sector participation, including greater autonomy for utilities<br />
in planning, construction, <strong>and</strong> financial management,<br />
75. Ibid.<br />
42 U.S. Department of Commerce, International Trade Administration<br />
as well as an improved regulatory climate for private investment<br />
in the sector.<br />
Over the past 20 years, USAID has invested approximately<br />
$2.6 billion in Egypt’s water <strong>and</strong> wastewater infrastructure.<br />
76 The following are USAID/Egypt’s largest<br />
ongoing projects in this sector, all of which involve extensive<br />
procurement of U.S. equipment.<br />
Under the Secondary Cities Development project<br />
(1994–2002, $215 million), USAID is exp<strong>and</strong>ing water<br />
<strong>and</strong> wastewater infrastructure investments to reach the<br />
communities of Mansoura, Nuweiba, Luxor, <strong>and</strong> the<br />
Aswan group of Nasr City, Kom Ombo, <strong>and</strong> Darawo City.<br />
<strong>Water</strong> <strong>and</strong> wastewater treatment works include collection/distribution<br />
pipeline networks, pumping stations, <strong>and</strong><br />
storage tanks.<br />
Working with the General Organization for Sanitary<br />
Drainage of Alex<strong>and</strong>ria, USAID has invested $425 million<br />
in the design, construction, <strong>and</strong> start-up of a sewerage<br />
system for approximately 75 percent of the city since<br />
1978. The current Alex<strong>and</strong>ria <strong>Wastewater</strong> System Expansion<br />
II program (1998–2002, $90 million) will double<br />
the capacity of two treatment plants, upgrade the pumping<br />
stations, <strong>and</strong> improve the sludge disposal systems to<br />
accommodate the projected population growth. The Alex<strong>and</strong>ria<br />
Drinking <strong>Water</strong> initiative (1998–2002, $200<br />
million) will assist the Alex<strong>and</strong>ria <strong>Water</strong> General Authority<br />
in implementing its water supply <strong>and</strong> distribution systems<br />
master plan.<br />
The three newly formed Economic General Authorities<br />
for <strong>Water</strong> Supply <strong>and</strong> Sanitary Drainage in the governorates<br />
(provinces) of Fayoum, Beni Suef, <strong>and</strong> Minya<br />
are the partners in the Egypt Utilities Management program<br />
(1997–2004, $215 million) to provide water <strong>and</strong><br />
wastewater services for their residents.<br />
It should be noted that USAID’s assistance in Egypt<br />
is gradually moving away from infrastructure construction<br />
<strong>and</strong> technology demonstration in the water sector<br />
toward greater policy assistance to manage the systems<br />
created through past capital investments.<br />
Installation of new sewer <strong>and</strong> potable water systems,<br />
<strong>and</strong> rehabilitation of old water infrastructure are also<br />
major national government priorities in the 1998–2002<br />
five-year plan. The projects tentatively approved by the<br />
Egyptian government include:<br />
• Upgrading 1,000 existing compact water treatment<br />
units.<br />
• Constructing 500 new units of 2,000–5,000 m 3 /day<br />
capacity.<br />
• Upgrading 26 existing water treatment facilities,<br />
including major rehabilitation <strong>and</strong> repairs.<br />
76. USAID FY 2001 Program Description <strong>and</strong> Activity Data Sheet,<br />
U.S. Agency for International Development, 2001.
• Installation of 400–600 wastewater treatment units<br />
in rural areas (500–2,000 m 3 /day).<br />
The World Bank has recently launched a Middle East<br />
<strong>and</strong> North Africa <strong>Water</strong> Partnership program that is designed<br />
to energize <strong>and</strong> harmonize government <strong>and</strong> donor<br />
efforts in the water <strong>and</strong> wastewater sector. Ultimately,<br />
it will increase overall investment in this sector by 200<br />
to 300 percent. The program will facilitate investment<br />
from government, donor, <strong>and</strong> private sector sources for<br />
rehabilitation <strong>and</strong> expansion of water distribution <strong>and</strong><br />
transfer networks; expansion of wastewater collection <strong>and</strong><br />
treatment systems; <strong>and</strong> protection of water quality.<br />
There are opportunities in the municipal wastewater<br />
market for foreign companies in environmental engineering<br />
<strong>and</strong> design of new treatment systems, sales of equipment<br />
for pump stations <strong>and</strong> wastewater treatment plants,<br />
<strong>and</strong>, possibly, operation <strong>and</strong> maintenance contracts for<br />
secondary treatment facilities. For joint ventures between<br />
foreign <strong>and</strong> local companies, there are opportunities to<br />
construct/exp<strong>and</strong> new sewerage systems, to manufacture<br />
<strong>and</strong> sell components for compact wastewater treatment<br />
facilities, <strong>and</strong> to manufacture <strong>and</strong> sell PVC pipes <strong>and</strong><br />
valves. There may also be opportunities for the operation<br />
<strong>and</strong> maintenance of existing water <strong>and</strong> wastewater<br />
facilities.<br />
In the water supply <strong>and</strong> treatment market segment, attractive<br />
business opportunities include sales of compact<br />
water treatment units, air blowers, filters, boosters, chemicals,<br />
pipes, valves, <strong>and</strong> turbines. Egypt is also one of the<br />
largest water pump markets in the world. Imports of water<br />
pumps in Egypt totaled $100 million in 1999 <strong>and</strong> the<br />
market is expected to grow over the next few years by<br />
15 percent annually. 77 The public sector’s market share<br />
of imported water pumps is 70 percent. In the water <strong>and</strong><br />
wastewater market, the best sales prospects for pumps<br />
are for horizontal end-suction water pumps, split case<br />
water pumps, <strong>and</strong> feed water boiler pumps.<br />
Most of the money for imports of U.S.-manufactured<br />
industrial wastewater treatment equipment is likely to<br />
come from Egyptian private-sector industries, since<br />
grants are generally not available in this market segment.<br />
The World Bank has established a $39 million Pollution<br />
Abatement Fund under the Egypt Pollution Abatement<br />
Project to finance environmental investments through<br />
local commercial banks. To qualify, the Egyptian firms<br />
must be financially viable existing public <strong>and</strong> private<br />
enterprises. The eligible projects are investments in pollution<br />
prevention <strong>and</strong> effluent pre-treatment.<br />
77. “Egypt: <strong>Water</strong> Pumps <strong>Market</strong>,” International <strong>Market</strong> Insight, U.S.<br />
<strong>and</strong> Foreign Commercial Service <strong>and</strong> U.S. Department of State, 2000.<br />
The biggest opportunities in industrial wastewater<br />
treatment will be in food processing (sugar, edible oils,<br />
onion dehydration); cement, steel <strong>and</strong> iron; chemicals <strong>and</strong><br />
fertilizers; <strong>and</strong> textiles, especially at factories located<br />
along the Nile River.<br />
In the short term, dem<strong>and</strong> will be for unsophisticated<br />
technologies that treat the most obvious pollutants <strong>and</strong><br />
are easily operated <strong>and</strong> maintained. Process changes,<br />
improved housekeeping, <strong>and</strong> water conservation <strong>and</strong> reuse<br />
will be priorities. In addition, some of the existing<br />
systems are not in working condition due to a lack of<br />
spare parts <strong>and</strong> trained operators, which creates a market<br />
for spare parts <strong>and</strong> consulting services.<br />
India<br />
Population: 1.014 billion (2000)<br />
Urban population: 28 percent (2000)<br />
GNP per capita: $450 (1999)<br />
GDP average annual growth rate: 6.1 percent (1990–1998)<br />
<strong>Water</strong> supply coverage (urban/rural): 92 percent/<br />
86 percent (2000)<br />
Sanitation coverage (urban/rural): 73 percent/<br />
14 percent (2000)<br />
<strong>Market</strong> Overview<br />
It is estimated that 70 percent of India’s surface water<br />
resources are severely polluted. Municipal sources account<br />
for about three-fourths of total wastewater generation<br />
in volume <strong>and</strong> almost one-half of the total pollution<br />
load in the country. In the industrial sector, although 75<br />
percent of the large <strong>and</strong> medium-sized enterprises have<br />
installed adequate effluent treatment facilities, small-scale<br />
industries (particularly in textile, electroplating, <strong>and</strong> food<br />
processing sectors) still lag behind in terms of regulatory<br />
compliance.<br />
In India’s 23 largest cities (with population of more<br />
than 1 million), only 31 percent of wastewater is treated.<br />
Three of them have only primary treatment facilities <strong>and</strong><br />
13 have both primary <strong>and</strong> secondary treatment facilities.<br />
The biological systems for secondary treatment installed<br />
by the municipalities/water supply <strong>and</strong> sewerage boards<br />
of these metro cities include trickling filters, activated<br />
sludge with compressed aeration <strong>and</strong> activated sludge<br />
with mechanical aeration, <strong>and</strong> oxidation ditch technologies.<br />
78 As a result, the quality of India’s water supply is<br />
78. Business Guide to the <strong>Water</strong> <strong>and</strong> <strong>Wastewater</strong> Treatment <strong>Market</strong><br />
in India, Canada, Department of Foreign Affairs <strong>and</strong> International<br />
Trade, 1999.<br />
<strong>Water</strong> <strong>and</strong> <strong>Wastewater</strong> <strong>Export</strong> <strong>Market</strong> <strong>Plan</strong><br />
43
very poor: only 20 percent of the available drinking water<br />
meets health safety st<strong>and</strong>ards.<br />
The key factors contributing to the poor operation <strong>and</strong><br />
maintenance of India’s water <strong>and</strong> wastewater systems are<br />
the lack of funding, inadequate data, designs, <strong>and</strong> survey<br />
plans, poor personnel training, <strong>and</strong> the lack of monitoring.<br />
All publicly owned water <strong>and</strong> wastewater utilities<br />
continue to experience economic constraints owing to<br />
extremely low user fees for water <strong>and</strong> wastewater treatment<br />
services, limiting their investment potential. Existing<br />
water connection charges <strong>and</strong> user fees are highly<br />
subsidized. To meet the funding requirements, a number<br />
of utilities/municipalities are trying to raise resources<br />
from the municipal debt market.<br />
The 2000 total annual water <strong>and</strong> wastewater market<br />
in India was estimated at almost $1.2 billion, with the<br />
import market size at about 40 percent of this number,<br />
or $472 million. The level of spending in this sector has<br />
been increasing at an average rate of 14 to 15 percent<br />
over the last four to five years. 79 The main drivers for<br />
this growth are the increased enforcement in the industrial<br />
segment <strong>and</strong> sustained infrastructure funding from<br />
multilateral development banks in the municipal segment.<br />
Regulatory <strong>and</strong> Institutional Framework<br />
India has a comprehensive legal framework for water<br />
pollution control. The Central <strong>and</strong> State Pollution Control<br />
Boards implement the <strong>Water</strong> Act of 1974. The Central<br />
Board formulates st<strong>and</strong>ards, while the State Boards<br />
are in charge of planning <strong>and</strong> executing environmental<br />
programs, including enforcement. Under the 1986 Environmental<br />
Protection Act, the Central Board establishes<br />
discharge st<strong>and</strong>ards on the basis of best available technology,<br />
but the State Boards are authorized to apply more<br />
stringent st<strong>and</strong>ards for a specific category of industries<br />
under their jurisdiction, if required. The <strong>Water</strong> Cess Act<br />
of 1977 stipulates the collection of water user fees from<br />
certain categories of industries.<br />
There is a clear trend in India’s environmental regulations<br />
to prescribe more enforceable mass-based loading<br />
limits for effluents rather than concentration-based wastewater<br />
discharge st<strong>and</strong>ards, thereby increasing the dem<strong>and</strong><br />
for effluent treatment technologies. The sharp increases<br />
in water user fees <strong>and</strong> the central government’s intent to<br />
apply them to all industry sectors rather than only select<br />
ones drives Indian industry to identify <strong>and</strong> exploit opportunities<br />
for water conservation. An ongoing policy<br />
debate is concerned with the integration of appropriate<br />
market-based instruments into the existing comm<strong>and</strong>-<br />
79. “India: <strong>Water</strong> <strong>and</strong> <strong>Wastewater</strong> Treatment <strong>Market</strong>,” Industry Sector<br />
Analysis, U.S. <strong>and</strong> Foreign Commercial Service <strong>and</strong> U.S. Department<br />
of State, 2000.<br />
44 U.S. Department of Commerce, International Trade Administration<br />
Table 4.6. Estimated Size of the <strong>Water</strong> <strong>and</strong> <strong>Wastewater</strong><br />
<strong>Technologies</strong> <strong>Market</strong> in India, 2000 (millions of U.S.<br />
dollars)<br />
Total Growth Rate,<br />
Local <strong>Market</strong> 2000–2001<br />
Production Imports Size (percent)<br />
<strong>Water</strong> Treatment<br />
<strong>and</strong> Supply<br />
<strong>Wastewater</strong><br />
593 395 988 13%<br />
Treatment 115 77 192 15%<br />
Total 708 472 1,180<br />
Sources: “India: <strong>Water</strong> <strong>and</strong> <strong>Wastewater</strong> Treatment <strong>Market</strong>” (2000) <strong>and</strong><br />
“India: <strong>Wastewater</strong> Resource Development Equipment” (1999), Industry<br />
Sector Analyses, U.S. <strong>and</strong> Foreign Commercial Service <strong>and</strong> U.S.<br />
Department of State.<br />
<strong>and</strong>-control regulatory regime to provide incentives for<br />
cleaner technologies <strong>and</strong> pollution prevention.<br />
There is also a noticeable trend among leading Indian<br />
companies to obtain Environmental Management Systems<br />
(ISO 14001) certification for better corporate visibility<br />
<strong>and</strong> global outlook. Over 90 companies in diverse<br />
industry sectors have already obtained ISO 14001 certification.<br />
80 The growing acceptance of ISO 14001 is likely<br />
to generate dem<strong>and</strong> in the area of industrial pollution prevention<br />
<strong>and</strong> waste minimization.<br />
Privatization<br />
The government continues to dominate India’s infrastructure<br />
sectors. Although there is a policy debate on<br />
the need to privatize the existing publicly owned water<br />
<strong>and</strong> wastewater treatment works, official policy <strong>and</strong><br />
guidelines are yet to be framed to give a definite direction<br />
to the marketplace.<br />
However, many of India’s state <strong>and</strong> local governments<br />
are bringing private sector financing into the development<br />
of urban water supply <strong>and</strong> sewerage systems. Many<br />
Indian cities <strong>and</strong> water boards are entering into service<br />
<strong>and</strong> management contracts to improve the quality of service<br />
<strong>and</strong> reduce costs. These contracts range from labor<br />
<strong>and</strong> service (in almost all Indian cities) to operation <strong>and</strong><br />
maintenance of water <strong>and</strong> wastewater treatment plants<br />
(for example, in Chennai <strong>and</strong> Mumbai). BOT <strong>and</strong> BOO<br />
schemes have been implemented in the cities of Tirupur,<br />
Pune, Hyderabad, Bangalore, Goa, Kolhapur, Dewas, <strong>and</strong><br />
Cochin. 81 The following are just three examples of nu-<br />
80. Business Guide to the <strong>Water</strong> <strong>and</strong> <strong>Wastewater</strong> Treatment <strong>Market</strong><br />
in India, Canada, Department of Foreign Affairs <strong>and</strong> International<br />
Trade, 1999.<br />
81. “India: <strong>Water</strong> Resource Development Equipment,” Industry Sector<br />
Analysis, U.S. <strong>and</strong> Foreign Commercial Service <strong>and</strong> U.S. Department<br />
of State, 1999.
merous public-private partnerships in the water <strong>and</strong><br />
wastewater sector in India:<br />
• The Pune Municipal Corporation has contracted the<br />
operation <strong>and</strong> maintenance of the water supply<br />
system to a private company.<br />
• In Chennai, municipal authorities have contracted<br />
out the operation <strong>and</strong> maintenance of 75 pumping<br />
stations <strong>and</strong> are planning to do it for other water<br />
supply services.<br />
• A new development program in Tirupur, Corporation<br />
Limited, is implementing a $330 million, 30-year<br />
comprehensive BOT scheme for the city’s water <strong>and</strong><br />
sewerage system that would rely for its profitability<br />
on the collection of increased water <strong>and</strong> wastewater<br />
fees. The project will supply 185 million liters of<br />
drinking water per day <strong>and</strong> will build a 55 km-long<br />
pipeline <strong>and</strong> about 350 km of water distribution<br />
network, drinking water <strong>and</strong> wastewater treatment<br />
plants, pumping stations, <strong>and</strong> conveyance facilities.<br />
Trade <strong>and</strong> Investment Policy<br />
India’s new <strong>Export</strong>-Import Policy announced in April<br />
1999 signifies a move in the direction of a more liberal<br />
trade regime. India has recently reduced tariffs <strong>and</strong> removed<br />
quantitative restrictions on many items. Import<br />
tariff rates have been reduced from a peak rate of 300<br />
percent in 1991 to a ceiling of 30 percent in the 1999/<br />
2000 budget. Customs duties for energy-efficient equipment<br />
<strong>and</strong> certain pollution control equipment are lower<br />
(5 to 15 percent). India is committed to a phased reduction<br />
in duty rates in line with its membership in the WTO.<br />
The new industrial policy introduced in 1991 marked<br />
a major shift in India’s investment climate, relaxing or<br />
eliminating many restrictions on investment <strong>and</strong> simplifying<br />
the investment approval process. The government<br />
has exp<strong>and</strong>ed the list of industries eligible for automatic<br />
approval of foreign investments <strong>and</strong> also raised the upper<br />
level of foreign investments from 51 to 100 percent<br />
in 1998. Although the current government led by the<br />
Bharatiya Janata Party has taken a more nationalistic<br />
st<strong>and</strong> <strong>and</strong> advocated a protectionist “swadeshi” (made in<br />
India) approach to the economy, it continues to encourage<br />
foreign investment in core infrastructure sectors.<br />
As part of its long-time confrontation with Pakistan,<br />
India conducted a series of nuclear tests in May 1998<br />
which resulted in the imposition of economic sanctions<br />
by many countries, including the United States. Although<br />
the Indian government is trying to downplay the negative<br />
effect of the sanctions (they do not affect the activities<br />
of the U.S. Trade <strong>and</strong> Development Agency, U.S.<br />
Ex-Im Bank, <strong>and</strong> OPIC in India), they are taking a cer-<br />
tain toll on the country’s economy as a whole (due to<br />
the reduced foreign assistance) <strong>and</strong> on the U.S.-India<br />
trade <strong>and</strong> investment climate.<br />
The United States continues to be India’s largest trade<br />
<strong>and</strong> investment partner. The potential for exp<strong>and</strong>ed trade<br />
<strong>and</strong> investment is enormous but dependent on the future<br />
of Indian economic reforms. Under a bilateral trade<br />
agreement signed in January 2000, India has agreed to<br />
lift more than 1,400 specific trade restrictions for U.S.<br />
products by April 2001. However, India is not a member<br />
of the Paris Convention on intellectual property protection<br />
<strong>and</strong> does not have a bilateral patent agreement<br />
with the United States, which hampers U.S. investment<br />
in India.<br />
U.S. <strong>Market</strong> Share <strong>and</strong> Competition<br />
More than half of India’s market dem<strong>and</strong> for water<br />
<strong>and</strong> wastewater equipment is met by local manufacturers.<br />
The current annual turnover of Indian private water<br />
<strong>and</strong> wastewater companies is about $700 million. Out<br />
of this amount, almost 90 percent comes from equipment<br />
suppliers <strong>and</strong> the rest from the consulting business<br />
(most equipment manufacturers also offer feasibility assessments<br />
<strong>and</strong> engineering consulting services). 82 Most<br />
Indian water equipment suppliers produce pipes, water<br />
pumps, valves, <strong>and</strong> other relatively unsophisticated<br />
equipment. Some of the major Indian companies in this<br />
sector are Larsen <strong>and</strong> Toubro, Subhash Pipes, the GVK<br />
Group, Thermax Ltd., Jain Pipes Ltd., <strong>and</strong> Triveni Engineering<br />
& Industries Ltd.<br />
The U.S. Commercial Service estimates the U.S. share<br />
of the import market at about 25 percent in 2000, up from<br />
17 percent a year before. 83 European firms, especially<br />
from France (Vivendi <strong>and</strong> Degremont), the United Kingdom<br />
(Biwater, Bovis Group, Thames <strong>Water</strong>), <strong>and</strong> Germany<br />
(the Krupp Development Group, Nestler) are very<br />
strong competitors. European companies have gained<br />
their position because they market aggressively, <strong>and</strong> their<br />
governments extend financial aid to India in connection<br />
with water infrastructure development projects. South<br />
Korean firms also play a significant role in the Indian<br />
water equipment market.<br />
Very often, Western technologies are considered to be<br />
expensive in India. To overcome this barrier <strong>and</strong> remain<br />
competitive, it is important to compare both the capital<br />
<strong>and</strong> operating costs of equipment with comparable costs<br />
82. Business Guide to the <strong>Water</strong> <strong>and</strong> <strong>Wastewater</strong> Treatment <strong>Market</strong><br />
in India, Canada, Department of Foreign Affairs <strong>and</strong> International<br />
Trade, 1999.<br />
83. “India: <strong>Water</strong> <strong>and</strong> <strong>Wastewater</strong> Treatment <strong>Market</strong>,” Industry Sector<br />
Analysis, U.S. <strong>and</strong> Foreign Commercial Service <strong>and</strong> U.S. Department<br />
of State, 2000.<br />
<strong>Water</strong> <strong>and</strong> <strong>Wastewater</strong> <strong>Export</strong> <strong>Market</strong> <strong>Plan</strong><br />
45
of competing equipment. In many cases, a little higher<br />
capital investment for equipment would result in lower<br />
daily operating costs for the end user. This analysis must<br />
be part of marketing strategy since the offered up-front<br />
costs of product/services considerably impact the final<br />
decision of the end users in India.<br />
Forming a strategic alliance with the right Indian partner<br />
is perhaps the most important aspect to getting a niche<br />
in the local market. Affiliation with reputable <strong>and</strong> knowledgeable<br />
local partners helps considerably in building<br />
relationships directly with end users, adapting to local<br />
business cultures, keeping abreast with vital market information<br />
<strong>and</strong> in dealing with local issues. The long-term<br />
strategic alliance creates competitive advantage <strong>and</strong> solid<br />
business growth. Therefore, alliances must be forged on<br />
a long-term basis. Businesses choosing the local partner<br />
should carefully <strong>and</strong> cautiously consider this fact when<br />
considering a local partner.<br />
Indian industry prefers joint ventures or technology<br />
licensing agreements where the Indian partner manufactures<br />
equipment in India <strong>and</strong> imports either the design or<br />
the core process from abroad. Under such arrangements,<br />
Indian companies can manage on-site execution of<br />
projects, with the U.S. partner providing the required<br />
technological expertise. This approach generates cost<br />
savings <strong>and</strong> competitive advantages for U.S. firms.<br />
<strong>Market</strong> Opportunities<br />
In the coming years, the level of investment is likely<br />
to be higher in India’s municipal water <strong>and</strong> wastewater<br />
treatment market segment compared to the industrial one<br />
<strong>and</strong> would be primarily driven by assistance from external<br />
donor agencies.<br />
The World Bank <strong>and</strong> the Asian Development Bank<br />
have been the principal sources of external financial assistance.<br />
The following are key World Bank <strong>and</strong> Asian<br />
Development Bank projects in water supply <strong>and</strong> sanitation<br />
that are of potential interest to U.S. companies:<br />
• Third Chennai <strong>Water</strong> Supply <strong>and</strong> Environmental<br />
Sanitation Project (World Bank, $200 million). The<br />
project will finance the rehabilitation <strong>and</strong> expansion<br />
of water distribution <strong>and</strong> sewerage system improvements,<br />
including low-cost sanitation.<br />
• Second Hyderabad Urban <strong>Water</strong> Supply <strong>and</strong><br />
Sanitation Project (World Bank, $180 million). The<br />
project includes the reorganization of the Hyderabad<br />
Metropolitan <strong>Water</strong> Supply <strong>and</strong> Sewerage Board;<br />
reduction of water losses; rehabilitation <strong>and</strong> expansion<br />
of water supply systems; <strong>and</strong> strengthening <strong>and</strong><br />
expansion of the sewerage system.<br />
46 U.S. Department of Commerce, International Trade Administration<br />
• Rajasthan Urban Infrastructure Development<br />
Project (Asian Development Bank, $250 million).<br />
This project will finance, among others, a water<br />
supply rehabilitation <strong>and</strong> expansion program <strong>and</strong> a<br />
wastewater management program.<br />
• Karnataka Urban Development <strong>and</strong> Coastal<br />
Environmental Management Project (Asian<br />
Development Bank, $175 million). The project will<br />
support improvements in water supply <strong>and</strong> sanitation<br />
in the Bangalore sub-region.<br />
Significant market opportunities are also created by<br />
the increased public sector funding for water <strong>and</strong> wastewater<br />
infrastructure in India. Under its ninth five-year<br />
plan (1998–2002), India’s central government will allocate<br />
$300 million for urban <strong>and</strong> rural water supply<br />
projects. The central government-sponsored National<br />
River Action <strong>Plan</strong> is a large source of investments in<br />
municipal wastewater treatment. The plan is worth about<br />
$486 million <strong>and</strong> covers a total of 141 towns in 14 states.<br />
In addition, the Indian government has also approved<br />
clean-up programs for the Gomti, Yamuna, <strong>and</strong> Damodar<br />
rivers, amounting to $135 million. These upcoming investments<br />
bring good business prospects for U.S. companies<br />
for providing wastewater treatment equipment <strong>and</strong><br />
services.<br />
There is growing policy support in India for common<br />
effluent treatment plants for clusters of small-scale industries.<br />
In 2000, there were a total of 101 plants around<br />
the country. State governments are spending substantial<br />
amounts of money for the promotion of these plants. For<br />
example, the Delhi government has undertaken an ambitious<br />
project to construct 15 plants for 22 industrial estates<br />
in the city. Each common effluent treatment plant<br />
is expected to cost about $1.7 million. While 50 percent<br />
of this cost will be met by local industries, the Delhi government<br />
would provide the remaining 50 percent. 84<br />
The number of industrial units in common effluent<br />
treatment plants could be anywhere between seven <strong>and</strong><br />
2,200, but generally varies between 50 <strong>and</strong> 100. They<br />
typically include a screen/grit chamber, equalization tank,<br />
flash mixer, clariflocculator, send filter, aerator, sludge<br />
thickener, rotary vacuum filter, <strong>and</strong> an activated carbon<br />
column as part of the treatment chain. These plants represent<br />
promising opportunities for U.S. companies producing<br />
these technologies.<br />
There are a number of industrial estates that rely on<br />
treated wastewater from municipal wastewater treatment<br />
plants for their water needs; for example, the Manali in-<br />
84. Business Guide to the <strong>Water</strong> <strong>and</strong> <strong>Wastewater</strong> Treatment <strong>Market</strong><br />
in India, Canada, Department of Foreign Affairs <strong>and</strong> International<br />
Trade, 1999.
Table 4.7. Technology Best Prospects in India’s <strong>Water</strong> <strong>and</strong> <strong>Wastewater</strong> Treatment Sector<br />
Subsector Best Prospects<br />
<strong>Water</strong> distribution systems Pumps, valves, motors, compressors, storage tanks, repair equipment for leaking pipes,<br />
meters<br />
Municipal water treatment Ultraviolet disinfection systems, advanced reverse osmosis <strong>and</strong> membrane filtration systems,<br />
aerators, decanters<br />
Municipal wastewater treatment Advanced oxidation systems, energy efficient aerators, upflow anaerobic sludge blanket<br />
systems<br />
Industrial wastewater treatment Rotary bio-disc systems, sequencing batch reactor systems, automatic chemical dosing<br />
systems, oil removal systems, industry-specific pollutant removal/reduction systems<br />
Analytical/monitoring equipment Auto-analyzers for phosphorus <strong>and</strong> nitrogen, thermohydrographs, total organic carbon<br />
(for all sub-sectors) analyzers, electronic flow meters, continuous pH meters, spectrophotometers, data loggers<br />
Sources: “India: <strong>Water</strong> <strong>and</strong> <strong>Wastewater</strong> Treatment <strong>Market</strong>” (2000) <strong>and</strong> “India: <strong>Wastewater</strong> Resource Development Equipment” (1999), Industry<br />
Sector Analyses, U.S. <strong>and</strong> Foreign Commercial Service <strong>and</strong> U.S. Department of State.<br />
dustrial estate in Chennai. U.S. companies having expertise<br />
in water recycling may have a competitive edge in<br />
this emerging market niche in India.<br />
The dem<strong>and</strong> for water <strong>and</strong> wastewater testing <strong>and</strong><br />
analysis equipment is primarily driven by regulatory enforcement.<br />
The growth in this market segment has been<br />
relatively low in the last three decades. However, the recent<br />
enforcement strengthening trend may create new<br />
opportunities. Many state pollution control boards have<br />
undertaken major programs to enhance in-house monitoring<br />
<strong>and</strong> analysis capabilities. Moreover, large <strong>and</strong><br />
medium-sized industrial facilities are also important buyers<br />
of state-of-the-art monitoring <strong>and</strong> analysis equipment<br />
<strong>and</strong> services, since they are now required to regularly<br />
monitor their own discharges.<br />
India’s private financial institutions are an important<br />
source of financial assistance for water <strong>and</strong> wastewater<br />
projects. The most important ones include the Industrial<br />
Finance Corporation of India (IFCI), the Industrial Credit<br />
<strong>and</strong> Investment Corporation of India (ICICI), the Industrial<br />
Reconstruction Bank of India (IRBI), <strong>and</strong> the Industrial<br />
Development Bank of India (IDBI). IFCI, ICICI,<br />
<strong>and</strong> IDBI provide direct financial assistance (at a 15.5<br />
percent interest rate, for up to 75 percent of the project<br />
cost) to large <strong>and</strong> medium-sized industries to install effluent<br />
treatment plants. ICICI also supports technology<br />
development ventures, while IRBI provides credit <strong>and</strong><br />
investment needed for rehabilitation of industrial projects.<br />
Infrastructure Leasing & Financial Services, a private<br />
venture capital fund, recently raised $250 million from<br />
debt market for Ahmedabad Municipal Corporation to<br />
be used for improving the city’s infrastructure <strong>and</strong> $425<br />
million for the Tirupur Industrial Area wastewater management<br />
project. The Housing Urban Development Corporation<br />
has recently created a new urban infrastructure<br />
fund that also provides loan assistance to urban water<br />
supply <strong>and</strong> sewage treatment projects. The total loan assistance<br />
approved under the fund in 1997–98 was $20<br />
million.<br />
U.S. exporters should take advantage of opportunities<br />
created by U.S. assistance programs in India. For example,<br />
under USAID’s Urban <strong>and</strong> Environmental Credit<br />
Program, a loan guarantee of about $25 million helped<br />
launch South Asia’s first municipal bond for improvement<br />
of water, sewerage, <strong>and</strong> waste collection systems.<br />
This bond, for the city of Ahmedabad, has encouraged<br />
13 other Indian cities to seek credit ratings for future<br />
bonds or other debt instruments to finance environmental<br />
infrastructure projects. USAID assistance also helped<br />
catalyze the Tirupur water supply <strong>and</strong> sewerage BOT<br />
project. The U.S. engineering firm, Bechtel, is part of<br />
the consortium that was awarded this project.<br />
In 2000, the U.S. Ex-Im Bank announced a new line<br />
of credit of $500 million (with $100 million reserved for<br />
environmental infrastructure projects) for U.S. firms trying<br />
to access the Indian market. US-AEP’s technology<br />
representatives in New Delhi, Mumbai, Chennai, <strong>and</strong><br />
Calcutta are working to identify appropriate partners for<br />
U.S. firms in the field.<br />
Japan<br />
Population: 127 million (2000)<br />
Urban population: 79 percent (2000)<br />
GNP per capita: $32,230 (1999)<br />
GDP average annual growth rate: 1.5 percent (1990-1998)<br />
<strong>Water</strong> supply coverage (total): 96 percent (1990-1996) 85<br />
Sanitation coverage (total): 100 percent (1990-1996) 86<br />
85. World Development Indicators, World Bank, 2000.<br />
86. Ibid.<br />
<strong>Water</strong> <strong>and</strong> <strong>Wastewater</strong> <strong>Export</strong> <strong>Market</strong> <strong>Plan</strong><br />
47
<strong>Market</strong> Overview<br />
Almost 30 percent of rivers <strong>and</strong> about 60 percent of<br />
lakes <strong>and</strong> reservoirs in Japan exceed national water quality<br />
st<strong>and</strong>ards, 87 primarily because the country has been<br />
slow to develop municipal wastewater treatment systems<br />
<strong>and</strong> has not sufficiently enforced industrial effluent st<strong>and</strong>ards.<br />
In addition, the rapid growth of metal plating, precision<br />
machinery, <strong>and</strong> electronics industries has led to<br />
increased discharges of organic chlorine solvents.<br />
The market for wastewater treatment equipment in<br />
Japan was estimated at $6 billion in 1996. The market is<br />
growing at a rate of 5 to 8 percent a year <strong>and</strong> is expected<br />
to exceed $10 billion in 2010. 88 The Ministry of<br />
Construction’s eighth sewerage development plan envisioned<br />
spending over $217 billion on municipal wastewater<br />
treatment between 1996 <strong>and</strong> 2002. 89<br />
Regulatory <strong>and</strong> Institutional Framework<br />
Japan’s <strong>Water</strong> Pollution Control Law, which was<br />
amended in 1996, establishes two categories of national<br />
effluent st<strong>and</strong>ards, one for public health <strong>and</strong> one for environmental<br />
protection, that are implemented by the national<br />
environmental agency. Prefectural <strong>and</strong> municipal<br />
governments can promulgate more stringent st<strong>and</strong>ards if<br />
warranted by local environmental conditions.<br />
Prefectures <strong>and</strong> municipalities are responsible for water<br />
supply <strong>and</strong> sewerage within their jurisdictions. Japan’s<br />
municipal water supply <strong>and</strong> sewerage infrastructure is<br />
publicly owned <strong>and</strong> operated. 90 The Ministry of Construction<br />
is in charge of implementing water <strong>and</strong> wastewater<br />
infrastructure development projects.<br />
Trade <strong>and</strong> Investment Policy<br />
The Japanese government has removed or liberalized<br />
most legal restrictions on foreign investment. However,<br />
direct foreign investment levels have remained small relative<br />
to the size of the economy, reflecting a range of longst<strong>and</strong>ing<br />
structural impediments, including:<br />
87. “Japan: <strong>Wastewater</strong> Treatment Equipment,” Industry Sector Analysis,<br />
U.S. <strong>and</strong> Foreign Commercial Service <strong>and</strong> U.S. Department of<br />
State, 1998.<br />
88. “Environmental <strong>Market</strong> in Japan,” International <strong>Market</strong> Insight,<br />
U.S. <strong>and</strong> Foreign Commercial Service <strong>and</strong> U.S. Department of State,<br />
2000.<br />
89. “Japan: <strong>Wastewater</strong> Treatment Equipment,” Industry Sector Analysis,<br />
U.S. <strong>and</strong> Foreign Commercial Service <strong>and</strong> U.S. Department of<br />
State, 1998.<br />
90. There was not enough information to have a separate privatization<br />
section in the Japan profile. 91. Ibid.<br />
48 U.S. Department of Commerce, International Trade Administration<br />
• a high overall cost structure that makes market entry<br />
<strong>and</strong> expansion expensive;<br />
• corporate practices <strong>and</strong> market rules that inhibit<br />
foreign acquisition of Japanese firms; <strong>and</strong><br />
• exclusive buyer-supplier networks <strong>and</strong> alliances, still<br />
maintained by some Japanese companies belonging<br />
to the same business grouping (or keiretsu), which<br />
limit competition from foreign firms.<br />
There are no regulations restricting the access of foreign<br />
manufacturers to the Japanese market. The Japanese<br />
government subsidizes purchasers of environmental<br />
equipment, both domestically produced <strong>and</strong> imported, by<br />
granting special tax deductions or low-interest loans.<br />
Japan has instituted a number of programs to support<br />
imports that are administered through the Japan External<br />
Trade Organization (JETRO). JETRO’s activities are<br />
designed to support industrial cooperation, promote twoway<br />
direct investment, <strong>and</strong> disseminate market information.<br />
JETRO’s Technology Tie-up Promotion Program<br />
links foreign companies with their high-tech Japanese<br />
counterparts for various types of strategic alliances, including<br />
joint ventures, joint research <strong>and</strong> development<br />
projects, <strong>and</strong> technology imports.<br />
U.S. <strong>Market</strong> Share <strong>and</strong> Competition<br />
The market is highly competitive with a large number<br />
of Japanese suppliers. There are about 120 water <strong>and</strong><br />
wastewater equipment manufacturers in Japan, nearly<br />
half of them large companies. The main players are the<br />
Ebara Corporation, Kubota Corporation, Kurita <strong>Water</strong><br />
Industries, <strong>and</strong> Mitsubishi Heavy Industries, which have<br />
a combined 27 percent share of Japan’s water <strong>and</strong> wastewater<br />
equipment market. 91 Ebara manufactures a great<br />
variety of water supply <strong>and</strong> treatment equipment (filters,<br />
water conditioning equipment, membranes, pumps,<br />
valves, etc.), as well as wastewater treatment equipment<br />
(effluent recycling systems, physical <strong>and</strong> biological treatment<br />
systems, chemicals, sludge h<strong>and</strong>ling equipment,<br />
etc.). It also provides plant design <strong>and</strong> construction, process<br />
engineering, <strong>and</strong> consulting services. Mitsubishi offers<br />
a similarly wide array of equipment <strong>and</strong> services in<br />
this market. Kurita specializes in membrane technologies,<br />
wastewater treatment chemicals, <strong>and</strong> sludge reduction<br />
systems. Kubota is a major pipe manufacturer.<br />
Japanese companies have managed to satisfy most of the<br />
market need by adapting relevant technologies that already<br />
exist in the country.<br />
The Japanese government also sponsors the development<br />
of new water <strong>and</strong> wastewater technologies by do-
mestic suppliers. For example, the ACT-21 technology<br />
development project (to be completed in 2001) targets<br />
the design of new drinking water treatment <strong>and</strong> treated<br />
wastewater recycling technologies.<br />
There is no publicly available information on Japan’s<br />
imports of water <strong>and</strong> wastewater equipment, since Japan<br />
has no customs classification on environmental products.<br />
However, indirect evidence shows that these imports are<br />
insignificant. In cases where foreign equipment is used,<br />
it is usually produced locally under licensing arrangements<br />
rather than imported. 92 Foreign companies find it<br />
difficult to compete in the Japanese market due to the<br />
considerable time <strong>and</strong> costs required to modify equipment<br />
to meet regulatory st<strong>and</strong>ards <strong>and</strong> various local user<br />
specifications. The top two exporters of wastewater<br />
equipment to Japan are the United States <strong>and</strong> Germany. 93<br />
U.S. water <strong>and</strong> wastewater equipment suppliers have<br />
been successful in the Japanese market in a few technology<br />
areas, including reverse osmosis <strong>and</strong> nanofiltration<br />
technologies, as well as water quality analysis instrumentation.<br />
The successful U.S. companies (Dow Chemical,<br />
Pall Corporation, Perkin-Elmer, Millipore, <strong>and</strong> several<br />
others) have established themselves in Japan for the long<br />
term <strong>and</strong> maintain local wholly owned subsidiaries. U.S.<br />
firms have to compete against local suppliers not only in<br />
price <strong>and</strong> technology, but also in maintenance costs, energy,<br />
<strong>and</strong> space efficiency, which is so important in Japan.<br />
The long-term competitiveness of U.S. companies<br />
doing business in Japan also depends on their ability to<br />
be very customer-oriented <strong>and</strong> meet the extremely high<br />
Japanese st<strong>and</strong>ards for quality, product durability, <strong>and</strong><br />
after-sale service.<br />
<strong>Market</strong> Opportunities<br />
The activated sludge process has been used in Japan<br />
extensively for decades for both municipal <strong>and</strong> industrial<br />
wastewater treatment. However, in recent years, the<br />
anaerobic digestion process has become increasingly<br />
popular because of its smaller required installation space,<br />
lower operating costs <strong>and</strong> sludge volume generated. This<br />
trend creates opportunities for U.S. exporters of this technology.<br />
Other best sales prospects include high-performance<br />
filters, industrial wastewater recycling systems,<br />
sludge dehydration equipment, as well as sampling, analytical,<br />
<strong>and</strong> monitoring instrumentation.<br />
92. “Japan: <strong>Wastewater</strong> Treatment Equipment,” Industry Sector Analysis,<br />
U.S. <strong>and</strong> Foreign Commercial Service <strong>and</strong> U.S. Department of<br />
State, 1998.<br />
93. The Environmental <strong>Market</strong> in Japan, Canada, Department of Foreign<br />
Affairs <strong>and</strong> International Trade, 1999.<br />
Machinery manufacturing, food processing, steel, <strong>and</strong><br />
chemical industries present the greatest opportunities for<br />
suppliers of industrial effluent treatment equipment.<br />
Mexico<br />
Population: 99 million (2000)<br />
Urban population: 74 percent (2000)<br />
GNP per capita: $4,420 (1999)<br />
GDP average annual growth rate: 3.1 percent (1990–2000)<br />
<strong>Water</strong> supply coverage (urban/rural): 94 percent/<br />
63 percent (2000)<br />
Sanitation coverage (urban/rural): 85 percent/<br />
32 percent (2000)<br />
<strong>Market</strong> Overview<br />
Mexico’s water market is the single most important<br />
market for U.S. exports of environmental equipment <strong>and</strong><br />
services because of the need for infrastructure investments,<br />
the country’s proximity to the United States, <strong>and</strong><br />
the strong trade relationship between the United States<br />
<strong>and</strong> Mexico.<br />
Currently, more than 13 million urban residents in<br />
Mexico do not have access to potable water due to the<br />
lack of infrastructure. The number is much higher in rural<br />
areas. The mismanagement of water supplies is also<br />
a big problem—an estimated 40 percent of potable water<br />
is lost through leakage. 94 There has been some improvement<br />
over the last few years. For example, the<br />
percentage of residents having access to potable water<br />
has increased to 87.4 percent. 95<br />
<strong>Wastewater</strong> treatment, both industrial <strong>and</strong> municipal,<br />
is inadequate. Only 17 percent of wastewater is treated<br />
at all, <strong>and</strong> only 12 percent to regulatory st<strong>and</strong>ards. 96 Sixty<br />
percent of industrial wastewater is discharged directly<br />
into open waters. 97 It is estimated that Mexico will have<br />
to invest approximately $7.2 billion <strong>and</strong> spend about $1<br />
billion annually to meet wastewater treatment st<strong>and</strong>ards. 98<br />
94. The Environmental <strong>Market</strong> in Mexico, Canada, Department of<br />
Foreign Affairs <strong>and</strong> International Trade, 2000.<br />
95. Mexico Environmental <strong>Technologies</strong> <strong>Export</strong> <strong>Market</strong> <strong>Plan</strong>, U.S.<br />
Department of Commerce, International Trade Administration, Office<br />
of Environmental <strong>Technologies</strong> Industries, 2001.<br />
96. Ibid.<br />
97. The largest generator of industrial effluents is the sugarcane industry<br />
(40 percent), followed by the chemical industry (18 percent),<br />
the rest coming from the pulp <strong>and</strong> paper, petroleum, beverage, textile,<br />
iron <strong>and</strong> steel, electronics, <strong>and</strong> food processing industries.<br />
98. National Ecology Institute, quoted in the Mexico Environmental<br />
<strong>Technologies</strong> <strong>Export</strong> <strong>Market</strong> <strong>Plan</strong>, U.S. Department of Commerce,<br />
International Trade Administration, 2001.<br />
<strong>Water</strong> <strong>and</strong> <strong>Wastewater</strong> <strong>Export</strong> <strong>Market</strong> <strong>Plan</strong><br />
49
According to the country’s National <strong>Water</strong> Commission<br />
(CNA), only about 8 percent of industrial wastewater<br />
<strong>and</strong> 15 percent of municipal sewage is treated. 99<br />
Nearly one-quarter (200) of the existing municipal wastewater<br />
treatment plants are out of operation. While the<br />
largest corporations have made real improvements in<br />
treating their wastewater, the same cannot be said for<br />
smaller companies.<br />
Two areas of Mexico are facing particular problems<br />
with respect to water <strong>and</strong> wastewater. The first is Mexico<br />
City, home to 20 million people. Mexico City must<br />
supplement its meager local water resource at great cost<br />
by pumping water from 127 kilometers away. In addition,<br />
overexploitation of aquifers for drinking water has<br />
resulted in rapid l<strong>and</strong> subsidence (at the rate of 50 centimeters<br />
annually) <strong>and</strong> damage to the infrastructure. In<br />
addition, the capital city alone accounts for 50 percent<br />
of the sewage collection in the country, <strong>and</strong> the sewage<br />
treatment is inadequate. In fact, Mexico City’s sewage<br />
flows into a river used for irrigation purposes, creating a<br />
substantial human health hazard.<br />
Another area with acute water-related problems is the<br />
U.S.-Mexico border, which stretches 2,000 miles. The<br />
operation of some 2,000 maquiladoras (in-bond plants<br />
that operate under special Mexican customs treatment <strong>and</strong><br />
preferential foreign investment regulations) has produced<br />
an enormous population shift to the border region, where<br />
there was little infrastructure to support the booming development.<br />
The lack of adequate drinking water supply<br />
infrastructure <strong>and</strong> disposal of untreated industrial <strong>and</strong><br />
municipal effluents (sometimes directly into the sources<br />
of drinking water) have resulted in severe health risks to<br />
the border communities.<br />
The Mexican government recognizes water <strong>and</strong> wastewater<br />
management as one of the top priorities of its<br />
market-oriented program. <strong>Water</strong> prices have risen dramatically<br />
in recent years as the government has removed<br />
subsidies <strong>and</strong> begun to implement cost-recovery pricing.<br />
The other major direction of the government program was<br />
to involve the private sector (mostly through 10 to 15<br />
year concessions) in the improvement <strong>and</strong> management<br />
of Mexico’s water <strong>and</strong> wastewater infrastructure. With<br />
the exception of rural areas, the government expects much<br />
of the funding for new <strong>and</strong> rehabilitated wastewater treatment<br />
plants to come from the private sector. The United<br />
States has been very active in this region, investing approximately<br />
$2.5 billion dollars to address environmental<br />
infrastructure needs of border communities. 100<br />
99. The Environmental <strong>Market</strong> in Mexico, Canada, Department of<br />
Foreign Affairs <strong>and</strong> International Trade, 2000.<br />
100. Mexico Environmental <strong>Technologies</strong> <strong>Export</strong> <strong>Market</strong> <strong>Plan</strong>, U.S.<br />
Department of Commerce, International Trade Administration, 2001.<br />
50 U.S. Department of Commerce, International Trade Administration<br />
These programs, together with a huge need for investment,<br />
have created a large water <strong>and</strong> wastewater market<br />
in Mexico. Its size was expected to reach $2.39 billion<br />
in 2000, with annual growth of about 10 percent. 101 The<br />
water supply market segment alone was estimated at $1.9<br />
billion in 1999, with a 5 to 7 percent growth rate per<br />
year. 102 The industrial wastewater treatment market is<br />
much smaller, just $94 million in 1998, but is growing at<br />
a much faster rate of 16 to 18 percent annually. The share<br />
of imports in the overall market is about 80 percent. 103<br />
Regulatory <strong>and</strong> Institutional Framework<br />
The system of effluent permits is a key element of<br />
Mexico’s water <strong>and</strong> wastewater management program.<br />
The previous system of industry-specific effluent limits<br />
was replaced in 1997 with a simpler system based on<br />
specific pollutants <strong>and</strong> the type of receiving waters (for<br />
direct discharges). Although the st<strong>and</strong>ards are tougher in<br />
heavily contaminated areas, they are, overall, less stringent<br />
than under the previous regulation <strong>and</strong> allow municipalities<br />
to limit themselves, in most cases, to primary<br />
wastewater treatment.<br />
Compliance deadlines for municipalities vary depending<br />
on their population: the year 2000 for cities <strong>and</strong> towns<br />
with over 50,000 residents, <strong>and</strong> 2005 <strong>and</strong> beyond for<br />
smaller communities. Industry compliance deadlines are<br />
based on daily BOD discharge volumes <strong>and</strong> are, similarly,<br />
the year 2000 for facilities discharging more than<br />
3 tons/day, <strong>and</strong> 2005 <strong>and</strong> beyond for those that discharge<br />
less.<br />
At the federal level, the CNA has ultimate responsibility<br />
for water resources <strong>and</strong> is responsible for enforcing<br />
effluent st<strong>and</strong>ards for direct discharges.<br />
Each of the states has its own water law, which determines<br />
how water services are provided <strong>and</strong> the way in<br />
which water tariffs are set. These laws also specify how<br />
much private participation is allowed in the provision of<br />
services <strong>and</strong> development of infrastructure.<br />
Mexican municipalities are responsible for providing<br />
water <strong>and</strong> wastewater treatment within their jurisdictions.<br />
New regulations covering discharges into sewerage systems<br />
were promulgated in 1998. Since the municipality<br />
is responsible for the quality of the wastewater it discharges<br />
to open waters, it has an incentive to ensure that<br />
industries pretreat their effluents <strong>and</strong> comply with stan-<br />
101. FY 2001 Country Commercial Guide: Mexico, U.S. <strong>and</strong> Foreign<br />
Commercial Service <strong>and</strong> U.S. Department of State, 2000.<br />
102. “Potable <strong>Water</strong> Resource Equipment,” Industry Sector Analysis,<br />
U.S. <strong>and</strong> Foreign Commercial Service <strong>and</strong> U.S. Department of State,<br />
1998.<br />
103. “Industrial <strong>Wastewater</strong> Treatment <strong>and</strong> Recycling Equipment,”<br />
Industry Sector Analysis, U.S. <strong>and</strong> Foreign Commercial Service <strong>and</strong><br />
U.S. Department of State, 1997.
dards for indirect discharges. Otherwise, the municipality<br />
must pay related effluent charges.<br />
One important characteristic of the regulatory climate<br />
is the tension between federal <strong>and</strong> local governments regarding<br />
large municipal water <strong>and</strong> wastewater projects.<br />
Priority municipal wastewater projects in Mexico City<br />
<strong>and</strong> Guadalajara have been stalled due to political disputes<br />
between the federal <strong>and</strong> local governments. 104<br />
CNA’s staff shortages <strong>and</strong> the limited availability of<br />
monitoring equipment have impeded enforcement of<br />
water laws in Mexico. Enforcement efforts were reduced<br />
in the wake of the 1995 economic crisis (in order to avoid<br />
even higher unemployment) but are picking up again.<br />
Under a recent regulation, state <strong>and</strong> municipal authorities<br />
are now responsible for enforcing the st<strong>and</strong>ards for<br />
small <strong>and</strong> medium-sized enterprises. At the same time,<br />
there are discussions about integrating CNA’s enforcement<br />
activities with those of the Office of the Attorney<br />
General for Environmental Protection, which prosecutes<br />
environmental violations not related to water.<br />
Rapidly rising water prices are encouraging voluntary<br />
compliance by industry, since companies are allowed to<br />
draw free water to match discharges that meet new st<strong>and</strong>ards.<br />
Federal tax incentives, including immediate depreciation<br />
of environmental investments, also stimulate<br />
voluntary compliance efforts.<br />
Privatization<br />
In 1996, there were 360 municipal water utilities in<br />
Mexico, 207 of them financially autonomous, <strong>and</strong> the rest<br />
receiving government support. 105 Many municipalities<br />
have been having difficulty managing their responsibilities<br />
to provide water supply <strong>and</strong> sewerage services to the<br />
population. The infrastructure was usually built by the<br />
federal government, <strong>and</strong> local councils have little experience<br />
with the technical <strong>and</strong> financial issues involved.<br />
The Mexican government has chosen to pursue a number<br />
of strategies to involve the private sector in the water<br />
<strong>and</strong> wastewater infrastructure markets. These<br />
strategies include integrated concessions, management<br />
contracts, partial concessions, <strong>and</strong> BOT arrangements.<br />
In the concession schemes, the local government provides<br />
a contract to a private operator for the operation of<br />
their entire water system (an integrated concession) or a<br />
portion of the water system (a partial concession). Two<br />
cities—Aguascalientes <strong>and</strong> Cancún—have adopted integrated<br />
concessions. Although there have been a number<br />
of problems, the arrangements in these two cities are seen<br />
104. Mexico Environmental <strong>Technologies</strong> <strong>Export</strong> <strong>Market</strong> <strong>Plan</strong>, U.S.<br />
Department of Commerce, International Trade Administration, 2001.<br />
105. The Environmental <strong>Market</strong> in Mexico, Canada, Department of<br />
Foreign Affairs <strong>and</strong> International Trade, 2000. 106. Ibid.<br />
as successful. The replicability of these schemes is limited,<br />
however, by the uniquely affluent nature of these<br />
two cities.<br />
Under a management contract arrangement, a private<br />
company is paid a fee for meeting improvement or performance<br />
benchmarks. This arrangement has proved successful<br />
in a number of cities including Mexico City <strong>and</strong><br />
Puebla. Management contract schemes are likely to be<br />
implemented in other large cities <strong>and</strong> constitute an opportunity<br />
for U.S. firms with experience in water system<br />
management or that sell efficiency-enhancing equipment,<br />
services, or software.<br />
The government has opted to involve the private sector<br />
through BOT projects in a number of areas. The <strong>Water</strong><br />
Law of 1992 sets out guidelines for private sector<br />
participation in water supply projects in Mexico. However,<br />
the high capital costs <strong>and</strong> the risks of collecting<br />
water <strong>and</strong> wastewater fees from financially troubled municipalities<br />
have made the envisioned wide-scale implementation<br />
of the BOT program difficult. Out of 40 BOT<br />
projects planned in 1993, only eight were operational in<br />
1998. 106<br />
The federal government in most cases cannot step in<br />
to help assure private investor repayment. <strong>Water</strong> utilities<br />
that can show a strong balance sheet (only an estimated<br />
10 percent of them can), or projects which by themselves<br />
can demonstrate a low level of commercial risk, are eligible<br />
to benefit from the Public Works <strong>and</strong> Services Bank<br />
revolving contingency fund. This fund has been used to<br />
absorb some of the commercial risk associated with shortterm<br />
municipal failure-to-pay. The mechanism, though<br />
limited, has been indispensable in closing financing for<br />
most municipal BOT wastewater projects. Projects with<br />
access to international funding are clearly the most attractive<br />
to investors <strong>and</strong> equipment suppliers.<br />
The shortage of funds is causing a trend toward regional<br />
projects that would cover the needs of more than<br />
one municipality. The state governments are also encouraging<br />
the integration of water supply <strong>and</strong> wastewater<br />
treatment projects under one BOT scheme.<br />
Trade <strong>and</strong> Investment Policy<br />
Mexico’s trade policy toward the U.S. has been influenced<br />
by the requirements of NAFTA, which was enacted<br />
in 1994. NAFTA continues to be a key factor in<br />
boosting Mexico’s imports <strong>and</strong> raising its overall level<br />
of economic activity, as well as spurring competitiveness<br />
<strong>and</strong> institutional reform. To comply with NAFTA requirements,<br />
Mexico has further lowered its tariffs on goods<br />
originating in the United States <strong>and</strong> Canada. Mexican<br />
<strong>Water</strong> <strong>and</strong> <strong>Wastewater</strong> <strong>Export</strong> <strong>Market</strong> <strong>Plan</strong><br />
51
tariffs on U.S. goods are now between 0 <strong>and</strong> 10 percent<br />
of value. Eighty-five percent of U.S. goods now enter<br />
Mexico duty-free. Additionally, Mexico has abolished its<br />
import licensing requirements for most goods that originate<br />
in the United States.<br />
The 1993 foreign investment law has opened more<br />
areas of the economy to foreign ownership. It has also<br />
provided national treatment for most foreign investment,<br />
eliminated all performance requirements for foreign investment<br />
projects, <strong>and</strong> liberalized criteria for automatic<br />
approval of foreign investment proposals.<br />
Since Mexico is a neighboring country, it is a natural<br />
market for U.S. companies. U.S. exporters have a great<br />
competitive advantage in Mexico due to the political,<br />
economic, <strong>and</strong> cultural ties between the two countries.<br />
Underlying the strong U.S. position is also a genuine respect<br />
for <strong>and</strong> interest in U.S. products <strong>and</strong> companies.<br />
Mexico largely embraces U.S. st<strong>and</strong>ards, business practices,<br />
<strong>and</strong> consumer styles. In 1997, Mexico overtook<br />
Japan as the second-largest importer of U.S. goods, second<br />
only to Canada. In 1999, the United States accounted<br />
for 74 percent of Mexico’s imports. 107<br />
U.S. <strong>Market</strong> Share <strong>and</strong> Competition<br />
The dem<strong>and</strong> for water <strong>and</strong> wastewater equipment <strong>and</strong><br />
services from U.S. firms is expected to grow at an an-<br />
107. FY 2001 Country Commercial Guide: Mexico, U.S. <strong>and</strong> Foreign<br />
Commercial Service <strong>and</strong> U.S. Department of State, 2000.<br />
52 U.S. Department of Commerce, International Trade Administration<br />
nual rate of about 14 percent in the short term. U.S. imports<br />
in this market equaled $1.4 billion in 2000, 108 with<br />
an import market share of up to 70 percent, depending<br />
on the market segment (see Figure 4.4). U.S. firms have<br />
a natural competitive advantage in the Mexican market<br />
due to geographic proximity, U.S. bilateral aid, the free<br />
trade regime under NAFTA, <strong>and</strong> the established reputation<br />
of U.S. products. Other imports come mainly from<br />
Japan (which has recently been increasing its market<br />
share), Germany, France, <strong>and</strong> the United Kingdom.<br />
Local production accounts for about 20 percent of the<br />
total market. Mexico has over 350 local manufacturers<br />
of water <strong>and</strong> wastewater equipment, 95 percent of which<br />
are small <strong>and</strong> medium-sized companies. However, Mexican<br />
companies produce only basic water equipment. The<br />
most common problems faced by domestic manufacturers<br />
are low-scale production, high costs, <strong>and</strong> obsolete<br />
technology.<br />
<strong>Market</strong> Opportunities<br />
Opportunities exist at all levels for U.S. companies in<br />
the Mexican water <strong>and</strong> wastewater market. Table 4.8<br />
identifies some of the market opportunities in Mexico.<br />
The Mexican government actively supports water <strong>and</strong><br />
wastewater projects. The federal government designed<br />
the National Program for Potable <strong>Water</strong> <strong>and</strong> Sewerage<br />
108. Ibid.<br />
Figure 4.4. Import <strong>Market</strong> Shares for <strong>Water</strong> <strong>and</strong> <strong>Wastewater</strong> <strong>Technologies</strong> in Mexico<br />
United<br />
Kingdom<br />
8%<br />
Japan<br />
10%<br />
France<br />
7%<br />
<strong>Water</strong> Supply<br />
Other<br />
5%<br />
United States<br />
70%<br />
Germany<br />
8%<br />
United States<br />
67%<br />
Sources: U.S. <strong>and</strong> Foreign Commercial Service <strong>and</strong> U.S. Department of State, Potable <strong>Water</strong> Resource Equipment (Washington, D.C., 1998);<br />
<strong>and</strong> ibid., Industrial <strong>Wastewater</strong> Treatment <strong>and</strong> Recycling Equipment (Washington, D.C., 1997).<br />
Japan<br />
10%<br />
France<br />
3%<br />
<strong>Wastewater</strong> Treatment<br />
Other<br />
12%
Table 4.8. <strong>Market</strong> Opportunities for U.S. Companies in Mexico<br />
Level of Government Type of <strong>Market</strong> Opportunities<br />
Federal–National <strong>Water</strong> Commission (CNA) Technology for water well drilling, water reinjection systems, emergency<br />
response, <strong>and</strong> water monitoring services<br />
Municipal <strong>and</strong> State Level Pumping stations, water networks, water metering, billing <strong>and</strong> collection<br />
systems, wastewater treatment, equipment maintenance, <strong>and</strong> potablization plants.<br />
Source: Mexico Environmental <strong>Technologies</strong> <strong>Export</strong> <strong>Market</strong> <strong>Plan</strong>, U.S. Department of Commerce, International Trade Administration, 2001.<br />
in Urban Zones (APAZU) to support local water utilities<br />
in improving their services. The program provides matching<br />
funds to improve administrative, financial, <strong>and</strong> operational<br />
efficiency, <strong>and</strong> to upgrade infrastructure. CNA<br />
has plans to invite private companies to build <strong>and</strong>/or<br />
modernize municipal wastewater treatment plants under<br />
the BOT scheme in the states of Guerrero, Veracruz, San<br />
Luis Potosí, Puebla, Tlaxcala, Hidalgo, <strong>and</strong> Michoacan.<br />
CNA also has projects to modernize the potable water<br />
distribution <strong>and</strong> sewage systems in the cities of Pachuca,<br />
San Luis Potosí, Huatulco, Acapulco, Cancún, Tabasco,<br />
<strong>and</strong> Hermosillo, among others.<br />
Companies specializing in water utility operations may<br />
have opportunities through APAZU <strong>and</strong> other funding<br />
programs to help Mexican water utilities improve their<br />
efficiency, a top federal priority. Some of the principal<br />
competition here will come from low-cost, sole proprietors<br />
that operate in the Mexican water utility market.<br />
BOT projects are also a good market for U.S. engineering<br />
firms.<br />
The municipal water supply <strong>and</strong> wastewater treatment<br />
market presents the biggest export opportunities for U.S.<br />
firms in Mexico. Private participation in the provision<br />
of potable water <strong>and</strong> sewerage is expected to grow as<br />
states <strong>and</strong> municipalities seek efficiency gains <strong>and</strong> to attract<br />
private capital.<br />
At least 100 tenders are planned for the next five to<br />
10 years to renovate <strong>and</strong> repair the existing drinking water<br />
distribution infrastructure in major cities, as well as<br />
to build or upgrade over 50 water or wastewater treatment<br />
plants. 109 It is important to note, however, that the<br />
planned construction of wastewater treatment facilities<br />
under BOT arrangements has been slow as the cost of<br />
this infrastructure exceeds many local communities’ capacity<br />
to pay.<br />
Under the present regulatory regime, most new municipal<br />
wastewater plants will now emphasize primary<br />
treatment with some exceptions, such as plants discharging<br />
into international waters on the border with the United<br />
States. Because primary treatment generally requires<br />
109. Environmental <strong>Market</strong> in Mexico, Canada, Department of Foreign<br />
Affairs <strong>and</strong> International Trade, 2000.<br />
fewer imported components <strong>and</strong> expertise, most U.S.<br />
project developers <strong>and</strong> equipment suppliers should develop<br />
new strategies to add value in the wastewater treatment<br />
market. One such strategy includes targeting for<br />
treatment the substantial volumes of sludge that these<br />
treatment plants are likely to generate.<br />
The best prospects for municipal water <strong>and</strong> wastewater<br />
treatment equipment include chlorinators, chlorine<br />
diffusers, chlorine contact chambers, mixed sludge<br />
pumps, primary clarifiers, PVC pipes, water meters, water<br />
filtration equipment, water pumps, valves, <strong>and</strong> water<br />
leak detectors.<br />
A number of U.S. <strong>and</strong> international agencies have<br />
sponsored water <strong>and</strong> wastewater projects in Mexico.<br />
These include the U.S. Environmental Protection Agency<br />
(EPA), the U.S. Geological Service, the World Bank,<br />
NADBank, <strong>and</strong> the Border Environment Cooperation<br />
Commission (BECC). 110 The U.S. EPA, NADBank, <strong>and</strong><br />
BECC are making substantial investments in water supply<br />
<strong>and</strong> wastewater treatment infrastructure projects along<br />
the U.S.-Mexico border. These projects, <strong>and</strong> others along<br />
the border, are good possibilities for U.S. companies.<br />
EPA is represented on both the NADBank <strong>and</strong> the<br />
BECC’s board of directors <strong>and</strong> is the primary source of<br />
construction grants for the projects. EPA grants are used<br />
to supplement funding for projects which cannot be completely<br />
financed by NADBank, state or local governments,<br />
or the private sector. The United States expects<br />
to provide $700 million in federal grants for water <strong>and</strong><br />
wastewater infrastructure construction between 1995 <strong>and</strong><br />
2005; Mexico also provides significant grants. There are<br />
currently over a dozen NADBank water/wastewater<br />
projects in the U.S.-Mexico border area, with a total value<br />
of $400 million.<br />
The industrial sector offers extremely good market<br />
opportunities for U.S. technology <strong>and</strong> services companies,<br />
particularly in wastewater treatment. This market<br />
is driven in large part by the need to comply with the<br />
110. BECC funds feasibility studies, assists in infrastructure design,<br />
<strong>and</strong> consults on the planning process. To secure BECC certification,<br />
a project must fulfill financial, political, sustainability, <strong>and</strong> technical<br />
criteria. NADBank works with a variety of project funding sources to<br />
assemble a finance package for each project certified by the BECC.<br />
<strong>Water</strong> <strong>and</strong> <strong>Wastewater</strong> <strong>Export</strong> <strong>Market</strong> <strong>Plan</strong><br />
53
new effluent st<strong>and</strong>ards. At the outset, the new st<strong>and</strong>ards<br />
will apply only to larger firms, but voluntary compliance<br />
is beginning to drive the dem<strong>and</strong> from smaller scale operations.<br />
Many industrial parks or groups of smaller companies<br />
seek to install common treatment facilities to share<br />
design, construction, <strong>and</strong> maintenance costs. The largest<br />
dem<strong>and</strong> exists in the sugar, beverage, petroleum, petrochemical,<br />
chemical, iron <strong>and</strong> steel, food processing, pulp<br />
<strong>and</strong> paper, <strong>and</strong> textile industries.<br />
A number of constraints affect U.S. participation in<br />
the market for industrial wastewater treatment. The cost<br />
of capital remains high in Mexico, <strong>and</strong> many industrial<br />
customers are looking for relatively inexpensive shortterm<br />
solutions. Equipment that can be retrofitted to existing<br />
production systems is generally preferable to<br />
equipment that requires re-engineered technological processes.<br />
The best opportunities in industrial wastewater<br />
treatment are for ion exchangers, reverse osmosis modules,<br />
analyzers, chemical purifiers, automatic control instrumentation,<br />
etc.<br />
In addition, systems designed for use in the United<br />
States tend to be engineered to minimize the number of<br />
required operators or technicians. This important selling<br />
point in the United States may hinder sales in Mexico.<br />
For one, many water utilities <strong>and</strong> industrial facilities in<br />
Mexico are more comfortable operating treatment plants<br />
manually instead of using sophisticated, automated systems,<br />
<strong>and</strong> believe that manual operation is a less expensive<br />
approach given Mexico’s low labor costs. U.S. firms<br />
must assess the degree to which their systems can be<br />
adapted to substitute labor for capital intensity, as well<br />
as educate their Mexican clients on the benefits of applying<br />
advanced, labor-reducing technologies.<br />
Many companies also seek firms that can demonstrate<br />
technology performance under Mexican conditions. This<br />
is the result of Mexican clients’ unwillingness to accept<br />
perceived technology risk. Some foreign firms address<br />
this issue by initially accepting low profit margins in order<br />
to establish a track record in Mexico.<br />
Finally, finding industrial wastewater treatment<br />
projects can be difficult. One strategy to circumvent this<br />
problem is to be in constant communication with chambers<br />
of commerce, associations, <strong>and</strong> industrial groups in<br />
Mexico.<br />
Republic of Korea (South Korea)<br />
Population: 47 million (2000)<br />
Urban population: 82 percent (2000)<br />
GNP per capita: $8,490 (1999)<br />
GDP average annual growth rate: 6.1 percent (1990–1998)<br />
54 U.S. Department of Commerce, International Trade Administration<br />
<strong>Water</strong> supply coverage (urban/rural): 97 percent/<br />
71 percent (2000)<br />
Sanitation coverage (urban/rural): 76 percent/<br />
4 percent (2000)<br />
<strong>Market</strong> Overview<br />
South Korea has made a substantial effort to provide<br />
adequate, clean water for its population. However, water<br />
resources remain at risk in terms of quantity <strong>and</strong> quality.<br />
With further urbanization <strong>and</strong> industrialization, the dem<strong>and</strong><br />
for water is on the rise. Many conventional water<br />
sources have already been tapped <strong>and</strong> the main water<br />
sources are becoming increasingly contaminated. The<br />
growing disparity between water supply <strong>and</strong> dem<strong>and</strong> is<br />
likely to lead to more frequent, more prolonged, <strong>and</strong> more<br />
severe water shortages. South Korea’s anticipated water<br />
deficit will grow substantially over the next 10 years from<br />
702 to 2,011 million m 3 per year. On average, 28 percent<br />
of South Korea’s water is unaccounted for, due to unauthorized<br />
use <strong>and</strong> distribution system losses. 111<br />
Only 68 percent of municipal sewage is treated. To<br />
bring this rate up to 80 percent in 2005, the South Korean<br />
government has committed to exp<strong>and</strong>ing basic water<br />
treatment facilities <strong>and</strong> enhancing the management<br />
methods. In 2001 alone, the government will construct<br />
30 wastewater treatment facilities <strong>and</strong> 4,000 km of new<br />
pipeline at a value of $2.1 billion. 112<br />
The South Korean government is currently implementing<br />
a plan to clean up the four major river basins in Korea:<br />
the Han River, the Keum River, the Youngsan River,<br />
<strong>and</strong> the Nakdong River. The Four River Basin Project’s<br />
objective is to improve ambient water quality to make<br />
the rivers suitable to serve as drinking water sources. The<br />
project includes the construction of 199 new wastewater<br />
treatment plants worth a total of $8.8 billion in investments<br />
by 2005. 113<br />
The dem<strong>and</strong> for water <strong>and</strong> wastewater technologies<br />
in South Korea went down briefly as a result of the 1997-<br />
1998 economic crisis but recovered quickly due to the<br />
successful large-scale corporate restructuring <strong>and</strong> the introduction<br />
of government incentives for foreign investment<br />
in South Korea.<br />
The U.S. State Department estimates that the market<br />
size of South Korea’s water pollution control sector in<br />
111. Lee Boug Young, <strong>Water</strong> Korea (on the Internet at http://<br />
my.netian.com/~watopia/index.html ).<br />
112. Projects in 2001, Ministry of Environment, Republic of Korea,<br />
2001 (www.me.go.kr/english/newindex.html).<br />
113. Rivers <strong>and</strong> Reservoirs Clean-Up Project in Korea, U.S. Department<br />
of Commerce, International Trade Administration, 1999.
2000 was $3.4 billion. 114 Government spending on water<br />
<strong>and</strong> wastewater is another indicator of market size.<br />
In 1999, for example, the South Korean government budgeted<br />
approximately $500 million for water <strong>and</strong> wastewater<br />
infrastructure improvements, including $200<br />
million for water treatment <strong>and</strong> $300 million for wastewater<br />
treatment. 115<br />
Regulatory <strong>and</strong> Institutional Framework<br />
Several ministries <strong>and</strong> agencies in South Korea are involved<br />
in water <strong>and</strong> wastewater issues. The Ministry of<br />
Environment administers the <strong>Water</strong> Supply Act, the Sewerage<br />
Act, the <strong>Water</strong> Quality Preservation Act (which<br />
regulates industrial effluents), <strong>and</strong> the Environmental<br />
Policy Act, <strong>and</strong> is responsible for regulating, monitoring,<br />
<strong>and</strong> enforcing water quality control. The Ministry<br />
of Construction <strong>and</strong> Transportation <strong>and</strong> the state-owned<br />
Korea <strong>Water</strong> Resources Corporation (KOWACO) play<br />
the lead roles in water resources development <strong>and</strong> management,<br />
<strong>and</strong> infrastructure project implementation. Local<br />
governments have the responsibility to provide water<br />
<strong>and</strong> wastewater services to the population. At the same<br />
time, many other Korean agencies have overlapping water<br />
pollution control responsibilities, resulting in significant<br />
management inefficiencies.<br />
Among the Ministry of the Environment’s major objectives<br />
for 2001 are the establishment of a drinking water<br />
dem<strong>and</strong> management system <strong>and</strong> comprehensive<br />
water pollution control programs. The Ministry’s activities<br />
will include:<br />
• The establishment of m<strong>and</strong>atory water dem<strong>and</strong><br />
management practices for water suppliers (for local<br />
governments <strong>and</strong> KOWACO) <strong>and</strong> every public<br />
institution;<br />
• The introduction of water-saving companies to<br />
promote the use of water conservation <strong>and</strong> water<br />
recycling equipment;<br />
• The promulgation of more stringent water quality<br />
st<strong>and</strong>ards; <strong>and</strong><br />
• The enactment <strong>and</strong> implementation of special<br />
management laws for each of the four main river<br />
basins, including more stringent effluent regulations<br />
<strong>and</strong> rigorous water monitoring systems. 116<br />
114. FY 2001 Country Commercial Guide: Korea, U.S. Foreign <strong>and</strong><br />
Commercial Service <strong>and</strong> U.S. Department of State, 2000.<br />
115. Environmental <strong>Market</strong> Outlook for Korea, U.S. Department of<br />
Commerce, International Trade Administration, 2000.<br />
116. Projects in 2001, Ministry of Environment, Republic of Korea,<br />
2001 (www.me.go.kr/english/newindex.html ).<br />
Privatization<br />
South Korea is beginning to undertake privatization<br />
of the water industry. South Korea’s privatization plans<br />
were first formulated in 1995. The government hopes that<br />
privatization will reduce the financial burden on central<br />
<strong>and</strong> local governments, accelerate the completion of water<br />
<strong>and</strong> wastewater infrastructure projects, promote the<br />
reform of local governments’ ineffective management<br />
systems, trim payrolls, <strong>and</strong> introduce the latest environmental<br />
technologies <strong>and</strong> services to South Korea.<br />
Municipal water <strong>and</strong> wastewater utilities will mostly<br />
be privatized under a BOT system <strong>and</strong> will be eventually<br />
returned to the South Korean government. Presently,<br />
a portion of the water systems controlled by KOWACO<br />
are managed by private operators under franchise<br />
agreements. 117<br />
Trade <strong>and</strong> Investment Policy<br />
In line with its multilateral trade <strong>and</strong> other commitments,<br />
including those with international financial institutions,<br />
South Korea has undertaken changes in its trade<br />
policy framework. Import tariff rates have been adjusted<br />
in accordance with South Korea’s binding WTO commitments.<br />
Presently, import duties for pollution control<br />
equipment are at about 6 percent. Efforts have also been<br />
made to streamline customs clearance procedures by,<br />
among others, introducing an immediate release system<br />
<strong>and</strong> the progressive introduction of an electronic clearance<br />
system.<br />
In addition to advance implementation of the WTO<br />
agreement on trade-related aspects of intellectual property<br />
rights, protection of such rights has been strengthened<br />
by new treaties, increased international cooperation,<br />
<strong>and</strong> stricter enforcement. The 1998 Foreign Investment<br />
Promotion Act has opened 99 percent of industrial sectors<br />
to foreign investment, simplified administrative procedures,<br />
<strong>and</strong> exp<strong>and</strong>ed tax incentives for high-technology<br />
investments. Trade <strong>and</strong> foreign investment liberalization<br />
has also contributed to intensified competition in the domestic<br />
market.<br />
The United States is one of South Korea’s main trading<br />
partners (in addition to the European Union <strong>and</strong> Japan).<br />
In fact, South Korea is the United States’<br />
sixth-largest export market, bigger than those of Australia,<br />
Brazil, China, France, or Italy. U.S. exports to South<br />
Korea are increasing <strong>and</strong> are expected to continue to show<br />
double-digit growth. The European Union is the main<br />
competitor in this market <strong>and</strong> has overtaken the United<br />
117. Rivers <strong>and</strong> Reservoirs Clean-Up Project in Korea, U.S. Department<br />
of Commerce, International Trade Administration, 1999.<br />
<strong>Water</strong> <strong>and</strong> <strong>Wastewater</strong> <strong>Export</strong> <strong>Market</strong> <strong>Plan</strong><br />
55
States as South Korea’s largest investor. 118 Although there<br />
is no bilateral trade agreement between the United States<br />
<strong>and</strong> South Korea presently, both parties have been working<br />
toward crafting one.<br />
U.S. <strong>Market</strong> Share <strong>and</strong> Competition<br />
Local manufacturing accounts for 60 percent of South<br />
Korea’s water <strong>and</strong> wastewater market. Almost all municipal<br />
water <strong>and</strong> wastewater treatment projects in South<br />
Korea have been awarded to large local environmental<br />
engineering <strong>and</strong> construction companies, many of which<br />
are affiliated with such large industrial conglomerates as<br />
Hyundai, Samsung, Sunkyoung, Ssangyong, Halla, <strong>and</strong><br />
Lotte. However, in order to be competitive, South Korean<br />
companies need state-of-the-art technology, much<br />
of which is offered by U.S. suppliers.<br />
Some South Korean companies invest in the development<br />
of cutting-edge technologies (for example, Keumho<br />
Construction has invested $2 million to design a highefficiency<br />
wastewater treatment process) <strong>and</strong> often look<br />
for joint venture partners to leverage their capacity. These<br />
joint ventures offer excellent opportunities for U.S. companies<br />
<strong>and</strong> provide a source of superior technology for<br />
South Korean projects. It is important to note, however,<br />
that the South Korean government is investing heavily<br />
in the growth of its own environmental technology industry.<br />
Eventually, even a larger share of market dem<strong>and</strong><br />
will be met domestically. For now, however, U.S. companies<br />
can still play a large role in the South Korean water<br />
<strong>and</strong> wastewater market.<br />
Currently, the U.S. share of the South Korean environmental<br />
market is 20 percent. 119 The information on<br />
the U.S. share of the water <strong>and</strong> wastewater market was<br />
unavailable at the time of this writing.<br />
International reputation, reliability, <strong>and</strong> price are the<br />
most important factors in government procurement decisions<br />
for municipal projects in South Korea. Product<br />
specifications are determined by the state-run Environmental<br />
Management Corporation, <strong>and</strong> the equipment is<br />
purchased through the Supply Administration of the Republic<br />
of South Korea.<br />
<strong>Market</strong> Opportunities<br />
In 1996, the South Korean government established<br />
comprehensive measures for water quality management.<br />
Under these measures, the government will invest $23.8<br />
billion in the construction of municipal wastewater treat-<br />
118. FY 2001 Country Commercial Guide: Korea, U.S. Foreign <strong>and</strong><br />
Commercial Service <strong>and</strong> U.S. Department of State, 2000.<br />
119. Ibid.<br />
56 U.S. Department of Commerce, International Trade Administration<br />
ment facilities by 2005 <strong>and</strong> $51.8 billion in the water supply<br />
infrastructure by 2011. 120<br />
The Four River Basin Project offers abundant opportunities<br />
related to large infrastructure projects. Its<br />
Nakdong River clean-up includes $52.3 million for the<br />
construction of new sewage treatment plants, $114.3 million<br />
for municipal wastewater treatment upgrades, <strong>and</strong><br />
$93.9 million for the rehabilitation of the sewerage network<br />
in the Taegu metropolitan area. The Youngsan River<br />
clean-up includes the construction of 37 new municipal<br />
wastewater treatment plants worth $1.5 billion in the<br />
Kwangju metropolitan area. Under the Keum River cleanup,<br />
the government will finance the construction of 25<br />
municipal <strong>and</strong> 10 industrial wastewater treatment plants.<br />
Finally, the Han River <strong>and</strong> Paldang Reservoir component<br />
will pay for the construction of sewage treatment<br />
facilities in rural areas ($739 million) <strong>and</strong> industrial effluent<br />
treatment plants at local industrial estates ($467<br />
million). And these are just the main line items of the<br />
Four River Basin Project. 121<br />
The best market opportunities for U.S. water <strong>and</strong><br />
wastewater equipment companies in South Korea include<br />
the export of advanced wastewater treatment processes<br />
<strong>and</strong> technologies, water recycling technology, <strong>and</strong> other<br />
areas of advanced technology.<br />
Saudi Arabia<br />
Population: 22 million (2000)<br />
Urban population: 86 percent (2000)<br />
GNP per capita: $6,910 (1998) 122<br />
GDP average annual growth rate 1.6 percent (1990–1998)<br />
<strong>Water</strong> supply coverage (urban/rural): 100 percent/<br />
64 percent (2000)<br />
Sanitation coverage (urban/rural): 98 percent/<br />
91 percent (2000)<br />
<strong>Market</strong> Overview<br />
Saudi Arabia is an arid country with severe climate<br />
conditions <strong>and</strong> an absence of natural fresh water resources<br />
as well as high population growth, rapid urbanization,<br />
industrialization, <strong>and</strong> agricultural development, all of<br />
which make water one of the country’s most precious<br />
resources. The World Bank estimated that in 2000, Saudi<br />
120. Goals <strong>and</strong> Strategies for Providing Clean <strong>Water</strong>, Ministry of<br />
Environment, Republic of Korea, 2000 (www.me.go.kr/english/sub/<br />
c1_1.htm).<br />
121. Rivers <strong>and</strong> Reservoirs Clean-Up Project in Korea, U.S. Department<br />
of Commerce, International Trade Administration, 1999.<br />
122. World Bank, World Development Indicators (Washington, D.C.:<br />
World Bank, 2000).
Arabia’s water dem<strong>and</strong> was five times the amount of<br />
available resources. 123<br />
Desalination is the largest market segment in the<br />
country’s water sector. Saudi Arabia relies on desalination<br />
to help meet the large dem<strong>and</strong> for water <strong>and</strong> has become<br />
the world’s largest producer of desalinated water,<br />
representing 30 percent of the world’s capacity.<br />
Desalinated water accounts for roughly 30 percent of<br />
Saudi Arabia’s water supply. Currently, the country operates<br />
25 desalination plants located at 15 major sites.<br />
Expenditures on desalination projects exceeded $6 billion<br />
during the Sixth <strong>Plan</strong> (1995-2000). The total desalination<br />
capacity was expected to reach 800 million gallons<br />
per day by the end of the year 2000. 124<br />
Saudi Arabia currently uses four major desalination<br />
processes: multi-stage flash evaporation, reverse osmosis,<br />
electrodialysis, <strong>and</strong> vapor compression. The evaporation<br />
process is used at more than 90 percent of the<br />
desalination plants.<br />
In 1998, the total market for desalination equipment<br />
in Saudi Arabia amounted to $357 million (the import<br />
market is 85 percent of the total) <strong>and</strong> was growing by 5<br />
percent annually. 125<br />
Saudi Arabia’s low supply of water resources has also<br />
created a significant dem<strong>and</strong> for wastewater treatment<br />
equipment <strong>and</strong> services. The total volume of wastewater<br />
generated in Saudi Arabia is 4 million tons per day, of<br />
which only 30 percent is treated. 126 It is estimated that<br />
40 percent of municipal sewage could be recycled after<br />
treatment.<br />
Regulatory <strong>and</strong> Institutional Framework<br />
The principal agency involved in Saudi Arabia’s environmental<br />
policy development is the Ministry of Defense<br />
<strong>and</strong> Aviation, which includes the Meteorological<br />
<strong>and</strong> Environmental Protection Agency. This agency is<br />
responsible for the design of environmental regulations<br />
<strong>and</strong> enforcing compliance. It also administers the Environmental<br />
Protection St<strong>and</strong>ards (1989), including effluent<br />
st<strong>and</strong>ards <strong>and</strong> reporting requirements for industry.<br />
New plants must use the best available technology to<br />
control their effluents.<br />
The agency’s enforcement tool is to inform sectoral<br />
licensing agencies about environmental violations <strong>and</strong><br />
123. The <strong>Water</strong>, <strong>Wastewater</strong> <strong>and</strong> Desalination <strong>Market</strong> in Saudi Arabia,<br />
Canada, Department of Foreign Affairs <strong>and</strong> International Trade, 1997.<br />
124. “Saudi Arabia: Desalination Industry,” Industry Sector Analysis,<br />
U.S. <strong>and</strong> Foreign Commercial Service <strong>and</strong> U.S. Department of<br />
State, 1999.<br />
125. Ibid.<br />
126. The <strong>Water</strong>, <strong>Wastewater</strong> <strong>and</strong> Desalination <strong>Market</strong> in Saudi Arabia,<br />
Canada, Department of Foreign Affairs <strong>and</strong> International Trade, 1997.<br />
request the suspension of the violators’ operating licenses.<br />
At the same time, its effectiveness as an enforcement<br />
agency is hampered by its position within the Ministry<br />
of Defense <strong>and</strong> Aviation (the country’s largest <strong>and</strong> most<br />
powerful ministry), where environmental issues are not<br />
a priority.<br />
The other two important national agencies in the water<br />
sector are the Ministry of Agriculture <strong>and</strong> <strong>Water</strong> <strong>and</strong><br />
the Ministry of Municipal <strong>and</strong> Rural Development. Local<br />
governments are responsible for water resources management<br />
within their jurisdictions. However, they are<br />
typically more concerned about economic growth than<br />
resource conservation.<br />
The Saline <strong>Water</strong> Conversion Corporation (SWCC) is<br />
the sole government entity responsible for desalination<br />
projects under construction <strong>and</strong> the expansion of desalination<br />
plants.<br />
Privatization<br />
The Saudi Arabian leadership has embarked on a comprehensive<br />
restructuring of the entire Saudi economy.<br />
Annual population growth rates of over 3 percent,<br />
coupled with depressed levels of foreign investment, have<br />
led the government to place strong new emphasis on private<br />
sector expansion. Although desalination as well as<br />
municipal water <strong>and</strong> wastewater treatment are presently<br />
entirely in the government’s h<strong>and</strong>s, this is likely to change<br />
in the near future. Given the fall in oil prices over the<br />
last decade <strong>and</strong> the corresponding drop in government<br />
revenues, the Saudi private sector is likely to gradually<br />
take over the construction, operation, <strong>and</strong> maintenance<br />
of water desalination projects on a BOT basis.<br />
Trade <strong>and</strong> Investment Policy<br />
Saudi Arabia’s Council of Ministers recently approved<br />
a new Foreign Direct Investment Code, which establishes<br />
a framework for future legislative <strong>and</strong> regulatory activities<br />
aimed at enhancing the country’s investment climate.<br />
It permits foreign investment in all but a few sectors <strong>and</strong><br />
relaxes rules restricting foreign ownership of local businesses.<br />
The Council of Ministers also approved the establishment<br />
of the Saudi Arabian General Investment<br />
Authority to provide information <strong>and</strong> assistance to foreign<br />
investors.<br />
Saudi Arabia is currently in the process of accession<br />
to the WTO. Once the country is admitted, its trade regime<br />
(currently plagued with regulatory <strong>and</strong> bureaucratic<br />
barriers) should become more transparent <strong>and</strong> accommodating<br />
to foreign businesses.<br />
There are no restrictions on the import of water equipment<br />
into Saudi Arabia, although it is subject to a 12 per-<br />
<strong>Water</strong> <strong>and</strong> <strong>Wastewater</strong> <strong>Export</strong> <strong>Market</strong> <strong>Plan</strong><br />
57
cent tariff. Items manufactured locally are usually granted<br />
protection by raising the duty on similar imported items<br />
to 20 percent. All desalination equipment items <strong>and</strong> parts<br />
are exempted from any tariff duty if they are imported<br />
by or for plants run by the SWCC.<br />
Although exporters are not required to appoint a local<br />
Saudi Arabian agent to sell to local companies, commercial<br />
regulations restrict importing <strong>and</strong> direct commercial<br />
marketing to wholly owned Saudi Arabian companies.<br />
In practice, local agents are a requirement. Agent/distributor<br />
relations are the responsibility of Saudi Arabia’s Ministry<br />
of Commerce.<br />
Direct marketing does not play a large role in Saudi<br />
Arabia. Many forms of Western advertising are unacceptable<br />
due to Islamic religious beliefs <strong>and</strong> practices. Instead,<br />
personal relationships between buyers <strong>and</strong> sellers<br />
play a much stronger role in export success.<br />
U.S. <strong>Market</strong> Share <strong>and</strong> Competition<br />
The dem<strong>and</strong> for increased desalination capacity generates<br />
tough competition between Saudi firms <strong>and</strong> foreign<br />
companies from Japan, the United States, Korea,<br />
Germany, <strong>and</strong> Italy.<br />
Local production of water equipment is minimal in<br />
Saudi Arabia, accounting for about $5 million annually.<br />
For instance, about 98 percent of pumps, valves, <strong>and</strong> compressors<br />
are imported. 127 However, domestic firms<br />
receive preferential treatment <strong>and</strong> are becoming more<br />
competitive as they increase their involvement in the<br />
market.<br />
Domestically, five plants manufacture filters, pipes,<br />
treatment chemicals, sterilization units, <strong>and</strong> membranes<br />
used mainly in reverse osmosis systems. Two Saudi companies,<br />
Al-Kawther <strong>and</strong> Metito, are the most advanced<br />
in the design, manufacture, <strong>and</strong> commissioning of reverse<br />
osmosis plants in the country.<br />
More than 30 foreign companies are active in Saudi<br />
Arabia’s desalination industry. In 1998, U.S. firms had a<br />
16 percent share of the import market for desalination<br />
equipment (see Figure 4.5). U.S. assistance to the SWCC<br />
resulted in a better underst<strong>and</strong>ing of various desalination<br />
techniques used in the United States <strong>and</strong> how these techniques<br />
could be applicable to Saudi needs. U.S. companies<br />
dominate the Saudi market for reverse osmosis<br />
technology. U.S. firms have also supplied turbines, boilers,<br />
<strong>and</strong> generators for many multi-stage flash evaporation<br />
plants, although as of 1999, only two U.S. companies<br />
(Riley-Beaird <strong>and</strong> IHI) were prequalified with SWCC to<br />
supply multi-stage flash evaporation systems.<br />
127. The <strong>Water</strong>, <strong>Wastewater</strong> <strong>and</strong> Desalination <strong>Market</strong> in Saudi Arabia,<br />
Canada, Department of Foreign Affairs <strong>and</strong> International Trade, 1997.<br />
58 U.S. Department of Commerce, International Trade Administration<br />
Figure 4.5. Import <strong>Market</strong> Shares for Desalination<br />
Equipment in Saudi Arabia<br />
South<br />
Korea<br />
14%<br />
Italy<br />
11%<br />
Germany<br />
15%<br />
Both European <strong>and</strong> Japanese companies provide comprehensive<br />
work guarantees to the SWCC. U.S. firms,<br />
on the other h<strong>and</strong>, typically provide only manufacturer<br />
warranties for installed equipment, thereby reducing their<br />
competitiveness. Moreover, European <strong>and</strong> Japanese firms<br />
outnumber U.S. companies on the list of prequalified<br />
firms. Since many of the Saudi desalination plants were<br />
built by Japanese <strong>and</strong> European firms, most of the equipment<br />
<strong>and</strong> materials is sourced accordingly. Japanese,<br />
German, <strong>and</strong> Swiss consultants are major players in this<br />
industry, recommending specifications that favor companies<br />
from their countries.<br />
The Saudi government follows a long-st<strong>and</strong>ing policy<br />
of encouraging locally made products <strong>and</strong> services.<br />
Therefore, a good way for new firms to enter the market<br />
is by establishing joint ventures with reputable Saudi<br />
companies. Since all desalination plants are built on<br />
a “turnkey basis,” preference is usually given to<br />
prequalified foreign bidders having a business relationship<br />
with a Saudi company. Saudi regulations require any<br />
foreign company that obtains a contract with the government<br />
to appoint a Saudi service agent.<br />
<strong>Market</strong> Opportunities<br />
Other<br />
6%<br />
Japan<br />
38%<br />
United States<br />
16%<br />
Source: Canada, Department of Foreign Affairs <strong>and</strong> International<br />
Trade, The <strong>Water</strong>, <strong>Wastewater</strong> <strong>and</strong> Desalination <strong>Market</strong> in Saudi<br />
Arabia, (Ottawa, 1997).<br />
Desalination capacity development will remain a priority<br />
of the Saudi government for generations to come.<br />
Investment by the SWCC is expected to bring the production<br />
capacity to 1.3 billion gallons per day by the year
2010. 128 New desalination projects are directed toward<br />
reducing the cost of desalinated water through the optimization<br />
of chemical consumption <strong>and</strong> design <strong>and</strong> process<br />
improvements.<br />
Given that most desalination plants in Saudi Arabia<br />
use the multi-stage flash evaporation system (SWCC officials<br />
believe that the process works very well <strong>and</strong> requires<br />
less maintenance than reverse osmosis systems),<br />
ample opportunities exist for sales <strong>and</strong> service of turbines,<br />
boilers, generators, <strong>and</strong> anti-scaling chemicals. Membranes,<br />
filters, <strong>and</strong> treatment chemicals will be also be<br />
in dem<strong>and</strong>, especially at reverse osmosis installations.<br />
New technology that reduces both construction <strong>and</strong> production<br />
costs will also do well in the Saudi market. After-sale<br />
service <strong>and</strong> maintenance are usually key<br />
components of any turnkey contract with the SWCC.<br />
As water becomes increasingly expensive in Saudi<br />
Arabia, Saudi industries seeking to improve their bottom<br />
line will also present opportunities for U.S. exporters<br />
of water conservation technologies.<br />
Spain<br />
Population: 40 million (2000)<br />
Urban population: 78 percent (2000)<br />
GNP per capita: $14,000 (1999)<br />
GDP average annual growth rate: 1.9 percent (1990–1998)<br />
<strong>Water</strong> supply coverage (total): 91 percent (1998) 129<br />
Sanitation coverage (total): 60 percent (1998) 130<br />
<strong>Market</strong> Overview<br />
In the 1990s, almost all Spanish municipalities with<br />
more than 20,000 inhabitants had a sewer system, but<br />
only 60 percent of all wastewater was treated. In 1997,<br />
15 percent of households were served by primary treatment<br />
plants only, while 44 percent were connected to<br />
secondary municipal wastewater treatment plants. 131<br />
Although significant progress has been made over the<br />
past two decades in building new municipal sewage treatment<br />
plans, the installed capacity, particularly in rural<br />
areas, needs to be enhanced considerably. Industrial<br />
128. “Saudi Arabia: Desalination Industry,” Industry Sector Analysis,<br />
U.S. <strong>and</strong> Foreign Commercial Service <strong>and</strong> U.S. Department of<br />
State, 1999.<br />
129. Spain: Environmental <strong>Technologies</strong>, <strong>Market</strong> Brief, Showcase<br />
Europe (www.sce.doc.gov), U.S. Department of Commerce, International<br />
Trade Administration, 1998.<br />
130. Ibid.<br />
131. The <strong>Water</strong>, <strong>Wastewater</strong> <strong>and</strong> Desalination <strong>Market</strong> in Spain,<br />
Canada, Department of Foreign Affairs <strong>and</strong> International Trade, 1998.<br />
wastewater treatment is often inadequate, with direct discharges<br />
polluting coastal waters, <strong>and</strong> indirect discharges<br />
damaging municipal sewerage infrastructure. The main<br />
water-polluting industries include chemical, power, steel<br />
<strong>and</strong> non-ferrous metallurgy, textiles, <strong>and</strong> construction.<br />
Drinking water shortages are one of Spain’s top environmental<br />
priorities. <strong>Water</strong> resources are severely depleted,<br />
<strong>and</strong> the deficit is made up through the overuse of<br />
aquifers. The problem is particularly acute in the Canary<br />
Isl<strong>and</strong>s, Balearic Region, Costa del Sol, Almería, Murcia,<br />
<strong>and</strong> Alicante regions. The growing water shortages create<br />
a dem<strong>and</strong> for water desalination projects. Spain currently<br />
has the greatest desalination capacity in Europe,<br />
most of it represented by reverse osmosis technology.<br />
The size of Spain’s water <strong>and</strong> wastewater market is<br />
estimated at about $4 billion annually. The Ministry of<br />
Environment estimates that the National Sewerage <strong>and</strong><br />
<strong>Wastewater</strong> Treatment <strong>Plan</strong> (1995–2005) will require a<br />
total investment of $14 billion, with more than 50 percent<br />
of this amount invested in new wastewater treatment<br />
plants <strong>and</strong> just over 40 percent used to exp<strong>and</strong> sewerage<br />
networks. Spain’s central government is expected to contribute<br />
about a quarter of this amount. 132<br />
Regulatory <strong>and</strong> Institutional Framework<br />
EU Directive 91/271 on wastewater treatment is the<br />
single most important regulation affecting investment in<br />
municipal sewerage infrastructure in Spain. According<br />
to the Directive, all communities with populations of<br />
more than 15,000 residents had to have fully functioning<br />
wastewater collection <strong>and</strong> treatment systems by the<br />
year 2000, <strong>and</strong> all smaller communities by 2005.<br />
Spain’s <strong>Water</strong> Law requires industrial <strong>and</strong> municipal<br />
polluters to pay effluent fees for direct discharges into<br />
surface waters. The Directorate-General of Hydraulic<br />
Works <strong>and</strong> <strong>Water</strong> Quality sets the charge structure <strong>and</strong><br />
level (based on effluent parameters <strong>and</strong> rates per unit),<br />
which are applied by local drainage basin authorities.<br />
Municipalities are responsible for drinking water supply<br />
<strong>and</strong> wastewater treatment. They also administer licenses<br />
for industrial discharges into municipal sewer<br />
systems. Indirect discharges are subject to service fees<br />
that sometimes take into account pollutant concentrations,<br />
but most often are volume-based. Fines for noncompliance<br />
with pretreatment st<strong>and</strong>ards range from $10,000 to<br />
$100,000.<br />
132. Spain Environmental <strong>Technologies</strong> <strong>Export</strong> <strong>Market</strong> <strong>Plan</strong>, U.S.<br />
Department of Commerce, International Trade Administration, 1998.<br />
<strong>Water</strong> <strong>and</strong> <strong>Wastewater</strong> <strong>Export</strong> <strong>Market</strong> <strong>Plan</strong><br />
59
Privatization<br />
Urban water <strong>and</strong> wastewater services in Spain have<br />
traditionally been provided by a mix of public <strong>and</strong> private<br />
institutions. In water supply, public entities deliver<br />
72 percent of water, private enterprises 26 percent, <strong>and</strong><br />
mixed ownership companies the remaining 2 percent. The<br />
role of the private sector has become more prominent in<br />
recent years with the influx of foreign water companies<br />
into the Spanish market. Private water management systems<br />
are more common in larger municipalities. About<br />
87 percent of wastewater utilities are managed directly<br />
by municipalities, with private companies playing a much<br />
smaller role.<br />
Trade <strong>and</strong> Investment Policy<br />
Spanish import duties are equal to the Common <strong>Market</strong><br />
External Tariff for non-EU goods, while there are no<br />
duties imposed on products imported from within the EU,<br />
giving EU suppliers a significant price advantage. In addition,<br />
water <strong>and</strong> wastewater equipment must be certified<br />
to meet EU environmental st<strong>and</strong>ards. There are no<br />
barriers to foreign investment in Spain.<br />
U.S. <strong>Market</strong> Share <strong>and</strong> Competition<br />
About 90 companies, of which 70 are public, control<br />
the water sector in Spain. Local production meets about<br />
three-quarters of the market dem<strong>and</strong>. 133 Several Spanish<br />
companies manufacture water <strong>and</strong> wastewater equipment,<br />
producing mostly pumps, turbines, filters, <strong>and</strong> chemicals.<br />
However, specialized <strong>and</strong> high technology equipment is<br />
mostly imported. Imports also play an important role in<br />
the desalination market segment.<br />
The primary competitors for U.S. companies are<br />
French <strong>and</strong> British firms. Vivendi <strong>and</strong> ONDEO have been<br />
particularly successful in Spain. Vivendi operates in Spain<br />
under the trade name Sociedad Mediterranea de Agua <strong>and</strong><br />
has acquired a large share of private business in the sector.<br />
ONDEO is a partner in the Aguas de Barcelona consortium<br />
which has been exp<strong>and</strong>ing rapidly over the last<br />
several years.<br />
Leading banking institutions, as well as former stateowned<br />
companies that were recently privatized, electric<br />
utilities, as well as other Spanish firms, have been organizing<br />
joint ventures <strong>and</strong> consortia to bid for water contracts.<br />
The best way for U.S. equipment suppliers to enter<br />
the Spanish market is to enter such joint ventures.<br />
133. FY 2001 Country Commercial Guide: Spain, U.S. <strong>and</strong> Foreign<br />
Commercial Service <strong>and</strong> U.S. Department of State, 2000.<br />
60 U.S. Department of Commerce, International Trade Administration<br />
<strong>Market</strong> Opportunities<br />
<strong>Market</strong> opportunities are expected to focus on the expansion<br />
of existing sewerage networks, with smaller communities<br />
connecting their sewer systems with larger<br />
municipalities in an effort to cut costs. Close to 3,200<br />
wastewater treatment plants need upgrading to meet the<br />
requirements of the EU Directive, requiring an investment<br />
estimated at about $1.4 billion until 2005. 134 Investment<br />
is expected to be concentrated around coastal<br />
areas <strong>and</strong> smaller inl<strong>and</strong> population centers.<br />
The following is a list of water <strong>and</strong> wastewater projects<br />
in Spain launched with financial support from the European<br />
Investment Bank in the last three years:<br />
• Improvements to wastewater collection <strong>and</strong> treatment<br />
facilities in the Catalonia Region ($90.1<br />
million);<br />
• Improvements to water supply infrastructure <strong>and</strong><br />
forestry development in Castilla <strong>and</strong> León ($33.5<br />
million);<br />
• Construction <strong>and</strong> extension of the wastewater<br />
treatment system on Balearic Isl<strong>and</strong>s ($13.5 million);<br />
• Improvements to wastewater collection <strong>and</strong> treatment<br />
facilities in the Valencia Region ($42.0 million);<br />
<strong>and</strong><br />
• Improvements to road, drinking water supply, <strong>and</strong><br />
wastewater collection <strong>and</strong> treatment infrastructure in<br />
the autonomous region of Extremadura ($48.1<br />
million).<br />
The best sales prospects for U.S. water <strong>and</strong> wastewater<br />
equipment exporters include meters, reverse osmosis<br />
equipment for desalination plants, membranes, <strong>and</strong> control<br />
instrumentation.<br />
Taiwan<br />
Population: 22 million (2000) 135<br />
Urban population: not available<br />
GNP per capita: $13,535 (1999)<br />
GDP average annual growth rate: 7.6 percent (1990–1998)<br />
<strong>Water</strong> supply coverage (urban/rural): not available<br />
Sanitation coverage (urban/rural): 36 percent/<br />
18 percent (2000)<br />
134. The <strong>Water</strong>, <strong>Wastewater</strong> <strong>and</strong> Desalination <strong>Market</strong> in Spain,<br />
Canada, Department of Foreign Affairs <strong>and</strong> International Trade, 1998.<br />
135. All the presented general statistical data for Taiwan has been<br />
taken from the Taiwan Monthly Bulletin of Statistics, Taiwan’s Directorate<br />
General of Budget, Accounting, <strong>and</strong> Statistics, 2001.
<strong>Market</strong> Overview<br />
Taiwan’s rivers serve as the primary source of drinking<br />
water for over three-quarters of the country’s population.<br />
About 40 percent of surface waters in Taiwan are<br />
categorized by the government as polluted. Domestic<br />
sewage, industrial effluents, <strong>and</strong> livestock wastes account<br />
for 43 percent, 32 percent, <strong>and</strong> 25 percent of water pollution<br />
load, respectively. 136<br />
The total water <strong>and</strong> wastewater market in Taiwan was<br />
estimated at $1.9 billion in 1999, with imports responsible<br />
for nearly 75 percent of the supply ($1.4 billion). 137<br />
Regulatory <strong>and</strong> Institutional Framework<br />
The <strong>Water</strong> Pollution Control Act <strong>and</strong> the Drinking<br />
<strong>Water</strong> Management Act form the legal foundation for<br />
water management in Taiwan. Under the <strong>Water</strong> Pollution<br />
Control Act, every industrial facility is required to<br />
submit a water pollution control plan to the Taiwan Environmental<br />
Protection Agency in order to obtain a m<strong>and</strong>atory<br />
discharge permit. Municipal wastewater treatment<br />
plants are also required to comply with effluent st<strong>and</strong>ards.<br />
Effluent st<strong>and</strong>ards are based on best available technology<br />
<strong>and</strong> were tightened significantly in 1997. At the same<br />
time, Taiwan strengthened its environmental monitoring<br />
<strong>and</strong> inspection system to ensure stricter enforcement.<br />
Penalties for violations are significant, up to $30,000 in<br />
fines <strong>and</strong> imprisonment.<br />
In 1998, Taiwan’s Environmental Protection Agency<br />
introduced wastewater discharge fees for industries, public<br />
wastewater utilities, <strong>and</strong> households. The industrial<br />
effluent fees are based on chemical oxygen dem<strong>and</strong>, suspended<br />
solids, <strong>and</strong> heavy metal content. The fees are being<br />
phased in through July 2002. 138<br />
The government-owned Taiwan <strong>Water</strong> Supply Corporation<br />
is responsible for large infrastructure development<br />
projects in the country. Local governments operate water<br />
<strong>and</strong> wastewater utilities.<br />
Privatization<br />
Taiwan’s Law for Promotion of Private Participation<br />
in Public Infrastructure Projects (also known as the “BOT<br />
Law”) was promulgated in February 2000. The law provides<br />
the basic legal framework for private-sector enti-<br />
136. “Taiwan: <strong>Water</strong> Pollution Prevention Equipment,” Industry Sector<br />
Analysis, U.S. <strong>and</strong> Foreign Commercial Service <strong>and</strong> U.S. Department<br />
of State, 1999.<br />
137. Ibid.<br />
138. <strong>Water</strong> Pollution Control Fees in Taiwan, U.S. Department of<br />
Commerce, International Trade Administration, 1998.<br />
ties to participate in public infrastructure projects in Taiwan<br />
<strong>and</strong> provides incentives for private participation. The<br />
government is currently designing the first BOT water<br />
infrastructure projects. 139<br />
Trade <strong>and</strong> Investment Policy<br />
There is no import tariff on environmental equipment<br />
in Taiwan. Moreover, Taiwanese companies buying such<br />
equipment are eligible for investment credits <strong>and</strong> lowinterest<br />
loans. Taiwan has long encouraged <strong>and</strong> facilitated<br />
direct foreign investment. Regulations affecting<br />
foreign-invested enterprises are generally transparent <strong>and</strong><br />
non-discriminatory.<br />
However, Taiwan’s public procurement practices constitute<br />
a significant trade barrier. There is often overt discrimination<br />
between local <strong>and</strong> foreign bidders on<br />
government contracts. Municipal governments in particular<br />
have been notably arbitrary in dealing with foreign<br />
contractors. Perhaps the most consistent complaint made<br />
by U.S. companies involves unfair terms <strong>and</strong> conditions<br />
required by the particular procuring entity. A new government<br />
procurement law was enacted in 1999 but will<br />
not be fully applicable to foreign bidders until Taiwan’s<br />
expected accession to WTO. 140<br />
U.S. <strong>Market</strong> Share <strong>and</strong> Competition<br />
Japan dominates the import market for water <strong>and</strong><br />
wastewater technologies with a 34 percent market share,<br />
followed by the United States with 28 percent <strong>and</strong> Germany<br />
with 14 percent (see Figure 4.6). Japanese firms<br />
have historically done very well in this market due to<br />
their strong reputation for after-sale service, high quality,<br />
<strong>and</strong> low price. The geographic proximity <strong>and</strong> cultural<br />
similarity add to the advantage of Japanese products. To<br />
be successful, U.S. companies need to convince Taiwanese<br />
end-users of their ability to offer top quality at a competitive<br />
price, while providing reliable local customer<br />
service. The establishment of a partnership with a local<br />
agent is seen as the most effective way to enter the Taiwanese<br />
market.<br />
Local firms are expected to play a larger role in the<br />
future, as they gain knowledge <strong>and</strong> technical expertise<br />
in the field. There are presently about 300 water <strong>and</strong><br />
wastewater equipment manufacturers in Taiwan. Most of<br />
them are small <strong>and</strong> medium-sized companies producing<br />
139. “Taiwan Law for Promotion of Private Participation,” International<br />
<strong>Market</strong> Insight, U.S. <strong>and</strong> Foreign Commercial Service <strong>and</strong> U.S.<br />
Department of State, 2000.<br />
140. Taiwan FY 2001 Country Commercial Guide, U.S. <strong>and</strong> Foreign<br />
Commercial Service <strong>and</strong> U.S. Department of State, 2000.<br />
<strong>Water</strong> <strong>and</strong> <strong>Wastewater</strong> <strong>Export</strong> <strong>Market</strong> <strong>Plan</strong><br />
61
Figure 4.6. Import <strong>Market</strong> Shares for <strong>Water</strong> <strong>and</strong><br />
<strong>Wastewater</strong> Equipment in Taiwan<br />
China<br />
3%<br />
Italy<br />
3%<br />
United<br />
Kingdom<br />
5%<br />
Germany<br />
14%<br />
technologically unsophisticated equipment, including<br />
pumps, blowers, valves, <strong>and</strong> simple filters.<br />
<strong>Market</strong> Opportunities<br />
The Taiwanese government is currently implementing<br />
an action plan to improve the water quality of<br />
Taiwan’s five major rivers (Five Rivers Project). Over<br />
$1 billion will be spent for the construction of 12 municipal<br />
wastewater collection <strong>and</strong> treatment systems between<br />
1999 <strong>and</strong> 2006. Size of the plants varies<br />
significantly between projects, ranging from 3,000 cubic<br />
meters per day to 120,000 cubic meters per day.<br />
Eighteen water treatment plants will be upgraded in<br />
the near future, eight of them under the Five Rivers<br />
Project. The largest water supply project is the $40 million<br />
water treatment plant expansion in Kaohsiung.<br />
The best prospects for U.S. suppliers include advanced<br />
wastewater treatment <strong>and</strong> recycling technologies, advance<br />
oxidation equipment, sophisticated membranes,<br />
heavy metal recovery equipment, etc.<br />
United Kingdom<br />
Other<br />
13%<br />
Source: U.S. <strong>and</strong> Foreign Commercial Service <strong>and</strong> U.S. Department<br />
of State, Industry Sector Analysis; Taiwan: <strong>Water</strong> Pollution Prevention<br />
Equipment (Washington, D.C., 1999).<br />
Population: 59 million (2000)<br />
Urban population: 89 percent (2000)<br />
GNP per capita: $22,640 (1999)<br />
Japan<br />
34%<br />
United States<br />
28%<br />
62 U.S. Department of Commerce, International Trade Administration<br />
GDP average annual growth rate: 2.2 percent (1990–1998)<br />
<strong>Water</strong> supply coverage (urban/rural): 100 percent/<br />
100 percent (2000)<br />
Sanitation coverage (urban/rural): 100 percent/<br />
100 percent (2000)<br />
<strong>Market</strong> Overview<br />
Over the last 10 years, the U.K. water <strong>and</strong> wastewater<br />
market has been driven by two main factors: the requirement<br />
placed upon the privatized utilities (see the<br />
Privatization section) to invest heavily in the delivery of<br />
water <strong>and</strong> wastewater services; <strong>and</strong> the impact of increasingly<br />
stringent EU water quality regulations.<br />
British water <strong>and</strong> wastewater companies spend about<br />
$5.5 billion every year on improving water supply <strong>and</strong><br />
sewerage services. 141 The annual market for water <strong>and</strong><br />
wastewater equipment was estimated at $4 billion in<br />
2000, including $1.2 billion in drinking water supply, $2<br />
billion in municipal <strong>and</strong> industrial wastewater treatment,<br />
<strong>and</strong> $0.8 billion in water cleanup. The market is growing<br />
at about 4 percent per year. 142<br />
Regulatory <strong>and</strong> Institutional Framework<br />
Britain’s water regulations reflect the provisions of the<br />
main EU Directives in this sector. The Drinking <strong>Water</strong><br />
Directive (1989) sets drinking water quality st<strong>and</strong>ards;<br />
the Bathing <strong>Water</strong> Directive (1991) establishes coastal<br />
water quality st<strong>and</strong>ards, <strong>and</strong> the Urban <strong>Wastewater</strong> Directive<br />
(1994) stipulates minimum st<strong>and</strong>ards for sewerage<br />
systems <strong>and</strong> sewage treatment.<br />
The water <strong>and</strong> wastewater industry in the United Kingdom<br />
is regulated by three main bodies: the Environment<br />
Agency, the Office of <strong>Water</strong> Services, <strong>and</strong> the Drinking<br />
<strong>Water</strong> Inspectorate. The Environment Agency <strong>and</strong> the<br />
Drinking <strong>Water</strong> Inspectorate are subordinated to the Department<br />
of the Environment, Transport, <strong>and</strong> the Regions,<br />
whose <strong>Water</strong> <strong>and</strong> L<strong>and</strong> Directorate oversees all waterrelated<br />
aspects of environmental policy.<br />
In 1996, the Environment Agency took over the functions<br />
of its predecessors, the National Rivers Authority,<br />
Her Majesty’s Inspectorate of Pollution, Waste Regulation<br />
Authorities <strong>and</strong> some sections of the Department of<br />
the Environment. It issues <strong>and</strong> enforces permits for both<br />
141. The Environmental Products <strong>and</strong> Services <strong>Market</strong> in the United<br />
Kingdom, Canada, Department of Foreign Affairs <strong>and</strong> International<br />
Trade (Ottawa, 2000).<br />
142. The U.K. Environmental Technology <strong>Market</strong>, U.S. Department<br />
of Commerce, International Trade Administration (Washington, D.C.,<br />
2000).
water abstractions <strong>and</strong> wastewater discharges, <strong>and</strong><br />
charges respective fees. It also has monitoring <strong>and</strong> inspection<br />
responsibilities.<br />
The Office of <strong>Water</strong> Services is an independent economic<br />
regulator with a duty to ensure that the water companies<br />
carry out <strong>and</strong> can finance their functions properly.<br />
It protects the interests of consumers, particularly where<br />
tariffs are concerned. It is also charged with facilitating<br />
competition <strong>and</strong> promoting the efficient use of water. The<br />
Office sets price caps for each company (thereby m<strong>and</strong>ating<br />
efficiency savings) for five-year intervals.<br />
The Drinking <strong>Water</strong> Inspectorate conducts inspections<br />
of water companies to ensure their compliance with the<br />
drinking water <strong>and</strong> other applicable technology st<strong>and</strong>ards.<br />
The Inspectorate investigates incidents that affect water<br />
quality <strong>and</strong> approves chemicals <strong>and</strong> materials used in<br />
treating water. New, more stringent drinking water quality<br />
st<strong>and</strong>ards were promulgated in 2000, with compliance<br />
required by the end of 2003.<br />
Privatization<br />
Under the <strong>Water</strong> Act of 1989, the United Kingdom<br />
restructured its water industry, privatizing all water <strong>and</strong><br />
wastewater operations in Engl<strong>and</strong> <strong>and</strong> Wales. Major driving<br />
forces behind the government’s privatization program<br />
were the lack of separation between the regulator <strong>and</strong><br />
the regulated entity, apparent inefficiencies, <strong>and</strong> the enormous<br />
investment needed to improve service <strong>and</strong> bring<br />
the water <strong>and</strong> wastewater systems up to EU environmental<br />
st<strong>and</strong>ards.<br />
Ten integrated water <strong>and</strong> wastewater companies replaced<br />
10 regional water authorities that had existed since<br />
1974. After the restructuring, 29 smaller statutory water<br />
companies (responsible for water supply only) continued<br />
to exist, although that number is now down to 17<br />
due to mergers. Some companies are now owned by foreign<br />
firms, including France’s Vivendi (which owns<br />
Three Valleys <strong>Water</strong>, North Surrey <strong>Water</strong>, <strong>and</strong> two other<br />
utilities) <strong>and</strong> ONDEO (which owns Northumbrian <strong>Water</strong><br />
<strong>and</strong> Essex <strong>and</strong> Suffolk <strong>Water</strong>). The U.S. firm Azurix<br />
owns Wessex <strong>Water</strong>. Many U.K. water companies have<br />
diversified into other utility services, <strong>and</strong> several (for<br />
example, Thames <strong>Water</strong>, Severn Trent, Anglian <strong>Water</strong>)<br />
have moved into the global market for water <strong>and</strong> wastewater<br />
services.<br />
Trade <strong>and</strong> Investment Policy<br />
The United Kingdom is one country where U.S exporters<br />
face very few real problems in doing business.<br />
The hurdles common in other countries, including dif-<br />
ferences in language, culture, legal <strong>and</strong> business practices,<br />
are largely absent.<br />
Most products (including machinery, electrical, <strong>and</strong><br />
electronic equipment) imported into the European Union<br />
must comply with the relevant EU st<strong>and</strong>ards <strong>and</strong> demonstrate<br />
this conformity by bearing the CE Mark. The<br />
CE Mark is a requirement for affected products regardless<br />
of their origin. Moreover, it removes the need to design<br />
products to comply with individual national sets of<br />
st<strong>and</strong>ards. An EU common external tariff applies to all<br />
non-EU imports.<br />
Procurement by the United Kingdom’s water <strong>and</strong><br />
wastewater companies is carried out in a number of ways,<br />
the most important of which are:<br />
• companies use their own lists of approved suppliers;<br />
• companies use commercial lists of pre-qualified/<br />
approved suppliers; or,<br />
• for large contracts, it may be necessary to follow EU<br />
procurement procedures.<br />
U.S. <strong>Market</strong> Share <strong>and</strong> Competition<br />
There is strong competition in the British water <strong>and</strong><br />
wastewater market for almost every product <strong>and</strong> service,<br />
with no one company enjoying a dominant position. The<br />
British industry is very strong in municipal water <strong>and</strong><br />
wastewater treatment, monitoring, <strong>and</strong> testing. There are<br />
close links between manufacturers, consultants, <strong>and</strong> the<br />
water <strong>and</strong> wastewater companies. At the same time, due<br />
to privatization <strong>and</strong> the United Kingdom’s EU membership,<br />
the competition includes a large <strong>and</strong> growing number<br />
of foreign suppliers. French, German, U.S., <strong>and</strong><br />
Japanese companies are the main foreign players in this<br />
market, followed by Canadian <strong>and</strong> Australian firms. Imports<br />
account for about 55 percent of the total market<br />
size.<br />
U.S. companies enjoy a 25 percent import market<br />
share. Dem<strong>and</strong> for most U.S. water <strong>and</strong> wastewater technologies<br />
is strong, with growth rates of 5 percent to 6<br />
percent per year expected in the near term. 143 The experience<br />
of foreign companies active in the United Kingdom<br />
suggests that the best way to enter this market is to<br />
work with a local partner rather than try to establish a<br />
local presence. 144<br />
143. International Business Development Office, State of Utah, 2000<br />
(www.utahtrade.com/KnowledgeCenter/World/countries/Uk/reports/<br />
uk-leading.htm).<br />
144. The Environmental Products <strong>and</strong> Services <strong>Market</strong> in the United<br />
Kingdom, Canada, Department of Foreign Affairs <strong>and</strong> International<br />
Trade (Ottawa, 2000).<br />
<strong>Water</strong> <strong>and</strong> <strong>Wastewater</strong> <strong>Export</strong> <strong>Market</strong> <strong>Plan</strong><br />
63
<strong>Market</strong> Opportunities<br />
British water <strong>and</strong> wastewater companies plan to invest<br />
$20 billion through 2004 to improve the quality <strong>and</strong><br />
efficiency of their services. The ambitious 1999-2004<br />
water quality improvement program includes:<br />
• Municipal wastewater treatment improvements<br />
covering 15 million customers;<br />
• Drinking water treatment improvements for 30<br />
million customers to reduce the risk from<br />
cryptosporidium;<br />
• Installation of treatment at water sources supplying<br />
17 million customers to reduce the amount of<br />
dissolved lead from plumbing;<br />
64 U.S. Department of Commerce, International Trade Administration<br />
• Rehabilitation of some 22,000 kilometers of water<br />
distribution mains to reduce water losses;<br />
• Installation of secondary treatment for all coastal<br />
discharges in towns with a population of over 2,000<br />
residents. 145<br />
This massive program will present many opportunities<br />
for U.S. suppliers of water <strong>and</strong> wastewater technologies<br />
<strong>and</strong> services. Aeration, screening <strong>and</strong> sludge<br />
dewatering equipment, phosphorus <strong>and</strong> heavy metal removal,<br />
<strong>and</strong> anaerobic digestion are the products <strong>and</strong> technologies<br />
that offer good prospects for future growth.<br />
145. Ibid.
65<br />
<strong>Water</strong> <strong>and</strong> <strong>Wastewater</strong> <strong>Export</strong> <strong>Market</strong> <strong>Plan</strong><br />
Appendix A<br />
Major International <strong>Water</strong> <strong>and</strong> <strong>Wastewater</strong> Projects<br />
Project Financing<br />
Project Components (millions of dollars)<br />
Funding<br />
Municipal Municipal Industrial Total Loan/ Project<br />
Country<br />
Agency/<br />
Source Project Title<br />
<strong>Water</strong> Supply Sewage <strong>and</strong><br />
<strong>and</strong> Treatment Sanitation<br />
<strong>Wastewater</strong><br />
Treatment<br />
Proj.<br />
Amt.<br />
Grant<br />
Amt.<br />
Duration<br />
Status ExecutingAgency<br />
Albania WB <strong>Water</strong> Supply <strong>and</strong> Urgent ● n.a. 10 2000–? World Bank <strong>Water</strong> PIU in Durres <strong>and</strong><br />
Rehabilitation Project Support<br />
Angola WB Lu<strong>and</strong>a <strong>Water</strong> Supply Project ● n.a. 20 under<br />
preparation n.a.<br />
WB Urban <strong>Water</strong> Supply <strong>and</strong> Sanitation ● ● n.a. 20 under<br />
Project preparation National Directorate of <strong>Water</strong><br />
Argentina WB Pollution Management Project ● n.a. 18 1998–2003 Secretariat for the Environment<br />
WB <strong>Water</strong> Sector Reform Project ● n.a. 30 1999–? Secretariat of Public Works<br />
IDB Program in Support of Reform of the ● ● 571 250 1998–2003 National Board of <strong>Water</strong> <strong>and</strong><br />
<strong>Water</strong> Supply <strong>and</strong> Sanitation Sector Sanitation Works<br />
Armenia WB Municipal Development Project ● ● n.a. 30 1998–? Municipal governments<br />
WB Municipal <strong>Water</strong> <strong>and</strong> <strong>Wastewater</strong> ● ● n.a. 20 under Armenian water & sewerage<br />
Project preparation companies<br />
Bangladesh WB Dhaka <strong>Water</strong> Supply Project ● n.a. 80 1996–? DWASA<br />
WB School <strong>and</strong> Community Sanitation ● n.a. 75 under Department of Public Health <strong>and</strong><br />
Project preparation Engineering<br />
Bolivia IDB Basic Sanitation Program for ● 56 40 1999–? Ministry of Housing <strong>and</strong> Basic<br />
Small Municipalities Services<br />
Bosnia– WB Mostar <strong>Water</strong> <strong>and</strong> Sewerage Project ● ● n.a. 12 2000–? Mostar <strong>Water</strong> Supply<br />
Herzegovina <strong>and</strong> Sewerage Utility<br />
Brazil IDB Guaiba <strong>Water</strong>shed Environmental ● ● 221 132 1993–? Secretariat of <strong>Plan</strong>ning <strong>and</strong><br />
Management Program Administration<br />
IDB Tiete River Cleanup Project, Stage II ● ● 400 2000 1999–2002 Basic Sanitation Company of the<br />
State of Sao Paulo, State Ministry of<br />
<strong>Water</strong> Resources, Sanitation <strong>and</strong><br />
Works, State Environmental<br />
Sanitation Company
66 U.S. Department of Commerce, International Trade Administration<br />
Project Financing<br />
Project Components (millions of dollars)<br />
Funding<br />
Municipal Municipal Industrial Total Loan/ Project<br />
Country<br />
Agency/<br />
Source Project Title<br />
<strong>Water</strong> Supply Sewage <strong>and</strong><br />
<strong>and</strong> Treatment Sanitation<br />
<strong>Wastewater</strong><br />
Treatment<br />
Proj.<br />
Amt.<br />
Grant<br />
Amt.<br />
Duration<br />
Status ExecutingAgency<br />
IDB Federal District Sanitation Program ● ● 260 130 2000–2005 Department of Infrastructure <strong>and</strong><br />
Works of the federal district<br />
government<br />
IDB Basic Sanitation Program for the ● ● ● 793 350 1993–? State water company<br />
Guanabara Bay Basin ● ● ● 793 350 1993–? State water company<br />
IDB São Paulo Drainage Program, Stage II ● 544 302 1994–? n.a.<br />
WB Small Localities <strong>Water</strong> <strong>and</strong> ● ● n.a. 150 under SEPURB/Casa Civil<br />
Sanitation Project preparation<br />
WB São Paulo <strong>Water</strong> Quality <strong>and</strong> Pollution<br />
Control Program<br />
● n.a. 245 1992–2002 Secretariats of States<br />
WB Federal <strong>Water</strong> Resources Management<br />
Project<br />
● n.a. 198 1998–2003 Secretariat of <strong>Water</strong> Resources<br />
WB Bahia <strong>Water</strong> Resources Management ● ● n.a. 51 1997–2002 SRHSH<br />
Bulgaria EBRD Sofia <strong>Water</strong> System Concession ● ● 91 32 2000–? Sofijska Voda AD<br />
Burkina Faso WB <strong>Water</strong> Supply Project (01) ● n.a. 70 under<br />
preparation<br />
ONEA<br />
Cambodia WB Urban <strong>Water</strong> Supply Project ● n.a. 31 1998–? Ministry of Industry, Mines <strong>and</strong><br />
Energy<br />
ADB Provincial Towns Improvement Project ● ● 26 20 1999–2005 Ministry of Industry, Mines <strong>and</strong><br />
Energy<br />
China ADB Suzhou Creek Rehabilitation ● ● 916 300 1999–2010 Suzhou Creek Rehabilitation <strong>and</strong><br />
Construction Co., Ltd.<br />
ADB Tianjin <strong>Wastewater</strong> Treatment <strong>and</strong><br />
<strong>Water</strong> Resources Protection<br />
● 345 130 1999–2005 n.a.<br />
ADB Fuzhou <strong>Water</strong> Supply <strong>and</strong> <strong>Wastewater</strong><br />
Treatment<br />
● ● 192 102 1995–2002 Fuzhou ADB Project Office<br />
ADB Zhejiang–Shanxi <strong>Water</strong> Supply Project ● 518 100 1997–? Shanxi Economic Development<br />
Corporation<br />
WB Hebei Urban Environment Project ● ● ● n.a. 150 2000–? Hebei Provincial Government<br />
WB Changing Urban Environment Project ● ● n.a. 200 2000–? Chongqing Municipal Government<br />
WB National Rural <strong>Water</strong> Supply Project ● n.a. 70 1997–? National Public Health Commission<br />
ADB Mudanjiang <strong>Water</strong> Supply ● 185 90 1997–? Mudanjiang Linhai General <strong>Water</strong><br />
Supply Company
67<br />
<strong>Water</strong> <strong>and</strong> <strong>Wastewater</strong> <strong>Export</strong> <strong>Market</strong> <strong>Plan</strong><br />
WB Liao River Basin Project ● ● n.a. 200 under<br />
preparation<br />
Liaoning Province<br />
WB Beijing Environment Project (02) ● ● n.a. 349 2000–2006 Beijing Municipal Government<br />
WB Sichuan Urban Environment Project ● ● n.a. 152 1999–2006 Sichuan Provincial <strong>and</strong> Municipal<br />
Government<br />
WB Guangxi Urban Environment Project ● ● n.a. 92 1998–2004 Nanning <strong>and</strong> Guilin<br />
WB Sh<strong>and</strong>ong Environment Project ● ● n.a. 95 1997–2003 Sh<strong>and</strong>ong Urban <strong>and</strong> Rural Const.<br />
Com / Env.PR<br />
WB Yunnan Environment Project ● ● n.a. 150 1996–2002 Municipal governments<br />
WB Chongqing Industrial Pollution<br />
Control <strong>and</strong> Reform Project<br />
● n.a. 170 1996–2002 Chongqing Municipality<br />
Colombia WB Cartegena <strong>Water</strong> Supply, Sewerage<br />
<strong>and</strong> Environ. Management Project<br />
● ● ● n.a. 85 1999–? Aguas de Barcelona<br />
WB <strong>Water</strong> Sector Reform Assistance ● n.a. 60 under The Ministry of Economic<br />
Project preparation Development<br />
IDB Medelín River Sanitation Program ● 66 40 2000–? Medellín Public Utility<br />
Croatia WB Municipal Environmental<br />
Infrastructure Project ● ● n.a. 30 1998–? Eko <strong>and</strong> Split <strong>Water</strong> Companies<br />
EBRD Rijeka Sewerage <strong>and</strong> Service Project ● 11 7 1999–? City of Rijeka <strong>and</strong> Rijeka <strong>Water</strong> <strong>and</strong><br />
Sewerage Company<br />
Dominican WB <strong>Wastewater</strong> Disposal in Tourism ● ● n.a. 5 2000–? Technical Secretariat<br />
Republic Centers Project of the Presidency<br />
East Timor ADB <strong>Water</strong> <strong>and</strong> Sanitation Sector ● ● 10 10 2000–? United Nations Transitional<br />
Rehabilitation Project Administration<br />
Ecuador WB Guayaquil <strong>Water</strong> <strong>and</strong> Sewerage ● ● n.a. 35 under n.a.<br />
Management Project preparation<br />
WB Rural <strong>and</strong> Small City <strong>Water</strong> Project ● ● n.a. 32 2000–? MIDUVI/SSA<br />
Egypt WB Pollution Abatement Project ● n.a. 35 1997–2003 Egypt Environmental Affairs Agency<br />
USAID Secondary Cities Development ● ● n.a. 215 1994 –2002 Governorates (provincial<br />
governments)<br />
USAID Alex<strong>and</strong>ria <strong>Wastewater</strong> System, ● n.a. 90 1998–2002 Alex<strong>and</strong>ria General Organization<br />
Expansion II for Sanitary Drainage<br />
Alex<strong>and</strong>ria Drinking <strong>Water</strong> Initiative ● n.a. 200 1998–2002 Alex<strong>and</strong>ria <strong>Water</strong> General Authority<br />
USAID Egypt Utilities Management Program ● ● n.a. 215 1997–2004 Economic General Authorities for<br />
<strong>Water</strong> Supply <strong>and</strong> Sanitary Drainage<br />
Ethiopia WB <strong>Water</strong> Supply Development <strong>and</strong> ● n.a. 36 under AWSA, WSSA<br />
Rehabilitation Project preparation<br />
Republic ADB Suva Nausori <strong>Water</strong> ● ● 55 42 under Ministry of Communication<br />
of Fiji preparation Works <strong>and</strong> Energy
68 U.S. Department of Commerce, International Trade Administration<br />
Project Financing<br />
Project Components (millions of dollars)<br />
Funding<br />
Municipal Municipal Industrial Total Loan/ Project<br />
Country<br />
Agency/<br />
Source Project Title<br />
<strong>Water</strong> Supply Sewage <strong>and</strong><br />
<strong>and</strong> Treatment Sanitation<br />
<strong>Wastewater</strong><br />
Treatment<br />
Proj.<br />
Amt.<br />
Grant<br />
Amt.<br />
Duration<br />
Status ExecutingAgency<br />
Georgia WB Tbilisi <strong>Water</strong> Supply <strong>and</strong> ● ● n.a. 25 under Tbilisi <strong>Water</strong> Utilityr<br />
Sanitation Project preparation<br />
WB Integrated Coastal Management Project ● n.a. 4 1998–2004 Ministry of Environment<br />
Guatemala IDB Rural <strong>Water</strong> Investment Program ● ● 63 50 under INFOM (Municipal Promotion<br />
preparation Institute)<br />
IDB Program for Sanitation <strong>and</strong> Sustainable ● ● 40 8 1998–2003 Authority for the Sustainable<br />
Productive Management of the<br />
Amatitlan Lake <strong>Water</strong>shed<br />
Management of Lake Amatitlan<br />
Guinea WB <strong>Water</strong> Supply <strong>and</strong> Sanitation Project ● ● n.a. 25 under<br />
preparation<br />
n.a.<br />
Honduras IDB Supplement to Potable <strong>Water</strong> <strong>and</strong><br />
Sanitation Investment Program ● ● 22 20 2000–? Ministry of Finance<br />
Hungary WB Municipal <strong>Wastewater</strong> Project ● n.a. 32 1999–? Municipalities<br />
India WB Industrial Pollution Prevention Project ● n.a. 168 1994–2002 Ministry of Environment<br />
WB Madras <strong>Water</strong> Supply <strong>and</strong> ● n.a. 105 under Metrowater <strong>and</strong> Chennai Municipal<br />
Sanitation Project preparation Corporation<br />
WB Karnataka Rural <strong>Water</strong> Supply <strong>and</strong> ● ● n.a. 150 under Government of Karnataka <strong>and</strong> Tamil<br />
Environmental Sanitation Project preparation Nadu<br />
WB Rural <strong>Water</strong> Supply <strong>and</strong><br />
Environmental Sanitation Project<br />
● ● n.a. 66 2000–2006 Government of Kerala<br />
WB Uttar Pradesh Rural <strong>Water</strong> Supply <strong>and</strong><br />
Environmental Sanitation Project ● ● n.a. 60 1996–2002 n.a.<br />
WB Bombay Sewage Disposal Project ● n.a. 192 1995–2002 Municipal Corp. of Bombay<br />
WB Madras <strong>Water</strong> Supply Project ● n.a. 276 1995–2002 Metrowater<br />
India ADB Karnataka Urban Development <strong>and</strong> ● ● 251 175 1999–2004 Karnataka Urban Infrastructure<br />
Coastal Environmental Management Development <strong>and</strong> Financing<br />
Project Corporation<br />
ADB Rajasthan Urban Infrastructure<br />
Development<br />
● ● 362 250 1998–2004 Urban Development Department<br />
Indonesia ADB <strong>Water</strong> Supply <strong>and</strong> Sanitation Sector ● ● 100 100 expected Directorate General of Urban <strong>and</strong><br />
2001 Rural Development
69<br />
<strong>Water</strong> <strong>and</strong> <strong>Wastewater</strong> <strong>Export</strong> <strong>Market</strong> <strong>Plan</strong><br />
ADB Capacity Building for <strong>Water</strong> Supply ● 119 66 1997–? Directorate General of Public<br />
Enterprises for <strong>Water</strong> Loss Reduction Administration <strong>and</strong> Regional<br />
Sector Projects Autonomy<br />
Iran WB Tehran Sewerage Project ● n.a. 145 2000–2004 Tehran Sewerage Company<br />
Jamaica IDB Kingston <strong>Water</strong> <strong>and</strong> Sanitation ● ● 50 35 under<br />
preparation<br />
National <strong>Water</strong> Commission<br />
Jordan WB Amman <strong>Water</strong> <strong>and</strong> Sanitation<br />
Management Project<br />
● n.a. 55 1999–2004 <strong>Water</strong> Authority of Jordan<br />
Kazakhstan WB Atyrau Pilot <strong>Water</strong> Supply <strong>and</strong><br />
Sanitation Project<br />
● ● n.a. 16 1999–? Atyrau Oblast Government<br />
WB Pilot <strong>Water</strong> Supply Project ● n.a. 7 1996–? State Committee for <strong>Water</strong> Resources<br />
EBRD Almaty Potable <strong>Water</strong> <strong>and</strong><br />
Sewerage Project<br />
● ● 40 6 2001–? Almaty Sui<br />
WB Atyrau Pilot <strong>Water</strong> Supply <strong>and</strong><br />
Sanitation Project<br />
● ● n.a. 17 1999–2004 Atyrau Oblast Akimat<br />
WB Environmental Management <strong>and</strong> ● 52 42 under Ministry of Natural Resources <strong>and</strong><br />
Rehabilitation Project preparation Environment<br />
Kenya WB Lake Victoria Environmental ● ● n.a. 13 1996–2002 Ministry of Environment <strong>and</strong> Natural<br />
Management Project Resources<br />
Kiribati ADB Sanitation, Public Health, <strong>and</strong> ● ● 13 10 1998–? Ministry of Finance <strong>and</strong> Economic<br />
Environment Improvement <strong>Plan</strong>ning<br />
Kyrgyz ADB Community-Based Infrastructure ● ● 45 36 2000–2005 Ministry of Agriculture<br />
Republic Services Sector <strong>and</strong> <strong>Water</strong> Resources<br />
WB Rural <strong>Water</strong> <strong>and</strong> Sanitation Project ● ● n.a. 20 under Ministry of Agriculture <strong>and</strong> <strong>Water</strong><br />
preparation Resources<br />
Laos ADB <strong>Water</strong> Supply <strong>and</strong> Sanitation Sector ● ● 25 20 1999–? Ministry of Communication,<br />
Transport, Post <strong>and</strong> Construction<br />
Lebanon WB Greater Beirut <strong>Water</strong> Supply ● ● n.a. 65 under Council for Development <strong>and</strong><br />
preparation Reconstruction<br />
Lesotho WB Highl<strong>and</strong>s <strong>Water</strong> Project n.a. 45 1998–2004 LHDA<br />
Macedonia WB <strong>Water</strong> Supply <strong>and</strong> Sewerage Project ● ● n.a. 32 under <strong>Water</strong> Companies <strong>and</strong> the Ministry of<br />
preparation Urbanism<br />
Madagascar WB Rural <strong>Water</strong> Supply <strong>and</strong> Sanitation<br />
Pilot Project<br />
● ● n.a. 17 1997–2003 Ministry of Energy <strong>and</strong> Mines<br />
Mauritius WB Environmental Sewerage <strong>and</strong><br />
Sanitation Project<br />
● n.a. 12 1998–2003 WWA<br />
Mexico NADB Acuna, Cohuila Comprehensive ● 80 17 2000–? Municipal <strong>Water</strong> <strong>and</strong> <strong>Wastewater</strong><br />
Sanitation Project Utility<br />
NADB Juarez, Chihuahua, North <strong>and</strong> South ● 31 5 1997–? Municipal <strong>Water</strong> <strong>and</strong> <strong>Wastewater</strong><br />
<strong>Wastewater</strong> Treatment <strong>Plan</strong>ts Project Utilities
70 U.S. Department of Commerce, International Trade Administration<br />
Project Financing<br />
Project Components (millions of dollars)<br />
Funding<br />
Municipal Municipal Industrial Total Loan/ Project<br />
Country<br />
Agency/<br />
Source Project Title<br />
<strong>Water</strong> Supply Sewage <strong>and</strong><br />
<strong>and</strong> Treatment Sanitation<br />
<strong>Wastewater</strong><br />
Treatment<br />
Proj.<br />
Amt.<br />
Grant<br />
Amt.<br />
Duration<br />
Status ExecutingAgency<br />
NADB Naco, Sonora, <strong>Water</strong> Supply <strong>and</strong> ● ● 2 1 1996–? Municipal <strong>Water</strong> <strong>and</strong> <strong>Wastewater</strong><br />
<strong>Wastewater</strong> Collection <strong>and</strong><br />
Treatment System<br />
Utilities<br />
NADB Nogales, Sonora, <strong>Water</strong> Supply <strong>and</strong> ● 39 9 1996–? Municipal <strong>Water</strong> <strong>and</strong> <strong>Wastewater</strong><br />
Distribution Project Utilities<br />
NADB Puerto Palomas, Chihuahua, ● 5 2 2000–? Municipal <strong>Water</strong> <strong>and</strong> <strong>Wastewater</strong><br />
Improvement to <strong>Wastewater</strong> Collection<br />
<strong>and</strong> Treatment Systems<br />
Utilities<br />
NADB Region Cinco Manantiales, Coahuila,<br />
Paper Recycling <strong>and</strong> <strong>Wastewater</strong><br />
Treatment Project<br />
● 18 7 2000–? Industrial Papelera Solar<br />
NADB Reynosa, Tamaulipas Comprehensive<br />
Sanitation Project<br />
● 83 8 1998–? n.a.<br />
NADB San Luis Colorado, Sonora ● 14 6 2000–? Organismo Operador Municipal de<br />
(construction of a wastewater Agua Potable, Alcantarillado y<br />
treatment plant <strong>and</strong> rehabilitation Saneamiento de San Lui<br />
of the wastewater collection system) Rio Colorado<br />
NADB Piedras Negras, Coahuila, ● 57 17 Sistema Municipal de Aguas y<br />
Comprehensive Sanitation Project Sanemiento de Piedras Negras<br />
NADB Ensenada Baja California,<br />
<strong>Wastewater</strong> Treatment <strong>Plan</strong>t<br />
● 8 None 1995–? n.a.<br />
NADB Matamoros, Tamaulipas,<br />
FINSA Industrial Park<br />
● 1 None 1996–? n.a.<br />
NADB Mexicali, Baja California, Sanitation<br />
Program for the City of Mexicali ● 57 21 2000–? State <strong>Water</strong> Commission<br />
NADB Tecate, Baja California, Improvement ● ● 8 4 2000–? Tecate State Public Services<br />
<strong>and</strong> Expansion of the <strong>Water</strong> <strong>and</strong><br />
<strong>Wastewater</strong> System<br />
Commission<br />
NADB Tijuana, Baja California, Sewage<br />
Treatment <strong>Plan</strong>t Rehabilitation<br />
<strong>and</strong> Expansion<br />
● 20 3 1997–? n.a.<br />
Mongolia WB Ulan Bator Services<br />
Improvement Project<br />
● n.a. 17 1997–? n.a.
71<br />
<strong>Water</strong> <strong>and</strong> <strong>Wastewater</strong> <strong>Export</strong> <strong>Market</strong> <strong>Plan</strong><br />
Morocco WB Rural <strong>Water</strong> Supply <strong>and</strong><br />
Sanitation Project<br />
● ● n.a. 10 1997–? National Office of Potable <strong>Water</strong><br />
Mozambique WB National <strong>Water</strong> Development Project n.a. 35 1998–? Ministry of Public Works <strong>and</strong><br />
Housing<br />
Nepal ADB Melamchi <strong>Water</strong> Supply Project ● 464 120 2000–? Ministry of <strong>Plan</strong>ning <strong>and</strong> Publications<br />
ADB Small Towns <strong>Water</strong> Supply <strong>and</strong> ● ● 54 35 2000–? Ministry of Physical <strong>Plan</strong>ning <strong>and</strong><br />
Sanitation Sector Works<br />
WB Rural <strong>Water</strong> Supply <strong>and</strong> ● ● n.a. 18 1996–2002 Rural <strong>Water</strong> Supply <strong>and</strong> Sanitation<br />
Sanitation Project Fund<br />
Nicaragua IDB Lake Managua <strong>and</strong> City of Managua<br />
Environmental Improvement Program,<br />
Stage I<br />
● ● 47 15 1996–? INAA<br />
Niger WB Niger State <strong>Water</strong> Supply <strong>and</strong> ● ● n.a. 46 under Ministry of <strong>Water</strong> Resources<br />
Sanitation Sector Study Project preparation<br />
Nigeria WB Small Towns <strong>Water</strong> Supply <strong>and</strong> ● ● n.a. 5 2000–? Ministry of <strong>Water</strong> Resources <strong>and</strong><br />
Sanitation Program Pilot Project Rural Development<br />
WB Urban <strong>Water</strong> Sector Reform Project ● n.a. 250 under<br />
preparation<br />
Federal Ministry of <strong>Water</strong> Resources<br />
Pakistan ADB Korangi <strong>Wastewater</strong> Management ● 101 70 1997–? Government of Sindh Karachi <strong>Water</strong><br />
<strong>and</strong> Sewerage Board<br />
WB Karachi <strong>Water</strong> Supply <strong>and</strong><br />
Sanitation Project<br />
● ● n.a. 92 1993–? KWSB/KMC<br />
Papua Provincial Towns <strong>Water</strong> Supply ● ● 15 25 2000–? Papua New Guinea <strong>Water</strong> Board<br />
New Guinea ADB <strong>and</strong> Sanitation<br />
Paraguay WB Rural <strong>Water</strong> Supply <strong>and</strong><br />
Sanitation Project<br />
● n.a. 40 1997–2003 Senasa<br />
WB Asunción Sewerage Project ● n.a. 47 1995–2003 Corposana<br />
Philippines WB <strong>Water</strong> Districts Development Project ● n.a. 57 1997–2004 Local government<br />
WB Local Government Units Urban <strong>and</strong> ● ● n.a. 86 under n.a.<br />
Sanitation Project preparation<br />
WB Manila Sewerage Project ● n.a. 57 1996–2003 MWSS<br />
ADB Mindanao Basic Urban Service Sector ● ● 71 35 1997–2002 L<strong>and</strong> Bank of the Philippines<br />
ADB Subic Bay Area Municipal<br />
Development Project<br />
● 37 22 1997–2002 Subic Bay Metropolitan Authority<br />
Pol<strong>and</strong> EBRD Krakow Plaszow II <strong>Wastewater</strong> ● 74 20 2000–? Krakow <strong>Water</strong> Supply <strong>and</strong> Waste<br />
Treatment <strong>Plan</strong>t Modernisation Project <strong>Water</strong> Treatment Company<br />
WB Bielsko Biala <strong>Water</strong> <strong>and</strong><br />
<strong>Wastewater</strong> Project ● ● ● n.a. 22 1996–2003 n.a.<br />
EBRD Bydgoszcz <strong>Water</strong> Supply <strong>and</strong> Sewerage ● ● 62 23 1999–? <strong>Water</strong> Supply <strong>and</strong> Sewerage<br />
Services Development Program Company of Bydgoszcz
72 U.S. Department of Commerce, International Trade Administration<br />
Project Financing<br />
Project Components (millions of dollars)<br />
Funding<br />
Municipal Municipal Industrial Total Loan/ Project<br />
Country<br />
Agency/<br />
Source Project Title<br />
<strong>Water</strong> Supply Sewage <strong>and</strong><br />
<strong>and</strong> Treatment Sanitation<br />
<strong>Wastewater</strong><br />
Treatment<br />
Proj.<br />
Amt.<br />
Grant<br />
Amt.<br />
Duration<br />
Status ExecutingAgency<br />
Russia WB <strong>Water</strong> Supply <strong>and</strong> Sanitation ● ● n.a. 123 2000–2006 Municipal <strong>Water</strong> <strong>and</strong> <strong>Wastewater</strong><br />
Enterprise<br />
WB Community Social ● ● n.a. 200 1996–2002 Ministry of Nationalities <strong>and</strong> Federal<br />
Infrastructure Project Affairs<br />
WB Municipal <strong>Water</strong> <strong>and</strong> ● ● ● n.a. 122 2000–2006 Municipal <strong>Water</strong> <strong>and</strong> <strong>Wastewater</strong><br />
<strong>Wastewater</strong> Project Enterprise<br />
Russia EBRD Yaroslav Municipal <strong>Water</strong> Services ● 18 14 under Yaroslavl <strong>Water</strong> Utility<br />
Development Program preparation<br />
EBRD Kaliningrad <strong>Water</strong> <strong>and</strong> Environmental<br />
Services Project<br />
● 63 18 1999–? Kaliningrad Vodokanal<br />
Rw<strong>and</strong>a WB Rural <strong>Water</strong> <strong>and</strong> Sanitation Project ● ● n.a. 20 2000–? MINERENA/CDC<br />
Senegal WB Long–Term <strong>Water</strong> Supply Project ● n.a. 125 under<br />
preparation<br />
n.a.<br />
Sierra Leone WB Urban <strong>Water</strong> Supply Project ● n.a. 36 1995–2003 Guma Valley <strong>Water</strong> Co.<br />
Sri Lanka WB Urban <strong>Water</strong> Supply <strong>and</strong> ● ● n.a. 20 under Ministry of Urban Development<br />
Sanitation Project preparation Construction<br />
WB Environmental Action <strong>Plan</strong> ● n.a. 15 1997–2002 MTEWA<br />
Tajikistan WB Dushanbe <strong>Water</strong> Supply Project ● n.a. 15 under<br />
preparation<br />
Dushanbe Vodokanal (DVK)<br />
Tanzania WB Rural <strong>Water</strong> Supply <strong>and</strong> ● ● n.a. 15 under Ministry of <strong>Water</strong><br />
Sanitation Project preparation<br />
WB Dar–es–Salam <strong>Water</strong> Supply <strong>and</strong> ● ● n.a. 45 under Ministry of <strong>Water</strong>, Dar es Salaam<br />
Sanitation Project preparation <strong>Water</strong> Supply <strong>and</strong> Sewerage<br />
Authority<br />
WB Lake Victoria Environmental<br />
Management Project ● ● n.a. 10 1996–2002 Vice President’s Office<br />
Thail<strong>and</strong> ADB Samut Prakarn <strong>Wastewater</strong><br />
Management ● 671 230 1998–? Pollution Control Department<br />
ADB Northeast Region <strong>Water</strong> Supply ● 100 5 n.a. Provincial <strong>Water</strong>works Authority<br />
Tunisia WB Greater Tunis Sewerage <strong>and</strong> ● n.a. 60 1997–2004 National Office of Sanitation/<br />
Reuse Project Ministry of Agriculture<br />
WB <strong>Water</strong> Supply <strong>and</strong> Sewerage Project ● ● n.a. 58 1994–2002 Sonede/National Office of Sanitation
73<br />
<strong>Water</strong> <strong>and</strong> <strong>Wastewater</strong> <strong>Export</strong> <strong>Market</strong> <strong>Plan</strong><br />
Turkey WB Antalya <strong>Water</strong> Supply <strong>and</strong> ● ● n.a. 130 1995–2003 Antalya <strong>Water</strong> Supply <strong>and</strong> Sewerage<br />
Sanitation Project Authority<br />
Ug<strong>and</strong>a WB Lake Victoria Environmental<br />
Management Project<br />
● ● n.a. 12 1996–2002 Ministry of Natural Resources<br />
Ukraine WB Municipal <strong>Water</strong> <strong>and</strong> n.a. 24 under Lviv Vodokanal<br />
<strong>Wastewater</strong> Project preparation<br />
Uruguay WB <strong>Water</strong> Sector Modernization <strong>and</strong><br />
Rehabilitation Project<br />
● ● n.a. 27 2000–2004 State <strong>Water</strong> Utility<br />
Uzbekistan WB <strong>Water</strong> Supply, Sanitation, <strong>and</strong> ● n.a. 30 1997–2005 State Committee for Monitoring <strong>and</strong><br />
Health Project Statistics<br />
WB Samark<strong>and</strong> <strong>and</strong> Bukhara <strong>Water</strong> ● ● n.a. 41 under Bukhara <strong>and</strong> Samark<strong>and</strong> <strong>Water</strong> Utility<br />
Supply <strong>and</strong> Sanitation Project preparation<br />
Vietnam WB <strong>Water</strong> Supply Project ● n.a. 99 1997–2002 Ministry of Agriculture<br />
WB Three Cities Sanitation Project ● n.a. 80 1999–2005 Municipal water utilities<br />
Yemen WB Municipal <strong>Water</strong> Project n.a. 90 under<br />
preparation<br />
Ministry of Electricity <strong>and</strong> <strong>Water</strong><br />
WB Sana’s Basin <strong>Water</strong> n.a. 50 under National <strong>Water</strong> <strong>and</strong> Sanitation<br />
Management Project preparation Authority<br />
Note: For explanation of acronyms used in this table, see the list of acronyms on page iv.
U.S. Government Agencies<br />
Appendix B<br />
Government <strong>and</strong> Industry Contact List<br />
U.S. Agency for International Development<br />
Information Center<br />
1300 Pennsylvania Ave., NW<br />
Ronald Reagan Building<br />
Washington, DC 20523-0016<br />
Tel: (202) 712-4810<br />
Fax: (202) 216-3524<br />
Web site: www.info.usaid.gov<br />
Africa Bureau<br />
USAID/AFR, Room 4.08<br />
Tel: (202) 712-0500<br />
Fax: (202) 216-3008<br />
Web site: www.info.usaid.gov/regions/afr/<br />
Asia <strong>and</strong> Near East Bureau<br />
USAID/ANE, Room 4.09<br />
Tel: (202) 712-0200<br />
Fax: (202) 216-3386<br />
Web site: www.info.usaid.gov/regions/ane/<br />
Europe <strong>and</strong> Eurasia Bureau<br />
USAID/ENE, Room 5.06<br />
Tel: (202) 712-0290<br />
Fax: (202) 216-3057<br />
Web site: www.info.usaid.gov/regions/europe_eurasia/<br />
Latin America <strong>and</strong> the Caribbean Bureau<br />
USAID/LAC, Room 5.09<br />
Tel: (202) 712-4800<br />
Fax: (202) 216-3012<br />
Web site: www.info.usaid.gov/regions/lac/<br />
Eurasian American Partnership for Environmentally<br />
Sustainable Economies (EcoLinks)<br />
U.S. Regional Office<br />
1400 K St., NW, Suite 650<br />
Washington, DC 20005<br />
Tel: (202) 326-7798<br />
Fax: (202) 326-7709<br />
E-mail: plai@iie.org<br />
Web site: www.ecolinks.org<br />
74 U.S. Department of Commerce, International Trade Administration<br />
Global Technology Network (GTN)<br />
1133 20th St. NW, Suite 600<br />
Washington, DC 20036<br />
Tel: (202) 955-7473<br />
Fax: (202) 785-8489<br />
E-mail: usgtn@usgtn.org<br />
Web site: www.usgtn.org/<br />
U.S.-Asia Environmental Partnership (US-AEP)<br />
1720 I St. NW, Suite 700<br />
Washington, DC 20006<br />
Tel: (202) 835-0333<br />
Fax: (202) 825-0366<br />
E-mail: usasia@usaep.org<br />
Web site: www.usaep.org<br />
US-AEP Technology Representation Offices<br />
Web site: www.usaep.org/contacts.htm#<br />
technologyrepresentatives<br />
Environmental Technology Network for Asia (ETNA)<br />
1720 Eye St. NW, Suite 600<br />
Washington, DC 20006<br />
Tel: (800) 818-9911<br />
Fax: (202) 835-8358<br />
E-mail: tyoder@usaep.org<br />
Web site: www.usaep.org/ouractiv/etna.htm<br />
U.S. Department of Commerce<br />
International Trade Administration<br />
14th St. <strong>and</strong> Constitution Ave., NW<br />
Washington DC 20230<br />
Tel: (800) 872-8723 or (202) 482-3809<br />
Fax: (202) 482-5819<br />
Web site: www.ita.doc.gov<br />
Bureau of <strong>Export</strong> Administration<br />
Tel: (202) 482-2721<br />
Fax: (202) 482-2421<br />
Web site: www.bxa.doc.gov/factsheets/<br />
<strong>Export</strong>erAssistance.html
<strong>Export</strong> Assistance Centers<br />
U.S. Department of Commerce<br />
International Trade Administration<br />
Room 3810<br />
14th St. <strong>and</strong> Constitution Ave., NW<br />
Washington, DC 20230<br />
Tel: (202) 482-4767<br />
Fax: (202) 482-0687<br />
Web site: www.ita.doc.gov/fcs/uscs/<br />
<strong>Export</strong> Assistance Center Directory<br />
Web site: www.ita.doc.gov/fcs/uscs/domfld.html<br />
Office of Environmental <strong>Technologies</strong> Industries<br />
Tel: (202) 482-5225<br />
Fax: (202) 482-5665<br />
Web site: www.environment.ita.doc.gov<br />
Office of Trade Development—Energy Division<br />
Tel: (202) 482-4931<br />
Fax: (202) 482-5361<br />
Web site: www.ita.doc.gov/td/energy/<br />
Trade Information Center<br />
U.S. Department of Commerce<br />
R-TIC Stop<br />
1401 Constitution Avenue, NW<br />
Washington, DC 20230<br />
Tel: (800) 872-8723<br />
E-mail: TIC@ita.doc.gov<br />
Web site: infoserv2.ita.doc.gov/tic.nsf<br />
Advocacy Center<br />
U.S. Department of Commerce<br />
International Trade Administration<br />
Room 3814A<br />
14th St. <strong>and</strong> Constitution Ave., NW<br />
Washington, DC 20230<br />
Tel: (202) 482-3896<br />
Fax: (202) 482-3508<br />
Web site: www.ita.doc.gov/advocacy<br />
U.S. Foreign <strong>and</strong> Commercial Service<br />
Tel: (202) 482-5777<br />
Fax: (202) 482-5013<br />
Web site: www.ita.doc.gov/fcs/uscs/<br />
U.S. Department of Energy<br />
Office of Public Inquiries<br />
1000 Independence Ave., SW<br />
Washington, DC 20589<br />
Tel: (202) 586-5575<br />
Fax: (202) 586-0823<br />
Web site: www.doe.gov<br />
Energy Information Administration<br />
National Energy Information Center<br />
1000 Independence Ave., SW<br />
Washington, DC 20585<br />
Tel: (202) 586-8800<br />
E-mail: infoctr@eia.doe.gov<br />
Web site: www.eia.doe.gov/<br />
Office of Energy Efficiency <strong>and</strong> Renewable Energy<br />
U.S. Department of Energy<br />
EE1 6C-016<br />
1000 Independence Ave., SW<br />
Washington, DC 20589<br />
Tel: (202) 586-9220<br />
Web site: www.eren.doe.gov<br />
U.S. Country Studies Program <strong>and</strong> U.S. Initiative on Joint<br />
Implementation (Secretariat)<br />
Forrestall Building, PO-6 / GP-196<br />
1000 Independence Ave., SW<br />
Washington, DC 20585<br />
Tel: (202) 586-3288<br />
Fax: (202) 586-3485<br />
U.S. Department of State<br />
Bureau of Public Affairs<br />
2201 C St., NW<br />
Washington, DC 20520<br />
Tel: (202) 647-6575<br />
Fax: (202) 736-7720<br />
E-mail: publicaffairs@panet.us-state.gov<br />
Web site: www.state.gov<br />
U.S. Environmental Protection Agency<br />
Public Information Center<br />
401 M St., SW<br />
Washington, DC 20460<br />
Tel: (202) 260-2090<br />
Fax: (202) 565-2411<br />
Web site: www.epa.gov<br />
Office of International Activities<br />
Ronald Reagan Building<br />
1300 Pennsylvania Ave., NW<br />
Washington, DC 20004<br />
Tel: (202) 564-6600<br />
Fax: (202) 565-2407<br />
Web site: www.epa.gov/oia/<br />
U.S. <strong>Export</strong>-Import Bank<br />
811 Vermont Ave., NW<br />
Washington, DC 20571<br />
Tel: (800) 565-EXIM (3946) or (202) 565-EXIM (3946)<br />
Fax: (202) 565-3380<br />
Web site: www.exim.gov<br />
<strong>Water</strong> <strong>and</strong> <strong>Wastewater</strong> <strong>Export</strong> <strong>Market</strong> <strong>Plan</strong><br />
75
U.S. Overseas Private Investment Corporation<br />
1100 New York Ave., NW<br />
Washington, DC 20527<br />
Tel: (202) 336-8799<br />
Fax: (202) 408-9859<br />
E-mail: info@opic.gov<br />
Web site: www.opic.gov<br />
U.S. Small Business Administration<br />
Office of International Trade<br />
409 3rd St., SW<br />
Washington, DC 20416<br />
Tel: (202) 205-6720<br />
Fax: (202) 205-7272<br />
Web site: www.sbaonline.sba.gov/oit/<br />
U.S. Trade <strong>and</strong> Development Agency<br />
1621 North Kent St., Suite 200<br />
Arlington, Virginia 22209-2131<br />
Tel: (703) 875-4357<br />
Fax: (703) 875-4009<br />
E-mail: info@tda.gov<br />
Web site: www.tda.gov/<br />
Multilateral Development Banks<br />
U.S. Department of Commerce, MDB Operations<br />
14th St. <strong>and</strong> Constitution Ave., NW<br />
Room 1107<br />
Washington, DC 20230<br />
Tel: (202) 482-3399<br />
Fax: (202) 273-0927<br />
Web site: www.ita.doc.gov/mdbo<br />
African Development Bank<br />
Boîte Postale 1387<br />
Abidjan 01, Cote d’Ivoire<br />
Tel: +225 (21) 44-44<br />
Fax: +225 (22) 49-07<br />
U.S. Commercial Liaison: U.S. Embassy<br />
5 Rue Jesse Owens<br />
B.P. 1712<br />
Abidjan 01, Cote d’Ivoire<br />
Tel: +225 (21) 46-16<br />
Fax: +225 (22) 24-37<br />
Asian Development Bank (ADB)<br />
6 ADB Ave.<br />
M<strong>and</strong>aluyong City<br />
0401 Metro Manila, Philippines<br />
Tel: +63 (2) 632-4444<br />
Fax: +63 (2) 636-2444<br />
76 U.S. Department of Commerce, International Trade Administration<br />
U.S. Commercial Liaison:<br />
U.S. Commercial Service<br />
U.S. Embassy, Manila<br />
APO AP 96515<br />
Tel: +63 (2) 890-9364<br />
Fax: +63 (2) 890-9713<br />
North American Office:<br />
1730 Pennsylvania Ave., NW<br />
Suite 975<br />
Washington, DC 20006<br />
Tel: (202) 626-0050<br />
European Bank for Reconstruction <strong>and</strong> Development<br />
(EBRD)<br />
One Exchange Square<br />
London EC2A 2EH UK<br />
Tel: +44 (171) 338-6282<br />
Fax: +44 (171) 338-6102<br />
U.S. Commercial Liaison:<br />
Office of the U.S. Executive Director<br />
Tel: +44 (171) 338-6569<br />
Fax: +44 (171) 338-6487<br />
Global Environment Facility (GEF)<br />
1818 H St., NW<br />
Washington, DC 20433<br />
Tel: (202) 473-8324<br />
Fax: (202) 522-0551<br />
U.S. Commercial Liaison:<br />
Office of the U.S. Executive Director<br />
Tel: (202) 458-0120<br />
Fax: (202) 477-2967<br />
International Finance Corporation (IFC)<br />
1801 K St., NW<br />
Washington, DC 20433<br />
Tel: (202) 473-0642<br />
Fax: (202) 334-8705<br />
U.S. Commercial Liaison:<br />
Office of the U.S. Executive Director<br />
Tel: (202) 458-0120<br />
Fax: (202) 477-2967<br />
Inter-American Development Bank (IDB)<br />
1300 New York Ave., NW<br />
Washington, DC 20036<br />
Tel: (202) 623-1365<br />
Fax: (202) 623-1403
E-mail: pic@iadb.org<br />
U.S. Commercial Liaison:<br />
Office of the U.S. Executive Director<br />
U.S. Commercial Service<br />
Tel: (202) 623-3821<br />
Fax: (202) 623-2039<br />
Inter-American Investment Corporation<br />
1300 New York Ave., NW<br />
Washington, DC 20036<br />
Tel: (202) 623-3900<br />
Fax: (202) 623-2360<br />
U.S. Commercial Liaison:<br />
Office of the U.S. Executive Director<br />
U.S. Commercial Service<br />
Tel: (202) 623-3821<br />
Fax: (202) 623-2039<br />
Multilateral Investment Guarantee Agency (MIGA)<br />
1818 H St., NW<br />
Washington, DC 20433<br />
Tel: (202) 473-6163<br />
Fax: (202) 522-2630<br />
U.S. Commercial Liaison:<br />
Office of the U.S. Executive Director<br />
Tel: (202) 458-0120<br />
Fax: (202) 477-2967<br />
North American Development Bank (NADBank)<br />
700 N. St. Mary’s, Suite 1950<br />
San Antonio, TX 78205<br />
Tel: (210) 231-8000<br />
Fax: (210) 231-6232<br />
World Bank<br />
1818 H St., NW<br />
Washington, DC 20433<br />
Tel: (202) 458-5454<br />
Fax: (202) 522-1500<br />
U.S. Commercial Liaison:<br />
Office of the U.S. Executive Director<br />
Tel: (202) 458-0120<br />
Fax: (202) 477-2967<br />
Other Organizations<br />
American Consulting Engineers Council<br />
International Affairs Program<br />
1015 15th St., NW, Suite 802<br />
Washington, DC 20005<br />
Tel: (202) 347-7474<br />
Fax: (202) 842-2436<br />
E-mail: kpuvak@acec.org<br />
Web site: www.acec.org<br />
Business Council for Sustainable Energy<br />
1200 18th St., NW, Ninth Floor<br />
Washington, DC 20036<br />
Tel: (202) 785-0507<br />
Fax: (202) 785-0514<br />
E-mail: bcse@bcse.org<br />
Web site: www.bcse.org<br />
Council of State Governments<br />
State Environmental Initiative<br />
2760 Research Park Drive<br />
P.O. Box 11910<br />
Lexington, KY 40578-1910<br />
Tel: (606) 244-8234<br />
Fax: (606) 244-8001<br />
E-mail: kmarshal@csg.org<br />
Web site: www.csg.org<br />
National Association of State Development Agencies<br />
750 First St., NE, Suite 710<br />
Washington, DC 20002<br />
Tel: (202) 898-1302<br />
Fax: (202) 898-1312<br />
E-mail: jpike@nasda.com<br />
Web site: www.nasda.com<br />
National Pollution Prevention Roundtable<br />
2000 P St., NW, Suite 708<br />
Washington, DC 20036<br />
Tel: (202) 466-7272<br />
Fax: (202) 466-7964<br />
E-mail: tyronefoster@compuserve.com<br />
Web site: www.p2.org<br />
World Trade Centers Association<br />
60 East 42nd St.<br />
Suite 1901<br />
New York, NY 10165<br />
Tel: (212) 432-2626<br />
Fax: (212) 488-0064<br />
Web site: www.iserve.wtca.org<br />
<strong>Water</strong> <strong>and</strong> <strong>Wastewater</strong> <strong>Export</strong> <strong>Market</strong> <strong>Plan</strong><br />
77
Appendix C<br />
<strong>Water</strong> <strong>and</strong> <strong>Wastewater</strong> Industry Trade Associations<br />
American Metropolitan Sewerage Association<br />
(AMSA)<br />
1816 Jefferson Pl., NW<br />
Washington DC 20036-2505<br />
Tel: (202) 833-AMSA (2672)<br />
Fax: (202) 833-4657<br />
E-mail: info@amsa-cleanwater.org<br />
Web site: www.amsa-cleanwater.org<br />
American <strong>Water</strong> Resource Association (AWRA)<br />
4 West Federal St.<br />
P.O. Box 1626<br />
Middleburg, VA 20118-1626<br />
Tel: (540) 687-8390<br />
Fax: (540) 687-8395<br />
E-mail: info@awra.org<br />
Web site: www.awra.org<br />
American <strong>Water</strong> Works Association (AWWA)<br />
6666 West Quincy Ave.<br />
Denver, CO 80235<br />
Tel: (303) 794-7711<br />
or<br />
1401 New York Ave., NW, Suite 640<br />
Washington, DC 20005<br />
Tel: (202) 628-8303<br />
Web site: www.awwa.org<br />
Association of Metropolitan <strong>Water</strong> Agencies (AMWA)<br />
1717 K St., NW, Suite 801<br />
Washington, DC 20036<br />
Tel: (202) 331-2826<br />
Fax: (202) 785-1845<br />
Web site: www.amwa-water.org<br />
Association of State Drinking <strong>Water</strong> Administrators<br />
1025 Connecticut Ave., NW, Suite 903<br />
Washington, D.C. 20036<br />
Tel: (202) 293-7655<br />
Fax: (202) 293-7656<br />
E-mail: asdwa@erols.com<br />
Web site: asdwa.org<br />
78 U.S. Department of Commerce, International Trade Administration<br />
International Private <strong>Water</strong> Association<br />
205 West End Ave., Suite 8-L<br />
New York, NY 10023<br />
Tel: (212) 873-0920<br />
Fax: (212) 873-5531<br />
Web site: www.ipwa.org<br />
International <strong>Water</strong> Resources Association<br />
4535 Faner Hall<br />
Southern Illinois University<br />
Carbondale, IL 62901-4516<br />
Fax: (618) 453-2671<br />
E-mail: iwra@siu.edu<br />
Web site: iwra.siu.edu<br />
National Association of <strong>Water</strong> Companies<br />
1725 K St., NW, Suite 1212<br />
Washington, DC 20006<br />
Tel: (202) 833-8383<br />
Fax: (202) 331-7442<br />
Web site: www.nawc.org<br />
National Ground <strong>Water</strong> Association<br />
601 Dempsey Road<br />
Westerville, OH 43081<br />
Tel: (800) 551-7379<br />
Fax: (614) 898-7791<br />
Web site: www.ngwc.org<br />
National Rural <strong>Water</strong> Association<br />
2915 South 13th St.<br />
Duncan, OK 73533-9086<br />
Tel: (580) 252-0629<br />
Fax: (580) 252-4896<br />
Web site: www.nrwa.org<br />
National <strong>Water</strong> Resources Association<br />
3800 North Fairfax Dr., Suite 4<br />
Arlington, VA 22203<br />
Tel: (703) 524-1544<br />
Fax: (703) 524-1548<br />
Web site: www.nwra.org
<strong>Water</strong> Environment Federation (WEF)<br />
601 Wythe St.<br />
Alex<strong>and</strong>ria, VA 22314-1994<br />
Tel: (703) 684-2452<br />
Fax: (703) 684-2492<br />
Web site: www.wef.org/<br />
<strong>Water</strong> <strong>and</strong> <strong>Wastewater</strong> <strong>Export</strong> <strong>Market</strong> <strong>Plan</strong><br />
79
Appendix D<br />
International Programs Affecting the <strong>Water</strong> <strong>and</strong><br />
<strong>Wastewater</strong> Industry<br />
U.S. Agency for International Development<br />
(USAID)<br />
Ronald Reagan Building<br />
1300 Pennsylvania Ave., NW<br />
Washington, DC 20523-0016<br />
Tel: (202) 712-4810<br />
Fax: (202) 216-3524<br />
Web site: www.usaid.gov<br />
USAID represents the single most important U.S. government<br />
source of opportunities for U.S. exporters of<br />
environmental technologies, both in terms of direct procurement<br />
<strong>and</strong> strategic marketing related to environmental<br />
assistance projects. USAID is an independent federal<br />
government agency that provides economic development<br />
<strong>and</strong> humanitarian assistance to advance U.S. economic<br />
<strong>and</strong> political interests overseas. <strong>Water</strong> projects <strong>and</strong><br />
projects with water/wastewater components are funded<br />
by USAID in Washington, D.C., <strong>and</strong> through USAID<br />
missions in developing countries.<br />
USAID commodity procurement includes equipment<br />
<strong>and</strong> supplies needed to fulfill USAID project needs <strong>and</strong><br />
disaster relief, as well as materials financed through<br />
USAID-funded commodity import programs. Procurement<br />
is usually done by USAID missions in the field,<br />
under projects with a value of over $1 million. It is important<br />
for U.S. companies to be able to take advantage<br />
of procurement opportunities in order to position themselves<br />
in specific overseas markets.<br />
USAID advertises procurement opportunities through<br />
the following information sources:<br />
• Commerce Business Daily (CBD): The CBD<br />
includes announcements about all USAID commodity<br />
procurement opportunities <strong>and</strong> technical assistance<br />
projects with a value greater than $100,000.<br />
Contact the U.S. Government Printing Office at<br />
(202) 783-3238 to subscribe to the print version or<br />
the U.S. Department of Commerce at (202) 482-<br />
0632 for the electronic version.<br />
• Procurement Information Bulletin (PIB): The PIB<br />
lists USAID commodity procurement opportunities<br />
<strong>and</strong> awards greater than $25,000. Written requests to<br />
80 U.S. Department of Commerce, International Trade Administration<br />
receive the PIB should be faxed to USAID’s Office<br />
of Procurement at (202) 216-3051 or requested by<br />
telephone at (202) 712-5130.<br />
• Internet <strong>and</strong> phone inquiries: USAID posts<br />
information on planned procurement as well as<br />
currently issued Requests for Proposals (RFPs) on<br />
its Web site (www.info.usaid.gov). Procurement<br />
information can also be obtained by calling (800)<br />
USAID-73.<br />
Contract awards over $100,000 are very competitive<br />
<strong>and</strong> a company should be economically sound <strong>and</strong> knowledgeable<br />
about procurement rules <strong>and</strong> regulations before<br />
attempting to bid on federal procurement. It is very important<br />
to become familiar with Federal Acquisition<br />
Regulations <strong>and</strong> USAID Acquisition Regulations. These<br />
publications are available in most public libraries, or can<br />
be ordered from the Government Printing Office.<br />
USAID is most likely to procure environmental equipment<br />
through big contracts awarded to consortia of environmental<br />
engineering <strong>and</strong> consulting firms. The<br />
equipment supplier would then need to become a subcontractor<br />
to the project’s prime contractor. Prime contractors<br />
have to go through a formal bidding process in<br />
equipment procurement. Names, types of businesses, <strong>and</strong><br />
the subcontracting needs of USAID’s prime contractors<br />
can be obtained from the Contract Awards section of the<br />
CBD; USAID lists of prime contractors available through<br />
the Information Center at (202) 712-4810; <strong>and</strong> federal<br />
prime contracting reports available from the Federal Procurement<br />
Data Center at (202) 401-1529. It may also be<br />
helpful to obtain information on past awards, quantities,<br />
costs, <strong>and</strong> awardees.<br />
USAID puts special emphasis on involving U.S. small<br />
<strong>and</strong> medium-sized enterprises in its technology transfer<br />
efforts. The Office of Small <strong>and</strong> Disadvantaged Business<br />
Utilization (OSDBU) is the initial point of contact at<br />
USAID for U.S. small businesses. OSDBU is a small<br />
business advocacy <strong>and</strong> advisory office with the responsibility<br />
for ensuring that these enterprises get access to<br />
USAID programs. The office fulfills the following<br />
responsibilities:
• Serves as an information clearinghouse for U.S.<br />
small businesses,<br />
• Counsels small businesses on how to do business<br />
with USAID,<br />
• Reviews all prime contracts to identify subcontracting<br />
opportunities for small businesses,<br />
• Maintains a vendor database, which describes the<br />
capabilities of U.S. businesses <strong>and</strong> organizations<br />
interested in participating in the agency’s programs,<br />
• Sponsors annual outreach conferences on “How To<br />
Do Business with USAID,” <strong>and</strong><br />
• Develops operations, systems, <strong>and</strong> procedures to<br />
optimize participation of U.S. small businesses in<br />
USAID activities.<br />
Even if direct procurement is not envisioned under a<br />
significant technology-related USAID project, suppliers<br />
in the relevant technology area can benefit from learning<br />
about it to identify potential markets in the target<br />
country. USAID’s Environment: A Resource Guide provides<br />
a good overview of the agency’s principal programs<br />
<strong>and</strong> contracts.<br />
USAID’s Global Technology Network (GTN)<br />
USAID Global Bureau’s Office of Business Development<br />
serves as the central point of contact at USAID for<br />
U.S. firms interested in doing business in developing<br />
countries. Its activities <strong>and</strong> services are specifically intended<br />
to increase U.S. private enterprise participation<br />
in USAID international development programs while<br />
opening up new market opportunities for U.S. product<br />
<strong>and</strong> services firms, especially small <strong>and</strong> medium-sized<br />
firms. The Office of Business Development operates<br />
regional Business Outreach Offices that provide links<br />
to market opportunities in USAID-assisted countries<br />
worldwide. They also serve as a source of public information<br />
regarding the purpose <strong>and</strong> impact of U.S. foreign<br />
assistance.<br />
The Global Technology Network (GTN) is the principal<br />
program of the Office of Business Development. GTN<br />
is a free service that creates strategic linkages between<br />
U.S. companies <strong>and</strong> entrepreneurs in developing countries<br />
with the goal of transferring U.S. technology overseas.<br />
GTN’s environmental <strong>and</strong> energy services assist the<br />
U.S. business community in gaining access to global environmental<br />
<strong>and</strong> energy markets by providing trade leads<br />
<strong>and</strong> market information.<br />
The three basic types of leads are equipment purchases,<br />
agent/distributor, <strong>and</strong> joint ventures. Business opportunities<br />
are identified by a network of participating in-country<br />
public <strong>and</strong> private sector representatives. Leads are<br />
transmitted to GTN/Washington where they are qualified,<br />
matched, <strong>and</strong> electronically disseminated to U.S. firms<br />
registered in GTN’s databases. Over 10,000 U.S. environmental<br />
<strong>and</strong> energy firms covering over 600 different<br />
subsectors within the environmental industry are currently<br />
registered in the GTN system. (Companies can register<br />
by calling 1 (800) 872-4348.) To give U.S.<br />
companies easier access to GTN business opportunities,<br />
GTN is now posting its current trade leads online at<br />
www.usgtn.org/pages/envleads.html.<br />
Follow-up on trade leads, as well as information on<br />
general USAID procurement, is provided through GTN/<br />
Washington <strong>and</strong> outreach offices in California, Florida,<br />
Illinois, Oregon, <strong>and</strong> Washington (contact information is<br />
provided in Appendix A). Additional follow-up on leads<br />
is provided through U.S. <strong>Export</strong> Assistance Centers <strong>and</strong><br />
26 state trade partner organizations across the U.S. Partner<br />
organizations use GTN’s Internet-based Trade Lead<br />
Tracking System to assist local companies in responding<br />
to GTN trade leads.<br />
Business Support Centers (BSCs) serve as the counseling<br />
<strong>and</strong> information services arm of GTN. BSCs are<br />
USAID-funded business development operations designed<br />
to help private sector companies (especially small<br />
<strong>and</strong> medium-sized businesses) in developing countries<br />
access the technology <strong>and</strong> expertise needed to compete<br />
effectively in local <strong>and</strong> global markets. BSCs serve as a<br />
mechanism for organizing <strong>and</strong> assisting developing country<br />
firms, especially small <strong>and</strong> medium-sized enterprises<br />
seeking access to U.S. technology <strong>and</strong> expertise. BSCs<br />
also provide trade leads to U.S. firms seeking to market<br />
their products <strong>and</strong> services abroad.<br />
The GTN Travel Grants program is designed to support<br />
U.S. firms pursuing GTN trade leads. After an official<br />
or businessperson in another country <strong>and</strong> a U.S.<br />
business have identified a mutual interest in pursuing a<br />
business relationship, either organization may apply for<br />
a GTN grant for a maximum of $5,000 to cover the travel<br />
costs of one individual’s travel to meet with the potential<br />
partner. The grants are available for both developing<br />
countries <strong>and</strong> U.S. entrepreneurs.<br />
GTN trade mission services, which include sector<br />
briefings <strong>and</strong> networking support to USAID field missions<br />
<strong>and</strong> domestic partners, are provided in cooperation<br />
with other federal <strong>and</strong> multilateral agencies. Trade missions<br />
are held at USAID offices in the International Trade<br />
Center in Washington, D.C. Similar services are available<br />
for in-coming GTN trade delegations sponsored by<br />
USAID missions <strong>and</strong> U.S. embassies abroad, foreign<br />
embassies, or other GTN partner organizations.<br />
Under a cooperative agreement with USAID, the International<br />
Executive Service Corps (IECS) delivers a<br />
<strong>Water</strong> <strong>and</strong> <strong>Wastewater</strong> <strong>Export</strong> <strong>Market</strong> <strong>Plan</strong><br />
81
ange of business development services to assist small<br />
<strong>and</strong> medium-sized businesses in developing countries<br />
through joint ventures with counterpart U.S. companies.<br />
The following are GTN’s regional programs:<br />
• GTN-Environmental Technology Network for Asia<br />
(ETNA) was developed by USAID’s Global Bureau<br />
<strong>and</strong> the United States-Asia Environmental Partnership<br />
(US-AEP). ETNA Asia facilitates the transfer of U.S.<br />
environmental technology to Hong Kong, India,<br />
Indonesia, South Korea, Malaysia, the Philippines,<br />
Singapore, Sri Lanka, Taiwan, <strong>and</strong> Thail<strong>and</strong>.<br />
• GTN-Americas is a joint program between<br />
USAID’s Global Bureau <strong>and</strong> the U.S. Department of<br />
Commerce. GTN Americas generates trade leads in<br />
Argentina, Bolivia, Brazil, Chile, Costa Rica,<br />
Mexico, Peru, Uruguay, <strong>and</strong> Venezuela.<br />
• GTN-Ecolinks offer resources to providers of U.S.<br />
technologies. For more information, see the Eurasian-American<br />
Partnership for Environmentally<br />
Sustainable Economies description on page 83.<br />
GTN also operates in 15 African countries, as well as<br />
in Egypt <strong>and</strong> Jordan.<br />
United States-Asia Environmental Partnership<br />
1720 I St. NW, Suite 700<br />
Washington, DC 20006<br />
Tel: (202) 835-0333<br />
Fax: (202) 835-0366<br />
E-mail: usasia@usaep.org<br />
Web site: www.usaep.org<br />
The United States-Asia Environmental Partnership is an<br />
interagency program with funding of more than $17.5<br />
million from USAID, the Department of Commerce, <strong>and</strong><br />
the Environmental Protection Agency to promote <strong>and</strong><br />
reinforce a sustainable cleaner production regime for the<br />
industrial <strong>and</strong> urban sectors in 11 Asian countries: Hong<br />
Kong, India, Indonesia, South Korea, Malaysia, the Philippines,<br />
Singapore, Sri Lanka, Taiwan, Thail<strong>and</strong>, <strong>and</strong><br />
Vietnam. Since its inception in 1993, US-AEP has facilitated<br />
over $1 billion in sales of environmental equipment<br />
<strong>and</strong> services by U.S. companies in Asia.<br />
In cooperation with the Department of Commerce, US-<br />
AEP has placed environmental technology representatives<br />
in 11 Asian countries to identify trade opportunities<br />
for U.S. companies <strong>and</strong> coordinate meetings between potential<br />
Asian <strong>and</strong> U.S. business partners. These environmental<br />
trade specialists meet regularly with decisionmakers<br />
in industry <strong>and</strong> government to prepare concise<br />
82 U.S. Department of Commerce, International Trade Administration<br />
trade leads that identify Asian buyers, environmental concerns,<br />
<strong>and</strong> proposed technology solutions. Hundreds of<br />
such leads per year are forwarded to ETNA where they<br />
are matched against a database of over 2,400 registered<br />
U.S. companies, <strong>and</strong> then faxed to those companies that<br />
provide the requested technology or service.<br />
Urban environmental infrastructure representatives, located<br />
in four Asian countries (India, Indonesia, the Philippines,<br />
<strong>and</strong> Thail<strong>and</strong>), provide similar services, but focus<br />
on problems found in urban areas, such as the provision<br />
of clean water, treatment of wastewater, <strong>and</strong> disposal of<br />
solid <strong>and</strong> hazardous wastes.<br />
In addition to the trade leads provided by the US-AEP<br />
technology representatives in Asia, ETNA provides market<br />
trend analyses for each US-AEP country; disseminates<br />
fact sheets on innovative U.S. technologies to U.S.<br />
government counterparts overseas (e.g., US-AEP technology<br />
representatives <strong>and</strong> foreign commercial service<br />
representatives); <strong>and</strong> provides business counseling to U.S.<br />
environmental companies interested in exp<strong>and</strong>ing their<br />
business in Asia. Contact ETNA ((800) 818-9911) to find<br />
out more about these <strong>and</strong> other services.<br />
<strong>Export</strong>-Link is an Internet resource accessible through<br />
the US-AEP Web site (www.usaep.org) that assists companies<br />
with their international trade activities <strong>and</strong> provides<br />
practical assistance to all levels of exporters.<br />
<strong>Export</strong>-Link helps U.S. firms evaluate overseas market<br />
opportunities <strong>and</strong> offers advanced business analysis, as<br />
well as relevant legal, financial, <strong>and</strong> market information.<br />
The Environmental Exchange Program promotes information<br />
sharing on a variety of environmental topics<br />
to respond to Asian countries’ environmental needs.<br />
There are several types of exchanges provided. Environmental<br />
business exchanges offer American <strong>and</strong> Asian<br />
businessmen an opportunity to travel to each other’s<br />
countries to meet potential business partners. Business<br />
exchanges may involve a single individual or a study tour<br />
of 10 to 20 people. Technical exchanges help representatives<br />
from U.S. firms showcase their technology <strong>and</strong><br />
equipment to Asian decision-makers. Finally, environmental<br />
fellowships enable Asian <strong>and</strong> American professionals<br />
to work with peers in their counterpart’s home<br />
country for a period of one to four months for training,<br />
research, or information sharing. Interested U.S. businesses<br />
should contact the Institute of International Education<br />
(at www.iie.org), which administers the program.<br />
Drawing on the U.S. states’ experience in environmental<br />
management, the State Environmental Initiative,<br />
provides matching grants for up to $150,000 to encourage<br />
state-initiated <strong>and</strong> -managed programs. The initiative<br />
was designed to encourage international partnerships<br />
in environmental <strong>and</strong> economic development between
U.S. states <strong>and</strong> Asian/Pacific nations <strong>and</strong> territories. The<br />
grants serve to facilitate the long-term transfer of U.S.<br />
environmental experience, technology, <strong>and</strong> practice to<br />
targeted Asian countries by matching appropriate U.S.<br />
technologies <strong>and</strong> state regulatory <strong>and</strong> environmental experience<br />
with the needs of Asian governments <strong>and</strong> industries.<br />
The grants are issued by the Council of State<br />
Governments.<br />
The Environmental Technology Fund is administered<br />
by the National Association of State Development<br />
Agencies (NASDA) <strong>and</strong> is described under “NASDA<br />
Grants” in this section.<br />
Eurasian-American Partnership for<br />
Environmentally Sustainable Economies<br />
(EcoLinks)<br />
U.S. Regional Office<br />
1400 K St., NW, Suite 650<br />
Washington, DC 20005<br />
Tel: (202) 326-7798<br />
Fax: (202) 326-7709<br />
E-mail: plai@iie.org<br />
Web site: www.ecolinks.org<br />
The Eurasian-American Partnership for Environmentally<br />
Sustainable Economics (EcoLinks) offers resources to<br />
providers of U.S technologies as part of its regional initiative<br />
to find practical, market-based solutions to industrial<br />
<strong>and</strong> urban environmental problems in Central <strong>and</strong><br />
Eastern Europe (CEE) <strong>and</strong> the New Independent States<br />
(NIS). It promotes partnerships linking CEE/NIS businesses,<br />
local governments, <strong>and</strong> associations with U.S.<br />
counterparts. EcoLinks actively seeks environmental<br />
business <strong>and</strong> technology transfer opportunities in the<br />
Czech Republic, Pol<strong>and</strong>, Hungary, Romania, Kazakhstan,<br />
Russia, Ukraine, <strong>and</strong> Macedonia.<br />
The EcoLinks technology transfer program operates<br />
in the same way as ETNA does in Asia. Through an<br />
interagency agreement between USAID <strong>and</strong> the Department<br />
of Commerce, environmental technology representatives<br />
have been placed in selected CEE/NIS countries,<br />
namely, the Czech Republic, Hungary, Kazakhstan, Pol<strong>and</strong>,<br />
<strong>and</strong> Romania. These representatives work with<br />
GTN to generate trade leads.<br />
A second component of EcoLinks is its grants initiative.<br />
Competitively awarded, cost-sharing partnership<br />
grants are currently available in amounts of up to $50,000<br />
to support one-year cooperative projects. Twinning grants<br />
(grants that support two-year cooperative projects that<br />
lead to lasting partnerships) of up to $250,000 became<br />
available for two-year projects starting in the year 2000.<br />
In addition to the grants, EcoLinks also offers Quick<br />
Response Awards to prospective applicants. Awards of<br />
up to $5,000 are designed to meet the immediate <strong>and</strong><br />
small-scale needs of organizations exploring potential<br />
partnerships within the framework of EcoLinks. Activities<br />
must either facilitate the matchmaking of potential<br />
partners or promote environmental trade <strong>and</strong> investment.<br />
Examples of funded activities include travel to meet potential<br />
partners, site visits to facilities, technology demonstrations,<br />
<strong>and</strong> conferences where participants meet<br />
partners <strong>and</strong> forge relationships.<br />
National Association of State Development Agencies<br />
(NASDA)<br />
750 First St., NE, Suite 710<br />
Washington, DC 20002<br />
Tel: (202) 898-1302<br />
Fax: (202) 898-1312<br />
Web site: www.nasda.com<br />
The National Association of State Development Agencies<br />
(NASDA) administers three similar grant programs<br />
promoting U.S. environmental technology exports to Asia<br />
<strong>and</strong> Latin America.<br />
The Environmental Technology Fund (Tech Fund),<br />
created under the US-AEP, provides matching grants of<br />
up to $20,000 to help small <strong>and</strong> medium-sized U.S. companies<br />
enter Asian environmental markets. 1 Grants match<br />
from 20 to 50 percent of total project costs.<br />
The Tech Fund focuses on pollution control, cleaner<br />
technologies, <strong>and</strong> energy efficiency. Preferred projects<br />
are those that aim to reduce or eliminate Asia’s greenhouse<br />
gas emissions. Environmental activities that are<br />
eligible for a grant include engineering/technology workshops<br />
or seminars, business development missions, <strong>and</strong><br />
technology/equipment demonstrations. Over the five<br />
years of the program’s operation, grant funding has been<br />
provided for more than 275 projects, facilitating over<br />
$350 million in export sales of U.S. environmental products<br />
<strong>and</strong> technologies.<br />
NASDA has recently completed a similar Latin<br />
American Fund for the Environment program that has<br />
awarded matching grants (of up to $15,000) for 51<br />
projects in 17 countries throughout Latin America <strong>and</strong><br />
the Caribbean, <strong>and</strong> generated over $21 million in revenues<br />
for participating U.S. firms.<br />
Under a cooperative agreement with the Environmental<br />
Protection Agency, NASDA is currently considering<br />
1. The countries included under the Environmental Technology Fund<br />
do not include China.<br />
<strong>Water</strong> <strong>and</strong> <strong>Wastewater</strong> <strong>Export</strong> <strong>Market</strong> <strong>Plan</strong><br />
83
a Program for Environmental Technology Transfer<br />
(PETT) with China. The program would enable small<br />
<strong>and</strong> medium-sized businesses to fund technology demonstrations,<br />
workshops, <strong>and</strong> development programs targeting<br />
pollution prevention, air pollution, wastewater<br />
treatment, <strong>and</strong> energy efficiency in China.<br />
U.S. Department of Commerce (DOC)<br />
14th St. <strong>and</strong> Constitution Ave., NW<br />
Washington, DC 20230<br />
Tel: (202) 482-2000<br />
Web site: www.doc.gov<br />
Within the U.S. Department of Commerce (DOC), several<br />
offices <strong>and</strong> centers provide services that assist U.S.<br />
exporters in their business development efforts.<br />
Environmental <strong>Technologies</strong> <strong>Export</strong>s (ETE) is the<br />
principal resource <strong>and</strong> key contact point within the DOC<br />
for American environmental technology companies, including<br />
all business activities associated with environmental<br />
protection, assessment, compliance with<br />
environmental regulations, pollution control, waste management,<br />
remediation of contaminated property, design<br />
<strong>and</strong> operation of environmental infrastructure <strong>and</strong> the<br />
provision <strong>and</strong> delivery of environmental services. ETE’s<br />
goal is to enhance the international competitiveness <strong>and</strong><br />
increase the exports of the U.S. environmental industry<br />
by providing basic market <strong>and</strong> project-related research;<br />
supporting a variety of trade promotion activities, including<br />
leading trade missions; providing business counseling<br />
<strong>and</strong> representing the interests of U.S. environmental<br />
firms; <strong>and</strong> supporting the creation of public-private partnerships.<br />
ETE supports the Environmental <strong>Technologies</strong><br />
Trade Advisory Committee <strong>and</strong> the interagency Environmental<br />
Trade Working Group, a subcommittee of the<br />
Trade Promotion Coordinating Committee.<br />
The U.S. <strong>and</strong> Foreign Commercial Service (the<br />
Commercial Service) has offices located in over 220 cities<br />
around the world to assist U.S. exporters. The organization<br />
offers U.S. businesses advocacy support <strong>and</strong><br />
services such as export counseling, trade finance information,<br />
customized market research, <strong>and</strong> identification<br />
of trade leads. It also organizes trade missions <strong>and</strong> events,<br />
<strong>and</strong> offers a Gold Key Service to link U.S. firms with<br />
agents <strong>and</strong> distributors around the world by allowing visiting<br />
U.S. company representatives to get a firsth<strong>and</strong> underst<strong>and</strong>ing<br />
of the local market <strong>and</strong> make key contacts<br />
that are critical to successful exporting.<br />
The Matchmaker Trade Delegations Program helps<br />
small <strong>and</strong> medium-sized U.S. companies establish business<br />
relationships in major markets abroad. Each Match-<br />
84 U.S. Department of Commerce, International Trade Administration<br />
maker Trade Delegation targets major markets in two or<br />
three countries with strong sales potential for U.S. goods<br />
<strong>and</strong> services. Commercial specialists at U.S. embassies<br />
<strong>and</strong> consulates in the targeted countries prescreen contacts<br />
<strong>and</strong> arrange business appointments for participating<br />
U.S. firms. The Matchmaker program also offers<br />
market research <strong>and</strong> evaluation of the market potential<br />
for a specific product or service; in-depth country market<br />
<strong>and</strong> trade finance briefings; interpreter services <strong>and</strong><br />
logistical support; <strong>and</strong> export counseling before, during,<br />
<strong>and</strong> after the trip.<br />
The Advocacy Center promotes U.S. firms through<br />
advocacy by high-level U.S. Government officials <strong>and</strong><br />
tracks environmental projects worldwide. The Trade Information<br />
Center (TIC) is a comprehensive resource for<br />
information on all federal government export assistance<br />
programs. TIC staff counsel small <strong>and</strong> medium-sized<br />
U.S. companies that are entering the export market. Multilateral<br />
Development Bank Operations provides the<br />
U.S. exporting community with comprehensive information<br />
on all multilateral development bank programs <strong>and</strong><br />
opportunities.<br />
<strong>Export</strong> Assistance Centers are a joint effort of the<br />
Commercial Service, the Small Business Administration,<br />
the <strong>Export</strong>-Import Bank of the United States, <strong>and</strong> USAID.<br />
Center personnel counsel small <strong>and</strong> medium-sized export-ready<br />
businesses <strong>and</strong> help them develop customized<br />
international business strategies. The centers are located<br />
throughout the United States <strong>and</strong> in nearly 70 countries<br />
abroad.<br />
U.S. Trade Development Agency Programs<br />
1621 North Kent St., Suite 200<br />
Arlington, VA 22209-2131<br />
Tel: (703) 875-4357; fax: (703) 875-4009<br />
E-mail: info@tda.gov<br />
Web site: www.tda.gov<br />
The U.S. Trade <strong>and</strong> Development Agency (TDA) is an<br />
independent federal agency dedicated to assisting U.S.<br />
companies in pursuing business opportunities in developing<br />
countries <strong>and</strong> responding to foreign competition.<br />
It sponsors feasibility studies, definitional missions, <strong>and</strong><br />
desk studies for major public <strong>and</strong> private sector projects<br />
in order to promote the use of U.S. goods <strong>and</strong> services in<br />
project implementation. By funding feasibility studies<br />
that evaluate the technical, legal, economic, <strong>and</strong> financial<br />
aspects of development projects, TDA provides U.S.<br />
companies with an opportunity to get in on the ground<br />
floor of a project.
TDA focuses primarily on feasibility studies for infrastructure<br />
development projects. Funding from the<br />
agency usually ranges from $150,000 to $750,000 for<br />
public sector projects. These feasibility studies also advise<br />
project sponsors about the availability of specific<br />
U.S. equipment <strong>and</strong> services. TDA publishes the TDA<br />
Pipeline, its biweekly newsletter, that highlights new<br />
definitional missions, feasibility study opportunities (also<br />
advertised in the Commerce Business Daily), <strong>and</strong> upcoming<br />
orientation visits <strong>and</strong> conferences. TDA business<br />
briefings <strong>and</strong> events often provide a good introduction<br />
to current opportunities in a specific sector or region.<br />
TDA hosts approximately 45 orientation visits each<br />
year. These week-long reverse trade missions bring foreign<br />
buyers to the United States to see equipment they<br />
may need for development projects. U.S. suppliers that<br />
participate in these visits are able to showcase their products<br />
<strong>and</strong> expertise, while making valuable international<br />
contacts. In conjunction with these visits, TDA often<br />
hosts a business briefing to allow U.S. companies to meet<br />
with the visiting delegation to hear more details about<br />
their needs.<br />
Additionally, TDA hosts a number of events to assist<br />
in opening global markets to U.S. businesses. Each event<br />
offers:<br />
• Workshops that highlight the best project opportunities<br />
for U.S. businesses in the region or sector;<br />
• A complete briefing book profiling each project in<br />
detail;<br />
• One-on-one meetings between U.S. companies <strong>and</strong><br />
foreign project officials; <strong>and</strong><br />
• Strategy <strong>and</strong> insight into some of the world’s most<br />
challenging <strong>and</strong> rewarding emerging markets.<br />
U.S. Environmental Protection Agency (EPA)<br />
Office of International Activities<br />
Ronald Reagan Building<br />
1300 Pennsylvania Ave., NW<br />
Washington, DC 20004<br />
Tel: (202) 564-6600<br />
Fax: (202) 565-2407<br />
Web site: www.epa.gov/oia<br />
The Environmental Protection Agency’s (EPA) international<br />
programs play an important role in helping the U.S.<br />
environmental sector exp<strong>and</strong> its export base. U.S. private<br />
sector groups have repeatedly underscored the importance<br />
of EPA’s international technology <strong>and</strong> technical<br />
assistance programs in creating markets for U.S. environmental<br />
goods <strong>and</strong> services.<br />
By showcasing the effectiveness <strong>and</strong> capabilities of<br />
available <strong>and</strong> emerging U.S. environmental technologies,<br />
EPA technology diffusion programs in developing countries<br />
lead to follow-on commercial opportunities for U.S.<br />
firms. EPA’s training programs also prepare the way for<br />
the exports of U.S. technologies. The training programs<br />
usually identify U.S. environmental technology manufacturers<br />
in the relevant sectors.<br />
Under a cooperative agreement with the EPA, the National<br />
Association of State Development Agencies<br />
(NASDA) is currently conducting a Program for Environmental<br />
Technology Transfer (PETT) to China. The<br />
program enables small <strong>and</strong> medium-sized businesses to<br />
fund technology demonstrations, workshops, <strong>and</strong> development<br />
programs targeting pollution prevention, air pollution,<br />
wastewater treatment, <strong>and</strong> energy efficiency in<br />
China.<br />
EPA is widely recognized as the world’s leading source<br />
of environmental information which helps build capacity<br />
for the use of advanced technologies. In addition to<br />
providing thous<strong>and</strong>s of pages of technical data via the<br />
Internet, EPA also makes information on U.S. environmental<br />
technology vendors available to potential buyers.<br />
For example, the Vendor Information System for Innovative<br />
Treatment <strong>Technologies</strong> (VISITT) provides<br />
vendor-supplied information on innovative technologies<br />
that can be used to treat contaminated groundwater, sludges,<br />
<strong>and</strong> sediments. EPA’s Clean Air Technology Center<br />
provides a similar resource for information on<br />
emerging <strong>and</strong> existing air pollution prevention <strong>and</strong> control<br />
technologies. Through its International Visitors Program,<br />
EPA staff helps arrange tours of U.S. facilities with<br />
innovative technologies in use, <strong>and</strong> set up meetings with<br />
U.S. technology suppliers.<br />
<strong>Water</strong> <strong>and</strong> <strong>Wastewater</strong> <strong>Export</strong> <strong>Market</strong> <strong>Plan</strong><br />
85
Appendix E<br />
U.S. Environmental Trade Working Group Contacts<br />
Department of Commerce<br />
Environmental <strong>Technologies</strong> <strong>Export</strong>s Office<br />
14th St. <strong>and</strong> Constitution Ave., NW<br />
Room 1003<br />
Washington, DC 20230<br />
Tel: (202) 482-5227<br />
Fax: (202) 482-5665<br />
Department of Defense<br />
3300 Defense Pentagon<br />
Room B, 739<br />
Washington, DC 20301<br />
Tel: (703) 614-8784<br />
Fax: (703) 695-1495<br />
Department of Energy<br />
Office of International Energy,<br />
Policy, Trade <strong>and</strong> Investment<br />
1000 Independence Ave., SW<br />
Room 73034<br />
Washington, DC 20589<br />
Tel: (202) 586-5493<br />
Fax: (202) 586-3047<br />
Department of the Interior<br />
1849 C St., NW<br />
Room 6123<br />
Washington, DC 20240<br />
Tel: (202) 208-6182<br />
Fax: (202) 208-4561<br />
Department of State<br />
Office of Environment <strong>and</strong> Development<br />
2201 C St., NW<br />
Room 7831<br />
Washington, DC 20520-7818<br />
Tel: (202) 647-2232<br />
Fax: (202) 647-0217<br />
Department of Treasury<br />
Office of Trade <strong>and</strong> Investment Policy<br />
1500 Pennsylvania Ave., NW<br />
Room 3208<br />
Washington, DC 20220<br />
Tel: (202) 622-0168<br />
Fax: (202) 622-5304<br />
86 U.S. Department of Commerce, International Trade Administration<br />
Environmental Protection Agency<br />
Office of International Activities<br />
401 M St., SW, Room W1135<br />
Washington, DC 20460-2610<br />
Tel: (202) 260-4870<br />
Fax: (202) 260-4470<br />
<strong>Export</strong>-Import Bank<br />
811 Vermont Ave., NW<br />
Room 1257<br />
Washington, DC 20571<br />
Tel: (202) 565-3540<br />
Fax: (202) 565-3548<br />
Overseas Private Investment Corporation<br />
1100 New York Ave., NW<br />
Washington, DC 20527<br />
Tel: (202) 336-8628<br />
Fax: (202) 218-0104<br />
Small Business Administration<br />
Office of International Trade<br />
409 3rd St., SW<br />
Mail Code 7550<br />
Washington, DC 20416<br />
Tel: (202) 205-6720<br />
Fax: (202) 205-7272<br />
Trade <strong>and</strong> Development Agency<br />
Office of <strong>Export</strong>s<br />
2201 C St., NW, Room 309, SA-16<br />
Washington, DC 20523-1810<br />
Tel: (703) 875-4357<br />
Fax: (703) 875-4009<br />
U.S. Agency for International Development<br />
Office of Energy, Environment, <strong>and</strong> Technology<br />
Room 508, SA-18<br />
Washington, DC 20523-1810<br />
Tel: (703) 875-4465<br />
Fax: (703) 875-4053
U.S.-Asia Environmental Partnership<br />
320 12th St., NW, Suite 3208<br />
Washington, DC 20523<br />
Tel: (202) 647-7037<br />
Fax: (202) 647-5861<br />
U.S. Environmental Training Institute<br />
1000 Thomas Jefferson St., NW<br />
Suite 106<br />
Washington, DC 20007<br />
Tel: (202) 338-3400<br />
Fax: (202) 338-4782<br />
U.S. Information Agency<br />
Office of Environment Security<br />
USIA, Room 848<br />
301 4th St., SW<br />
Washington, DC 20547<br />
Tel: (202) 619-6655<br />
Fax: (202) 619-5646<br />
U.S. Trade Representative<br />
Office of Environment <strong>and</strong> Natural Resources<br />
600 17th St., NW, Room 410<br />
Washington, DC 20508<br />
Tel: (202) 395-7320<br />
Fax: (202) 395-4579<br />
White House<br />
Office of Science <strong>and</strong> Technology Policy<br />
Old Executive Office Building<br />
Room 443<br />
Washington, DC 20502<br />
Tel: (202) 456-6084<br />
Fax: (202) 456-6025<br />
U.S.-ASEAN Council<br />
1400 L St., NW, Suite 375<br />
Washington, DC 20005-3509<br />
Tel: (202) 289-1911<br />
Fax: (202) 289-0519<br />
United States National Committee for Pacific Economic<br />
Cooperation<br />
1755 Massachusetts Ave., NW<br />
Suite 412<br />
Washington, DC 20036-2102<br />
Tel: (202) 745-7444<br />
Fax: (202) 797-1355<br />
Pacific Basin Economic Council<br />
1100 Connecticut Ave., NW<br />
Suite 1300<br />
Washington, DC 20036<br />
Tel: (202) 728-0993<br />
Fax: (202) 728-0998<br />
<strong>Water</strong> <strong>and</strong> <strong>Wastewater</strong> <strong>Export</strong> <strong>Market</strong> <strong>Plan</strong><br />
87
U.S. Government Reports<br />
Environmental <strong>Market</strong> in Japan, U.S. Department of<br />
Commerce, International Trade Administration, 1998.<br />
Financing Environmental <strong>Export</strong>s: A Guide to the Fundamentals<br />
<strong>and</strong> Sources, U.S. Department of Commerce,<br />
International Trade Administration, 1998.<br />
Global Competitiveness of U.S. Environmental Technology<br />
Industries: Municipal <strong>and</strong> Industrial <strong>Water</strong> <strong>and</strong><br />
<strong>Wastewater</strong>, U.S. International Trade Commission, 1995.<br />
Hungary: <strong>Water</strong> Treatment Equipment <strong>and</strong> Services, Industry<br />
Sector Analysis, U.S. <strong>and</strong> Foreign Commercial<br />
Service <strong>and</strong> U.S. Department of State, 2001.<br />
Meeting the Challenge: U.S. Industry Faces the 21st<br />
Century: The U.S. Environmental Industry, U.S. Department<br />
of Commerce, October 1998.<br />
Journal Articles<br />
“Competitive Analysis of U.S. Environmental <strong>Export</strong>s<br />
<strong>and</strong> Global <strong>Market</strong> Update,” Environmental Business<br />
International, 1995.<br />
“Global Environmental <strong>Market</strong>s 2000,” Environmental<br />
Business Journal, vol. XII, no. 9/10, 2000.<br />
“The U.S. <strong>Water</strong> Industry,” Environmental Business Journal,<br />
vol. XII, no. 7/8, 1999.<br />
“Vivendi Acquisition of US Filter Fuels Global Growth<br />
to $13 Billion in <strong>Water</strong>,” Environmental Business Journal,<br />
vol. XII, no. 7/8, 1999.<br />
“<strong>Wastewater</strong> Instrument Firm Sees Opportunity Abroad,<br />
Global Environmental <strong>Market</strong>s 2000,” Environmental<br />
Business Journal, vol. XII, no. 9/10, 2000.<br />
Appendix F<br />
Helpful Documents<br />
88 U.S. Department of Commerce, International Trade Administration<br />
“The Top 200 International Design Firms,” Engineering<br />
News Record, July 17, 2000.<br />
Private-Sector Reports<br />
Baudon, T., “Developing <strong>Water</strong> Projects in Emerging<br />
<strong>Market</strong>s: What Are the Challenges <strong>and</strong> What Does it Take<br />
to Succeed?” Global Infrastructure Development: World<br />
<strong>Market</strong>s in 1999, St<strong>and</strong>ard & Poors, 1998.<br />
Central <strong>and</strong> Eastern European <strong>Water</strong> <strong>and</strong> <strong>Wastewater</strong><br />
Treatment Equipment <strong>Market</strong>s, Frost & Sullivan, report<br />
no. 3792-15, 2000.<br />
European Commercial Scale <strong>Water</strong> Treatment Equipment<br />
<strong>Market</strong>s, Frost & Sullivan, report no. 3822-15, 2000.<br />
Goldman Sachs, B2B: 2B or Not 2B? version 1.1, part 1<br />
of 5, November 12, 1999.<br />
Middle Eastern, North African, <strong>and</strong> European Desalination<br />
<strong>Plan</strong>t <strong>Market</strong>s, Frost & Sullivan, report no. 3857-<br />
15, 2000.<br />
Other Reports<br />
<strong>Export</strong> Commodity Report, Oregon State University,<br />
1994–1998.<br />
Financial Performance <strong>and</strong> Expenditure of the <strong>Water</strong><br />
Companies in Engl<strong>and</strong> <strong>and</strong> Wales: 1999–2000. Office of<br />
<strong>Water</strong> Services, 2000 (www.ofwat.gov.uk).<br />
Global <strong>Water</strong> Supply <strong>and</strong> Sanitation Assessment: 2000<br />
Report, World Health Organization, 2000.<br />
Silva, et al., “Private Participation in the <strong>Water</strong> <strong>and</strong> Sewerage<br />
Sector—Recent Trends,” Public Policy for the Private<br />
Sector, The World Bank Group, 1998.
Appendix G<br />
<strong>Water</strong> Equipment Harmonized<br />
Tariff Schedule (HTS) Numbers<br />
3926909885 other articles of plastic <strong>and</strong> other materials, headings 3901–3914, NESOI<br />
4601200000 mats, matting, <strong>and</strong> screens of vegetable materials<br />
5603140000 non-wovens, of manmade filament, weighing greater than 150g/m2 8413600020 hydraulic fluid power pumps, rotary positive, vane<br />
8413600030 hydraulic fluid power pumps, rotary positive displacement<br />
8413600040 hydraulic fluid power pumps, rotary positive displacement<br />
8413600070 roller pumps, rotary positive displacement<br />
8413600090 rotary positive displacement pumps, NESOI<br />
8413702004 submersible pumps, centrifugal<br />
8413702005 centrifugal pump, single-stage, single-suction, close-coupled, discharge outlet under 5.08 cm<br />
in diameter<br />
8413702015 centrifugal pump, single-stage, single-suction, close-coupled, discharge outlet over 5.08 cm in<br />
diameter<br />
8413702022 centrifugal pump, single-stage, single-suction, frame-mounted, discharge outlet under 7.6 cm<br />
in diameter<br />
8413702025 centrifugal pump, single-stage, single-suction, frame-mounted, discharge outlet over 7.6 cm in<br />
diameter<br />
8413702030 centrifugal pumps, single-stage, double-suction<br />
8413702040 centrifugal pumps, multi-stage, single- or double-suction<br />
8413702090 centrifugal pumps for liquids, NESOI<br />
8413810020 turbine pumps, NESOI<br />
8413810030 household water systems, self-contained; windmill pumps<br />
8413810040 pumps for liquids, NESOI<br />
8421210000 water filtering or purifying machinery <strong>and</strong> apparatus<br />
8421290005 refrigerant recovery <strong>and</strong> recycling units<br />
8421290015 oil-separation equipment<br />
8421290040 hydraulic fluid power filters, rated ge 1000 kpa<br />
8421290065 other filtering, purifying equipment for liquids NESOI<br />
8479820040 mixing, kneading, or stirring machines, NESOI<br />
8479909565 parts of machines/mechanical appliances for treat mtl, NESOI<br />
8479909580 other parts of machines <strong>and</strong> mechanical appliances<br />
NESOI = not elsewhere specified or included<br />
Source: U.S. International Trade Commission, Harmonized Tariff Schedule of the United States Annotated for Statistical Reporting Purposes,<br />
14th ed. (Washington, D.C.: U.S. Government Printing Office, 2001).<br />
<strong>Water</strong> <strong>and</strong> <strong>Wastewater</strong> <strong>Export</strong> <strong>Market</strong> <strong>Plan</strong><br />
89
Appendix H<br />
U.S. <strong>Export</strong>s of <strong>Water</strong> Equipment by Country,<br />
1996–2000 (U.S. dollars)<br />
Country 1996 1997 1998 1999 2000<br />
Mexico 93,343,528 127,157,630 1,289,996,024 1,872,116,328 2,390,043,094<br />
Canada 409,997,307 482,477,551 989,460,379 1,295,019,848 1,344,168,465<br />
Japan 176,353,541 144,427,435 174,236,876 374,991,002 449,632,374<br />
South Korea 102,886,025 83,996,914 38,458,813 248,243,991 390,933,496<br />
Taiwan 60,743,153 77,967,756 108,215,349 244,196,294 362,394,294<br />
Singapore 36,646,507 45,230,488 61,353,899 183,567,220 262,563,797<br />
Germany 67,208,335 61,333,742 88,682,297 170,097,231 230,560,520<br />
United Kingdom 75,019,301 79,073,038 143,278,219 196,174,867 208,886,139<br />
France 53,110,661 86,978,086 115,563,487 163,321,098 178,407,443<br />
China 41,354,395 45,127,524 63,643,971 99,783,457 126,844,896<br />
Netherl<strong>and</strong>s 20,896,491 30,900,506 43,724,770 133,969,341 105,169,938<br />
Malaysia 26,023,435 29,156,205 18,141,955 66,113,790 96,348,261<br />
Italy 13,532,509 16,173,438 25,581,771 64,493,152 84,913,383<br />
Belgium 24,447,034 39,228,640 57,688,342 69,368,090 84,329,724<br />
Israel 10,459,408 10,161,733 13,974,421 64,192,547 77,280,271<br />
Australia 34,644,327 40,091,322 51,484,883 68,254,903 63,593,976<br />
Philippines 20,207,644 25,620,903 16,667,567 65,699,970 63,205,375<br />
Hong Kong 29,198,793 32,368,092 43,258,295 57,848,505 61,016,339<br />
Saudi Arabia 39,202,950 57,230,214 42,749,539 41,917,655 48,371,345<br />
Irel<strong>and</strong> 3,947,662 7,114,857 13,589,077 45,061,967 44,942,225<br />
Brazil 20,840,445 33,318,195 39,477,569 45,793,730 44,434,150<br />
Venezuela 14,229,571 15,042,739 23,153,567 39,124,016 39,287,994<br />
Russia 12,528,744 18,531,684 21,672,546 30,407,587 35,641,692<br />
Thail<strong>and</strong> 36,052,558 38,921,066 25,734,794 27,729,191 33,764,047<br />
Spain 13,345,247 14,878,713 19,030,488 38,774,007 33,153,723<br />
Egypt 19,326,968 19,330,024 18,028,679 27,061,179 26,099,155<br />
India 16,725,260 12,256,370 21,372,203 19,488,029 24,094,831<br />
Argentina 16,066,988 13,926,747 21,339,355 27,439,289 19,422,350<br />
Switzerl<strong>and</strong> 7,402,770 6,011,720 7,633,475 22,023,096 18,887,465<br />
Chile 14,992,963 22,293,715 18,570,350 17,453,843 18,679,696<br />
United Arab Emirates 10,404,792 9,779,734 10,042,325 18,884,156 17,783,142<br />
Kuwait 12,982,402 5,583,950 13,624,825 5,918,198 15,216,345<br />
Sweden 6,836,346 8,143,899 9,427,262 13,572,077 15,008,546<br />
Czech Republic 1,606,234 886,805 2,068,443 3,107,089 14,991,975<br />
Dominican Republic 4,127,007 3,243,029 7,541,428 7,918,970 12,045,521<br />
Republic of South Africa 7,218,152 11,034,848 11,802,615 10,998,955 11,852,622<br />
Austria 3,172,623 3,797,140 8,331,394 12,905,912 11,617,969<br />
Peru 4,438,113 9,620,736 12,864,125 8,316,944 11,170,875<br />
Hungary 425,422 340,085 604,539 2,272,754 10,528,350<br />
Indonesia 20,167,804 11,940,330 8,923,994 13,230,407 10,481,445<br />
Aruba 276,884 399,702 7,040,696 58,830,092 9,799,351<br />
Colombia 14,691,827 11,595,861 15,273,857 17,647,388 9,793,857<br />
90 U.S. Department of Commerce, International Trade Administration
Country 1996 1997 1998 1999 2000<br />
Denmark 9,847,560 6,872,075 8,428,985 10,127,250 9,749,023<br />
New Zeal<strong>and</strong> 5,060,169 6,149,190 7,782,156 12,773,825 9,042,307<br />
Honduras 1,541,329 1,863,322 4,611,699 7,746,125 8,582,086<br />
Brunei 3,010,596 1,034,780 748,780 1,761,796 8,528,789<br />
Costa Rica 3,400,613 2,030,650 3,589,460 8,660,123 7,957,232<br />
Finl<strong>and</strong> 5,366,144 3,387,242 4,916,642 9,696,857 7,873,401<br />
Turkey 5,986,321 16,792,489 17,481,784 14,627,019 7,404,486<br />
Algeria 3,084,290 2,400,537 1,790,405 3,004,073 6,737,342<br />
Bahamas 2,225,061 5,602,573 3,438,720 2,856,137 5,539,359<br />
Norway 2,201,109 3,728,101 4,202,744 5,840,591 4,433,538<br />
Jamaica 2,628,790 2,548,887 4,165,514 2,992,951 4,423,618<br />
Trinidad <strong>and</strong> Tobago 1,584,751 5,817,088 3,925,879 3,660,501 4,189,865<br />
Pol<strong>and</strong> 4,029,119 4,538,150 4,722,754 5,767,893 3,994,755<br />
Guatemala 1,819,865 2,383,709 5,962,612 5,271,870 3,945,651<br />
Ecuador 4,570,760 6,575,657 5,825,572 5,958,286 3,941,795<br />
Nigeria 1,855,543 1,046,557 6,083,844 2,464,253 3,831,012<br />
El Salvador 2,049,595 3,018,717 2,505,590 3,896,969 3,672,651<br />
Panama 1,231,935 1,482,369 6,693,049 9,065,526 3,644,975<br />
Kazakhstan 115,031 215,179 732,380 880,394 3,482,866<br />
Jordan 2,696,061 2,579,963 4,706,286 2,433,578 3,365,946<br />
Greece 1,698,359 7,201,040 2,545,769 5,223,201 3,296,321<br />
Cyprus 263,009 459,306 531,312 1,131,102 2,893,168<br />
Paraguay 241,461 710,914 691,831 227,829 2,630,221<br />
Qatar 1,034,475 7,435,876 771,305 1,326,001 2,593,578<br />
Portugal 2,177,537 1,807,911 1,720,345 3,433,549 2,559,337<br />
Malta <strong>and</strong> Gozo 587,186 1,102,659 1,551,673 1,181,489 2,453,119<br />
Angola 433,268 287,511 2,705,289 3,007,116 1,900,579<br />
Oman 8,154,660 4,244,563 2,223,178 2,166,612 1,873,302<br />
Kenya 176,379 370,269 372,216 446,882 1,831,741<br />
Haiti 395,283 233,886 448,134 360,274 1,792,342<br />
Azerbaijan 1,028,035 334,278 28,225 41,722 1,746,466<br />
Vietnam 2,125,510 1,036,905 1,658,334 2,332,430 1,658,506<br />
Bermuda 562,691 378,559 886,069 2,624,259 1,656,159<br />
Tunisia 792,580 871,525 2,085,583 579,709 1,637,262<br />
Bahrain 575,170 511,059 1,219,054 1,859,758 1,618,225<br />
Nicaragua 838,346 642,655 599,960 1,018,075 1,469,967<br />
Icel<strong>and</strong> 216,253 673,976 632,687 695,512 1,353,039<br />
Pakistan 1,058,705 5,146,099 4,223,487 2,330,943 1,334,016<br />
Barbados 185,558 341,351 446,966 2,259,034 1,327,151<br />
Belize 1,095,432 512,803 887,410 1,840,257 1,323,897<br />
Senegal 116,897 134,012 41,763 98,600 1,219,891<br />
Grenada 118,539 104,059 3,124,868 472,319 1,203,998<br />
Morocco 171,820 337,138 4,065,154 2,853,543 1,165,538<br />
Slovenia 289,229 19,342 353,276 130,197 1,145,730<br />
Uzbekistan 527,137 450,854 234,289 1,464,970 1,120,221<br />
Croatia 44,654 1,943,477 247,565 196,462 1,108,842<br />
Syria 1,664,977 1,359,089 1,776,321 1,274,448 1,056,534<br />
Netherl<strong>and</strong>s Antilles 593,732 2,758,352 717,390 2,699,495 1,027,035<br />
<strong>Water</strong> <strong>and</strong> <strong>Wastewater</strong> <strong>Export</strong> <strong>Market</strong> <strong>Plan</strong><br />
91
Country 1996 1997 1998 1999 2000<br />
Bolivia 613,201 1,273,386 1,119,340 2,387,346 992,173<br />
Romania 645,431 650,267 381,705 1,512,744 867,201<br />
Suriname 785,763 534,714 601,938 634,954 714,186<br />
Uruguay 692,387 865,943 544,900 1,465,742 684,388<br />
Sri Lanka (Ceylon) 371,504 177,335 693,253 1,044,625 547,424<br />
Congo<br />
Federated States<br />
136,952 830,719 1,530,088 429,782 537,877<br />
of Micronesia 0 2,660 265,857 74,295 535,262<br />
Luxembourg 285,532 62,404 410,173 1,139,943 533,616<br />
Ghana 615,420 423,613 246,446 654,284 519,772<br />
Lebanon 2,007,816 2,761,344 1,598,702 1,407,620 503,449<br />
Macedonia 0 0 97,278 398,871 493,418<br />
Latvia 140,335 557,759 390,094 390,318 464,678<br />
Yemen (Sana) 107,186 119,499 306,065 557,149 458,385<br />
Slovakia 56,123 159,718 1,099,429 474,028 411,617<br />
Nauru 0 0 21,587 23,160 404,461<br />
Ukraine 294,952 3,832,211 3,019,641 504,612 383,258<br />
Cayman Isl<strong>and</strong>s 223,476 534,906 685,546 1,841,604 362,291<br />
Antigua Barbuda 459,127 87,773 528,581 296,677 279,687<br />
St. Lucia 123,604 93,956 537,282 564,039 271,225<br />
Guyana 206,480 346,004 173,694 1,226,128 269,032<br />
British Virgin Isl<strong>and</strong>s 146,803 290,989 198,371 258,789 255,786<br />
Bangladesh 755,373 454,877 580,392 157,543 254,924<br />
Malawi 82,218 0 12,629 4,823 244,822<br />
Lithuania 91,786 1,053,145 172,084 1,588,935 230,394<br />
Gabon 34,881 45,033 274,996 27,771 226,108<br />
Turks <strong>and</strong> Caicos Isl<strong>and</strong>s 184,411 463,223 542,247 395,202 217,243<br />
Guadeloupe 108,369 132,083 320,062 143,918 217,022<br />
Mauritius 644,587 2,590 116,818 145,421 205,148<br />
Burkina Faso (Upper Volta) 0 12,120 0 70,000 196,575<br />
Belarus 474,125 511,712 448,533 708,025 192,284<br />
St. Christopher-Nevis 63,968 156,205 38,907 153,840 169,319<br />
Zaire 320,268 16,203 33,425 14,602 167,974<br />
Anguilla 25,593 65,612 164,139 428,354 163,004<br />
Bosnia-Herzegovina 0 0 25,124 39,166 161,433<br />
Fiji 97,376 10,440 12,997 155,292 153,406<br />
Seychelles 21,846 0 587,105 55,022 149,741<br />
Zimbabwe 120,462 145,603 73,357 157,340 146,461<br />
Georgia 399,271 156,347 0 37,215 136,559<br />
Tanzania 3,440 3,136 28,020 74,977 126,547<br />
Ug<strong>and</strong>a 0 0 84,101 26,644 123,531<br />
French Polynesia 152,690 184,026 202,501 528,683 121,746<br />
Madagascar 0 0 26,866 83,461 120,548<br />
Cameroon 89,506 58,000 79,581 351,011 111,423<br />
Turkmenistan 54,255 288,352 11,919 90,775 107,355<br />
Rw<strong>and</strong>a 0 0 8,191 0 103,000<br />
Tokelau Isl<strong>and</strong>s 0 0 11,618 0 102,262<br />
Ethiopia 145,276 12,845 128,177 8,188 97,724<br />
92 U.S. Department of Commerce, International Trade Administration
Country 1996 1997 1998 1999 2000<br />
Estonia 95,187 16,341 223,900 166,759 95,467<br />
Palau 0 104,794 38,400 38,160 81,185<br />
Maldive Isl<strong>and</strong>s 187,395 269,335 347,875 586,019 79,738<br />
Bulgaria 59,619 45,579 131,375 1,003,722 79,023<br />
Mali 4,584 57,746 5,638 10,432 76,276<br />
Togo 0 43,545 17,313 93,736 73,300<br />
Western Samoa 3,000 20,900 2,602 3,477 72,320<br />
Mozambique 111,625 170,768 20,265 100,030 68,510<br />
Ivory Coast 15,111 2,268,151 181,688 56,308 66,899<br />
Macao 11,145 167,942 371,586 98,747 58,784<br />
French Guiana 24,052 36,194 49,368 93,710 53,939<br />
Sierra Leone 8,315 0 0 0 51,223<br />
Equatorial Guinea 840,610 1,365,998 1,029,403 1,443,188 40,197<br />
Burma (Myanmar) 63,983 2,693 23,000 115,713 36,979<br />
Chad 10,618 15,055 82,826 0 36,300<br />
Liechtenstein 6,035 5,725 19,109 0 34,524<br />
Papua New Guinea 52,512 78,809 31,951 120,203 33,609<br />
Niger 0 18,922 0 0 33,372<br />
St. Vincent <strong>and</strong> Grenadines 6,953 73,028 61,726 83,001 33,073<br />
New Caledonia 153,882 82,815 4,811 359,219 31,743<br />
Martinique 41,532 16,192 88,299 927,985 28,887<br />
Mauritania 32,076 6,047 7,759 2,793 27,761<br />
Guinea 54,866 19,180 36,960 127,435 24,929<br />
Albania 12,354 0 0 65,465 18,819<br />
Gibraltar 45,001 47,735 26,466 19,429 18,554<br />
Réunion 0 46,028 0 17,090 13,278<br />
Marshall Isl<strong>and</strong>s 141,621 91,758 330,089 330,516 12,191<br />
St. Pierre <strong>and</strong> Miquelon 0 0 0 9,973 12,088<br />
Swazil<strong>and</strong> 0 7,150 0 48,677 11,600<br />
Dominica 29,070 4,980 27,797 69,763 11,232<br />
West Bank 0 0 9,609 0 10,430<br />
Liberia 0 29,740 35,531 360,589 10,280<br />
Djibouti 13,000 56,099 62,889 54,092 9,702<br />
Zambia 10,646 81,672 154,254 65,278 8,529<br />
Eritrea<br />
Yugoslavia<br />
7,629 0 49,130 65,651 6,720<br />
(Serbia/Montenegro) 0 436,193 35,157 29,186 6,533<br />
Montserrat 0 96,306 0 2,560 6,228<br />
Namibia 32,502 84,478 16,820 0 5,513<br />
Lesotho 0 0 2,814 0 5,000<br />
Cape Verde 0 28,685 0 274,624 4,903<br />
Kiribati (Gilbert Isl<strong>and</strong>s) 3,619 8,890 0 4,100 4,771<br />
Moldova 0 34,037 587,084 217,103 4,500<br />
São Tome <strong>and</strong> Principe 0 0 0 0 3,964<br />
Mongolia 7,740 7,950 19,612 21,646 2,863<br />
Cambodia (Kampuchea) 2,865 28,600 21,078 0 2,590<br />
Vanuatu (New Hebrides) 0 0 0 0 2,547<br />
Andorra 0 0 17,604 0 0<br />
<strong>Water</strong> <strong>and</strong> <strong>Wastewater</strong> <strong>Export</strong> <strong>Market</strong> <strong>Plan</strong><br />
93
Country 1996 1997 1998 1999 2000<br />
Benin 0 0 4,853 0 0<br />
Botswana 0 60,000 0 30,425 0<br />
Central African Republic 0 231,249 0 12,473 0<br />
Cook Isl<strong>and</strong>s 2,563 0 4,102 0 0<br />
Faroe Isl<strong>and</strong>s<br />
French S. Antarctic<br />
0 0 50,130 71,698 0<br />
Territory 0 130,962 0 0 0<br />
Gambia 16,268 0 0 34,429 0<br />
Gaza Strip 0 0 0 540,598 0<br />
Greenl<strong>and</strong> 44,859 3,341 0 11,015 0<br />
Korea, North 0 0 0 8,390 0<br />
Kyrgyzstan 2,551 28,650 381,433 0 0<br />
Laos 0 0 121,149 0 0<br />
Nepal 217,000 31,506 222,372 34,654 0<br />
Niue 339,441 926,519 0 0 0<br />
Solomon Isl<strong>and</strong>s 0 0 0 6,495 0<br />
Sudan<br />
Svalbard,<br />
154,328 102,150 0 0 0<br />
Jan Mayen Isl<strong>and</strong> 0 0 14,260 97,829 0<br />
Tonga 0 3,802 2,782 3,210 0<br />
Total 1,703,201,600 1,939,040,860 3,885,819,399 6,186,760,483 7,295,843,950<br />
Source: U.S. International Trade Commission, Harmonized Tariff Schedule of the United States Annotated for Statistical Reporting Purposes,<br />
14th ed. (Washington, D.C.: U.S. Government Printing Office, 2001).<br />
94 U.S. Department of Commerce, International Trade Administration
95<br />
<strong>Water</strong> <strong>and</strong> <strong>Wastewater</strong> <strong>Export</strong> <strong>Market</strong> <strong>Plan</strong><br />
Appendix I<br />
<strong>Water</strong> Equipment <strong>Export</strong>s by HS Number, 1996–2000<br />
(domestic exports, FAS value, U.S. dollars)<br />
HS Number Description 1996 1997 1998 1999 2000<br />
3926909885 Oth Art of Plastic <strong>and</strong> Oth Mat, Hdg 3901-3914, NESOI 0 0 1,946,467,338 2,398,615,497 2,860,166,919<br />
4601200000 Mats, Matting <strong>and</strong> Screens of Vegetable Materials 2,517,038 2,957,518 3,228,831 3,172,077 4,795,897<br />
5603140000 Nonwovens, of Manmade Filament,Weighing Gt 150g/M2 30,121,265 47,894,757 52,534,167 43,537,218 88,652,769<br />
8413600020 Hydraulic Fluid Power Pumps, Rotary Positive, Vane 117,247,416 104,178,978 129,505,111 197,175,250 191,620,001<br />
8413600030 Hydraulic Fluid Power Pumps, Rotary Positive Displ 36,583,572 44,271,788 43,957,145 37,089,486 39,232,439<br />
8413600040 Hydraulic Fluid Power Pumps, Rotary Positive Displ 44,157,484 58,377,691 79,496,790 66,748,744 64,038,300<br />
8413600070 Roller Pumps, Rotary Positive Displacement 915,700 1,169,156 2,711,892 5,538,850 2,194,256<br />
8413600090 Rotary Positive Displacement Pumps, NESOI 107,055,546 132,425,519 107,547,131 109,747,960 120,703,574<br />
8413702004 Submersible Pumps, Centrifugal 63,318,194 74,142,726 61,866,804 73,067,782 80,231,956<br />
8413702005 Cent Pmp Liq,Sing-Stg,Sing-Suc,Clos-Coup, Dis5.08cm 28,825,891 28,202,965 20,955,834 20,296,618 18,941,926<br />
8413702015 Cent Pmp Liq,Sing-Stg,Sing-Suc,Clos-Coup, Ov 5.08cm 10,703,595 8,369,752 5,455,856 7,499,621 6,996,571<br />
8413702022 Cent Pmp Liq,Sing-Stg,Sing-Suc,Clos-Coup, Disc7.6cm 26,199,344 28,592,995 22,819,717 19,124,232 20,058,405<br />
8413702025 Cent Pmp Liq,Sing-Stg,Sing-Suc,Clos-Coup, Ov C7.6cm 27,672,914 32,158,716 24,733,877 21,258,470 25,744,541<br />
8413702030 Centrifugal Pumps for Liquids, Sing-Stage, Dbl-Suc 5,281,174 10,778,979 8,099,479 5,571,524 7,215,520<br />
8413702040 Cent Pumps for Liquids Multi-Stag,Sing or Doub-Suc 39,376,422 52,761,930 57,380,236 50,144,464 49,601,298<br />
8413702090 Centrifugal Pumps for Liquids, NESOI 110,852,434 134,713,883 154,488,235 149,244,613 159,221,126<br />
8413810020 Turbine Pumps, NESOI 20,932,622 23,686,464 30,652,747 31,136,119 29,837,688<br />
8413810030 Household <strong>Water</strong> Syst,Self-Contain; Windmill Pumps 11,123,433 11,845,861 6,854,429 8,614,371 7,881,434<br />
8413810040 Pumps for Liquids, NESOI 178,141,773 193,160,963 190,626,591 192,606,318 200,601,340<br />
8421210000 <strong>Water</strong> Filtering or Purifying Machinery & Apparatus 634,790,553 664,389,246 628,338,373 579,591,512 638,157,780<br />
8421290005 Refrigerant Recovery <strong>and</strong> Recycling Units 2,287,885 2,274,773 5,131,453 8,860,041 13,586,039<br />
8421290015 Oil-Separation Equipment 22,328,945 28,726,226 28,897,677 22,516,084 28,560,531<br />
8421290040 Hydraulic Fluid Power Filters, Rated Ge 1000 Kpa 6,746,503 8,704,507 9,343,805 14,809,992 16,531,155<br />
8421290065 Other Filtering,Purifying Equip. for Liquids, NESOI 176,021,897 188,187,767 206,742,199 235,153,517 218,225,109<br />
8479820040 Mixing, Kneading or Stirring Machines, NESOI 0 57,067,700 57,983,682 56,850,010 46,059,286<br />
8479909565 Parts of Mach/Mechanical Appl for Treat Mtl, NESOI 0 0 0 22,789,832 27,283,920<br />
8479909580 Other Parts of Mach & Mechanical Appliances 0 0 0 1,806,000,281 2,329,704,170<br />
Total 1,703,201,600 1,939,040,860 3,885,819,399 6,186,760,483 7,295,843,950<br />
NESOI = not elsewhere specified or included<br />
Source: U.S. International Trade Commission, Harmonized Tariff Schedule of the United States Annotated for Statistical Reporting Purposes, 14th ed. (Washington, D.C.: U.S. Government<br />
Printing Office, 2001).
Appendix J<br />
U.S. Imports of <strong>Water</strong> Equipment by Country,<br />
1996–2000 (imports for consumption,<br />
Customs value, U.S. dollars)<br />
Country 1996 1997 1998 1999 2000<br />
Canada 523,764,993 611,943,451 714,236,373 857,201,935 941,134,164<br />
Japan 652,019,047 642,685,660 616,871,948 627,582,023 741,586,794<br />
China 569,998,125 480,060,828 428,283,935 524,155,775 635,652,323<br />
Germany 458,014,550 503,896,405 542,250,365 562,207,696 574,370,738<br />
Mexico 220,495,897 273,602,037 397,456,859 411,005,780 415,702,127<br />
United Kingdom 207,900,915 250,737,527 288,998,862 346,357,762 292,326,227<br />
Italy 166,924,999 211,604,096 194,804,522 246,276,890 217,078,083<br />
Taiwan 162,373,691 164,048,077 171,065,192 182,285,181 211,704,115<br />
Sweden 101,989,697 104,360,940 105,012,838 112,735,178 149,751,436<br />
France 101,756,658 103,401,229 106,741,578 116,719,994 117,265,332<br />
Switzerl<strong>and</strong> 81,789,770 81,038,280 100,447,009 116,862,502 109,956,485<br />
Netherl<strong>and</strong>s 61,118,843 55,404,048 49,250,878 66,330,210 77,452,763<br />
South Korea 68,337,106 67,271,693 58,193,781 59,100,084 67,101,440<br />
Israel 45,981,046 46,432,483 55,937,179 47,054,243 63,952,632<br />
Irel<strong>and</strong> 17,033,982 22,962,434 21,761,268 43,597,804 45,501,025<br />
Hong Kong 48,590,157 45,716,001 31,421,936 30,372,128 38,043,249<br />
Belgium 31,043,384 25,474,502 27,849,730 30,031,682 37,894,170<br />
Denmark 36,122,132 41,971,332 26,520,357 34,637,065 36,494,768<br />
Austria 19,151,442 26,433,750 28,243,441 31,070,368 32,480,858<br />
Finl<strong>and</strong> 19,449,472 20,954,600 32,299,527 26,082,709 28,517,870<br />
Australia 13,872,873 11,360,687 23,662,830 15,820,135 22,418,948<br />
Spain 11,927,766 12,106,823 18,459,380 13,350,398 22,224,890<br />
Dominican Republic 9,648,486 9,082,796 10,436,062 12,528,124 19,023,474<br />
Brazil 15,567,582 14,685,568 17,677,855 13,839,663 18,439,571<br />
Singapore 19,142,990 24,426,235 28,258,815 15,347,222 17,056,955<br />
India 5,555,414 5,060,965 6,491,813 9,158,304 14,501,264<br />
Malaysia 14,221,177 8,679,515 10,962,720 11,065,929 14,229,996<br />
Thail<strong>and</strong> 16,672,814 21,790,559 12,146,384 10,607,940 12,973,605<br />
Costa Rica 8,215,662 9,365,890 7,734,794 8,578,133 8,697,079<br />
Norway 6,341,165 7,861,444 7,006,100 5,818,503 7,458,694<br />
Republic of South Africa 6,473,088 8,434,128 6,774,349 7,129,991 7,265,435<br />
Pol<strong>and</strong> 2,960,479 5,082,631 3,727,971 4,834,751 6,898,556<br />
Turkey 4,148,600 3,012,612 4,942,419 4,360,378 6,565,716<br />
Philippines 5,622,667 9,174,422 4,606,780 4,555,622 6,054,629<br />
Hungary 1,224,226 2,146,367 3,133,816 3,838,338 5,906,183<br />
New Zeal<strong>and</strong> 1,747,727 2,438,139 2,561,635 3,235,899 5,518,492<br />
Indonesia 6,976,310 3,368,501 4,339,911 4,057,221 4,628,107<br />
Czech Republic 1,700,554 1,188,138 1,801,259 2,230,996 4,081,709<br />
Sri Lanka (Ceylon) 74,927 317,076 394,970 660,008 2,384,703<br />
Colombia 441,988 649,613 563,421 969,754 2,129,617<br />
96 U.S. Department of Commerce, International Trade Administration
Country 1996 1997 1998 1999 2000<br />
Honduras 66,912 407,522 788,689 632,175 1,318,806<br />
Venezuela 1,386,114 1,613,814 1,064,820 818,719 1,053,567<br />
Argentina 750,714 467,188 339,771 539,293 1,046,212<br />
Luxembourg 310,662 543,754 680,452 200,233 994,626<br />
Slovenia 1,014,580 652,090 539,715 665,892 942,490<br />
Portugal 804,275 577,528 675,519 1,065,488 849,386<br />
Panama 101,835 58,013 339,223 289,128 600,863<br />
Chile 327,742 169,496 302,656 268,835 594,355<br />
Greece 598,789 2,029,228 735,956 678,801 549,136<br />
Trinidad <strong>and</strong> Tobago 85,928 267,146 699,122 857,518 486,351<br />
Macao 184,769 859,194 182,490 80,162 485,363<br />
Saudi Arabia 47,472 15,352 7,194 114,294 437,125<br />
Egypt 99,045 10,662 30,569 260,925 434,246<br />
Bangladesh 80,690 45,619 10,138 42,036 429,859<br />
Slovakia 251,603 170,238 279,134 596,679 365,683<br />
West Bank 0 0 0 0 289,581<br />
Lithuania 83,212 149,518 135,028 182,597 282,900<br />
United Arab Emirates 342,768 645,380 81,789 130,569 246,567<br />
Russia 818,822 555,721 266,678 166,847 238,959<br />
Liechtenstein 522,252 684,763 588,081 609,047 220,324<br />
Oman 9,000 0 8,811 65,667 214,999<br />
Jamaica 80,881 154,507 146,655 56,839 187,325<br />
Bulgaria 21,335 46,312 56,719 78,823 185,103<br />
El Salvador 5,247 12,766 1,873 10,937 163,801<br />
Peru 92,477 107,507 497,951 127,635 159,552<br />
Guatemala 58,484 28,626 63,939 103,016 125,033<br />
Romania 38,860 66,664 45,462 28,321 123,808<br />
Icel<strong>and</strong> 69,890 37,503 21,435 55,654 110,242<br />
Malta <strong>and</strong> Gozo 50,687 77,332 8,987 11,737 100,859<br />
Niger 4,388 1,456 51,087 8,428 99,031<br />
Bahrain 0 0 42,400 22,823 95,709<br />
Cameroon 263,015 0 117,593 28,034 91,618<br />
Pakistan 11,492 20,784 102,445 38,945 90,614<br />
Mongolia 0 0 0 0 88,224<br />
Bolivia 0 0 0 10,644 87,489<br />
Congo 1,679 0 0 0 68,714<br />
Ecuador 122,577 28,139 97,390 334,136 67,108<br />
Vietnam 26,547 13,672 40,995 75,482 66,588<br />
Croatia 17,069 15,598 46,087 98,527 60,328<br />
Georgia 7,216 0 25,900 993 59,635<br />
Jordan 10,485 4,245 3,359 0 58,485<br />
St. Lucia 1,560,852 282,193 96,308 88,975 53,688<br />
St. Christopher-Nevis 27,708 86,000 340,982 44,193 50,546<br />
Monaco 32,872 12,399 42,709 116,545 50,200<br />
Estonia 29,725 29,016 199,412 395,543 49,186<br />
Kenya 27,636 65,943 23,295 338,966 45,181<br />
Barbados 13,207 20,770 57,285 18,669 43,656<br />
Cambodia (Kampuchea) 2,369 0 0 20,940 37,024<br />
<strong>Water</strong> <strong>and</strong> <strong>Wastewater</strong> <strong>Export</strong> <strong>Market</strong> <strong>Plan</strong><br />
97
Country 1996 1997 1998 1999 2000<br />
Macedonia 0 0 0 0 35,408<br />
Morocco 1,919 3,054 2,486 5,585 33,364<br />
Mauritius 160,027 103,004 15,242 752 23,918<br />
Ukraine 6,569 45,319 45,828 205,696 22,854<br />
Qatar 0 1,530 2,000 10,927 22,509<br />
Nigeria 3,549 2,999 3,883 2,679,756 21,528<br />
Haiti 377,809 14,053 13,107 20,268 21,199<br />
Nepal 0 5,234 12,997 17,592 17,889<br />
Cyprus 0 85,444 66,414 19,635 17,754<br />
Nicaragua 490 0 0 11,557 17,387<br />
Madagascar 46,523 86,336 76,188 91,798 16,731<br />
Bahamas 2,805 8,563 10,324 1,671 16,114<br />
Fiji 446 0 10,409 20,334 15,866<br />
Lebanon 2,125 4,055 252 7,202 15,516<br />
Ivory Coast 32,705 17,502 4,496 53,209 15,128<br />
Netherl<strong>and</strong>s Antilles 0 43,256 71,610 1,500 14,740<br />
Suriname 1,059 2,187 3,484 1,507,062 14,713<br />
Syria 0 1,500 1,650 0 10,763<br />
Belize 960 0 270 0 10,500<br />
Bermuda 0 0 700 4,600 10,000<br />
Moldova 18,500 0 0 0 8,544<br />
Dominica 7,021 18,552 2,597 699 8,121<br />
Antigua Barbuda 0 0 0 0 7,529<br />
Sierra Leone 0 0 0 5,796 6,635<br />
São Tome <strong>and</strong> Principe 0 0 0 0 6,001<br />
Bosnia-Herzegovina 2,446 0 0 0 6,000<br />
Guyana 3,919 10,821 14,850 83,769 5,404<br />
Réunion 0 0 0 840 5,000<br />
Albania 0 0 9,310 0 4,300<br />
Montserrat 4,181 0 0 0 4,292<br />
Gibraltar 0 0 0 0 4,162<br />
Uruguay 11,574 157,500 103,653 10,238 4,147<br />
Greenl<strong>and</strong> 0 0 1,995 4,325 3,878<br />
Gabon 3,857 0 1,684 1,851 3,822<br />
Namibia 18,488 1,537 0 3,886 2,621<br />
Malawi 0 0 0 0 2,520<br />
Paraguay 0 1,541 0 0 2,293<br />
Christmas Isl<strong>and</strong> 0 0 0 0 2,264<br />
Brunei 2,276 8,725 0 0 2,054<br />
Burma (Myanmar) 0 0 0 43,754 1,706<br />
Belarus 0 912 14,511 6,797 1,592<br />
Ethiopia 0 0 0 0 762<br />
Zimbabwe 14,270 626 3,716 0 715<br />
Comoros 0 0 0 0 598<br />
Ghana 2,335 1,271 3,748 0 580<br />
Azerbaijan 0 750 0 0 507<br />
St. Vincent <strong>and</strong> Grenadines 0 0 0 0 446<br />
Maldive Isl<strong>and</strong>s 0 0 0 0 412<br />
98 U.S. Department of Commerce, International Trade Administration
Country 1996 1997 1998 1999 2000<br />
San Marino 0 676 261 0 378<br />
Tunisia 65,763 5,965 0 9,560 337<br />
Afghanistan 18,190 0 0 0 0<br />
Algeria 0 3,119 0 0 0<br />
Anguilla 4,320 0 0 0 0<br />
Armenia 23,258 6,740 15,950 4,184 0<br />
Aruba 0 3,000 0 0 0<br />
British Virgin Isl<strong>and</strong>s 727 0 1,566 0 0<br />
Burkina Faso (Upper Volta) 0 0 0 966 0<br />
Cayman Isl<strong>and</strong>s 0 2,795 0 0 0<br />
Chad 1,280 0 0 0 0<br />
Cocos (Keeling) Isl<strong>and</strong>s 0 0 4,610 0 0<br />
Faroe Isl<strong>and</strong>s 1,464 0 0 0 0<br />
Gambia 0 3,060 0 0 0<br />
Grenada 12,783 0 0 0 0<br />
Guadeloupe 0 1,756 11,675 0 0<br />
Kuwait 13,500 0 5,000 0 0<br />
Latvia 50,250 26,248 29,270 29,104 0<br />
Lesotho 0 918 5,109 0 0<br />
Mali 14,634 25,081 0 19,000 0<br />
Martinique 0 0 3,159 554 0<br />
Nauru 0 0 0 376 0<br />
New Caledonia 19,642 0 0 0 0<br />
Pitcairn Isl<strong>and</strong> 0 0 0 0 0<br />
Senegal 0 6,860 7,443 8,576 0<br />
Seychelles 0 5,000 0 0 0<br />
Somalia 0 9,072 0 0 0<br />
Swazil<strong>and</strong> 16,441 0 8,327 0 0<br />
Tanzania 0 0 579 16,500 0<br />
Tokelau Isl<strong>and</strong>s 0 16,156 0 0 0<br />
Tonga 1,522 1,900 0 15,670 0<br />
Uzbekistan 0 0 0 585 0<br />
Western Samoa 0 0 12,170 0 0<br />
Yemen (Sana)<br />
Yugoslavia<br />
0 0 0 23,814 0<br />
(Serbia/Montenegro) 0 11,067 12,500 0 0<br />
Zaire 0 2,000 0 0 0<br />
Total 3,757,825,910 3,952,022,824 4,183,831,988 4,638,984,016 5,057,395,868<br />
Source: U.S. International Trade Commission, Harmonized Tariff Schedule of the United States Annotated for Statistical Reporting Purposes,<br />
14th ed. (Washington, D.C.: U.S. Government Printing Office, 2001).<br />
<strong>Water</strong> <strong>and</strong> <strong>Wastewater</strong> <strong>Export</strong> <strong>Market</strong> <strong>Plan</strong><br />
99
100 U.S. Department of Commerce, International Trade Administration<br />
Appendix K<br />
U.S. Imports of <strong>Water</strong> Equipment by HS Number, 1996–2000 (U.S. dollars)<br />
HS Number Description 1996 1997 1998 1999 2000<br />
392690 articles of plastics, nesoi 1,908,833,690 1,910,533,895 2,025,435,385 2,284,724,537 2,527,923,676<br />
460120 mats, matting, <strong>and</strong> screens of vegetable materials 10,958,216 7,855,350 9,612,232 12,395,215 17,179,705<br />
560314 nonwovens, of mmf weighing > 150 g/m2 17,180,874 31,512,038 48,016,621 43,321,229 47,247,716<br />
841360 rotary positive displacement pumps, nesoi 233,539,895 235,875,813 268,354,258 251,046,026 253,490,101<br />
841370 centrifugal pumps, nesoi 205,625,192 226,541,461 247,372,965 280,594,744 303,390,268<br />
841381 pumps for liquids, nesoi 144,622,078 170,963,873 157,300,796 174,472,575 178,614,131<br />
842121 water filtering or purifying machinery <strong>and</strong> apparatus 149,569,842 138,672,248 188,164,488 240,938,783 252,919,155<br />
842129 filter/purify machine <strong>and</strong> apparatus for liquid nesoi 163,580,306 202,143,652 197,279,724 247,935,187 255,526,675<br />
847982 mixing, kneading, crushing, grinding machinery, etc. nesoi 110,563,006 111,874,023 117,215,608 136,468,280 148,696,105<br />
847990 pts of mach/mechncl appl w indvdul function nesoi 813,352,811 916,050,471 925,079,911 967,087,440 1,072,408,336<br />
Total 3,757,825,910 3,952,022,824 4,183,831,988 4,638,984,016 5,057,395,868<br />
Source: U.S. International Trade Commission, Harmonized Tariff Schedule of the United States Annotated for Statistical Reporting Purposes, 14th ed. (Washington, D.C.:<br />
U.S. Government Printing Office, 2001).