Download the presentation slides - Elkhorn Slough Foundation
Download the presentation slides - Elkhorn Slough Foundation
Download the presentation slides - Elkhorn Slough Foundation
You also want an ePaper? Increase the reach of your titles
YUMPU automatically turns print PDFs into web optimized ePapers that Google loves.
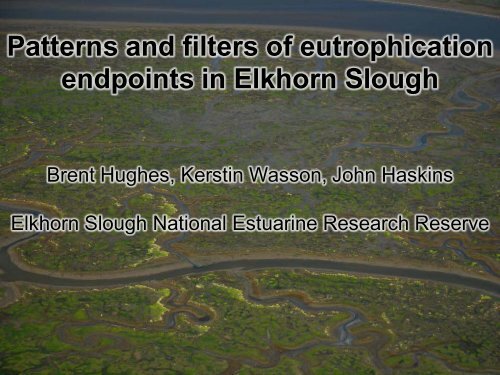
Patterns and filters of eutrophicationendpoints in <strong>Elkhorn</strong> <strong>Slough</strong>Brent Hughes, Kerstin Wasson, John Haskins<strong>Elkhorn</strong> <strong>Slough</strong> National Estuarine Research Reserve
What is Eutrophication?Source: Associated Press
Conceptual Evolution of CoastalEutrophication•Early models focused on lakes, which have a directresponse to nutrient addition (Volenweider 1976)Direct ResponsesNutrientsPrimary ProductivityOrganic DepositionMicrobial ActivityHypoxiaFrom Cloern (2001)
Conceptual Evolution of CoastalEutrophication•Current models recognize variability in response amongestuaries due to various filters, as well as indirectresponses.NutrientsFiltersTurbidityDepthCurrentsTidesMarshDirect ResponsesPrimary ProductivityOrganic DepositionMicrobial ActivityFrom Cloern (2001)Indirect ResponsesBottom DOCommunityDiversityFood Webs
Study Goals1. Characterize <strong>the</strong> spatial dynamics ofeutrophication in <strong>Elkhorn</strong> <strong>Slough</strong>2. Understand filters of eutrophication, with anemphasis on tidal range.3. Focus on eutrophication within an estuary,instead of between estuaries.
<strong>Elkhorn</strong> <strong>Slough</strong>, CA: a highly altered estuary
Eutrophication Filter: Tidal Range
Background information• <strong>Elkhorn</strong> <strong>Slough</strong> has high nutrient concentrationsand loading (54.4kg NO 3 /acre/y) (Johnson2008).• <strong>Elkhorn</strong> <strong>Slough</strong> has high primary productivityindicating hypereutrophication (860 g/C/m 2 /y)• Tidally restricted areas have decreased benthicdiversity and abundance (Oliver et al. 2009).
Macroalgae: highly abundant at most sitesUlva often nutrient limited, enhanced by agricultural inputs;Algal mats can affect dissolved oxygen and benthic communities
Macroalgal Abundance: related to tidal exchange
Water Column Chlorophyll a: high at all sitesAffects dissolved oxygen and light availability in <strong>the</strong> water column
Chl a indicates eutrophic conditionsConcentrations not significantly different in full vs. muted sitesEutrophic lines based on Bricker et al. (2003)High EutrophicationModerate Eutrophication
Sediment Anoxia: Affects benthicinvertebrate communities and feeding byo<strong>the</strong>r animals.
Sediment Anoxia: related to tidal exchangeA much narrower layer at <strong>the</strong> top of <strong>the</strong> mud is well oxygenated atmuted vs. full tidal sites
Hypoxia Events: More frequent in tidallyrestricted areas.
Nutrients do not explain eutrophic patterns(Nitrate/Phosphate)
Nutrients do not explain eutrophic patterns(Nitrate/Phosphate)
Eutrophication End Points
Eutrophication End Points: Explained by Tidal Exchange
Hypoxia Filter: Maximum Tidal Range
Summary•<strong>Elkhorn</strong> <strong>Slough</strong> is a highly eutrophic estuary, yet varieswithin <strong>the</strong> estuary as moderate to hyper eutrophic.•Sites with a decreased tidal range have lower intertidalalgal cover, but more floating algal mats, and higherphytoplankton concentrations.•Sites with a decreased tidal range have a higherfrequency of hypoxia events, and more anoxicsediments.
Conclusions•Tidal range is a strong predictor of degree of eutrophicationbetween sites within <strong>the</strong> estuary, and thus serves as an important"filter" for expression of eutrophication•Artificial tidal restriction can result in expression of severeeutrophication in highly nutrient loaded estuaries•Even a moderate increase in tidal range behind water controlstructures can lead to substantial improvements in water quality
AcknowledgementsFunding Sources:•NERR Water Quality Program•Community <strong>Foundation</strong> for Monterey County/PG&E Non-PointSource Pollution Grant (Grant # 20060387)•<strong>Elkhorn</strong> <strong>Slough</strong> <strong>Foundation</strong>•Monterey County Water Resources AgencyField Assistants: Sue Shaw, Ron Eby, Joseph Hatfield, RikkeKvist Preisler, Patty BrownLab Analysis: Sara Tanner (MLML), Moss Landing Marine LabChemical Oceanography Lab, Nick Welschmeyer (MLML),Theresa Hodges (Monterey County Consolidated Chemistry Lab)O<strong>the</strong>r Data Sources: Monterey Bay Aquarium Research Institute/Land Ocean Biogeochemical Observatory (Ken Johnson), A. Gee


