Mapping
Mapping
Mapping

You also want an ePaper? Increase the reach of your titles
YUMPU automatically turns print PDFs into web optimized ePapers that Google loves.
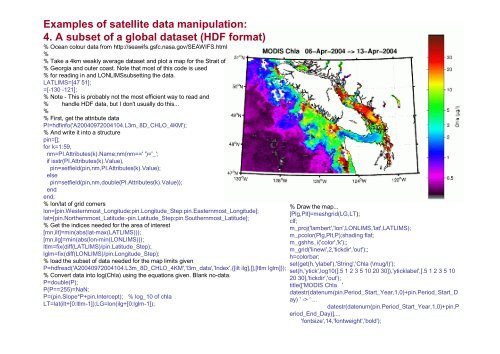
Examples of satellite data manipulation:<br />
4. A subset of a global dataset (HDF format)<br />
% Ocean colour data from http://seawifs.gsfc.nasa.gov/SEAWIFS.html<br />
%<br />
% Take a 4km weakly average dataset and plot a map for the Strait of<br />
% Georgia and outer coast. Note that most of this code is used<br />
% for reading in and LONLIMSsubsetting the data.<br />
LATLIMS=[47 51];<br />
=[-130 -121];<br />
% Note - This is probably not the most efficient way to read and<br />
% handle HDF data, but I don't usually do this...<br />
%<br />
% First, get the attribute data<br />
PI=hdfinfo('A20040972004104.L3m_8D_CHLO_4KM');<br />
% And write it into a structure<br />
pin=[];<br />
for k=1:59,<br />
nm=PI.Attributes(k).Name;nm(nm==' ')='_';<br />
if isstr(PI.Attributes(k).Value),<br />
pin=setfield(pin,nm,PI.Attributes(k).Value);<br />
else<br />
pin=setfield(pin,nm,double(PI.Attributes(k).Value));<br />
end<br />
end;<br />
% lon/lat of grid corners<br />
lon=[pin.Westernmost_Longitude:pin.Longitude_Step:pin.Easternmost_Longitude];<br />
lat=[pin.Northernmost_Latitude:-pin.Latitude_Step:pin.Southernmost_Latitude];<br />
% Get the indices needed for the area of interest<br />
[mn,ilt]=min(abs(lat-max(LATLIMS)));<br />
[mn,ilg]=min(abs(lon-min(LONLIMS)));<br />
ltlm=fix(diff(LATLIMS)/pin.Latitude_Step);<br />
lglm=fix(diff(LONLIMS)/pin.Longitude_Step);<br />
% load the subset of data needed for the map limits given<br />
P=hdfread('A20040972004104.L3m_8D_CHLO_4KM','l3m_data','Index',{[ilt ilg],[],[ltlm lglm]});<br />
% Convert data into log(Chla) using the equations given. Blank no-data.<br />
P=double(P);<br />
P(P==255)=NaN;<br />
P=(pin.Slope*P+pin.Intercept); % log_10 of chla<br />
LT=lat(ilt+[0:ltlm-1]);LG=lon(ilg+[0:lglm-1]);<br />
% Draw the map...<br />
[Plg,Plt]=meshgrid(LG,LT);<br />
clf;<br />
m_proj('lambert','lon',LONLIMS,'lat',LATLIMS);<br />
m_pcolor(Plg,Plt,P);shading flat;<br />
m_gshhs_i('color','k');;<br />
m_grid('linewi',2,'tickdir','out');;<br />
h=colorbar;<br />
set(get(h,'ylabel'),'String','Chla (\mug/l)');<br />
set(h,'ytick',log10([.5 1 2 3 5 10 20 30]),'yticklabel',[.5 1 2 3 5 10<br />
20 30],'tickdir','out');<br />
title(['MODIS Chla '<br />
datestr(datenum(pin.Period_Start_Year,1,0)+pin.Period_Start_D<br />
ay) ' -> ' ...<br />
datestr(datenum(pin.Period_Start_Year,1,0)+pin.P<br />
eriod_End_Day)],...<br />
'fontsize',14,'fontweight','bold');