- Page 1 and 2:
Mapping Introduction to MATLAB mapp
- Page 3 and 4:
0 � 45 � N Map examples 180 �
- Page 5 and 6:
42.5 � N 40.0 � N 37.5 � N 15
- Page 7 and 8:
Example 3 --------- % Map of Antarc
- Page 9 and 10:
Example 5 --------- % Map of the ge
- Page 11 and 12:
Example 6 --------- % Map of terrai
- Page 13 and 14:
GEOSHOW Display map latitude and lo
- Page 15 and 16:
Example 2 --------- % Create a worl
- Page 17 and 18:
Example 4 --------- % Display the E
- Page 19:
Example 7 % Read and display the Sa
- Page 22 and 23:
30 � N 45 � N 15 � W 60 � N
- Page 24:
Mapping Introduction to MATLAB mapp
- Page 38 and 39:
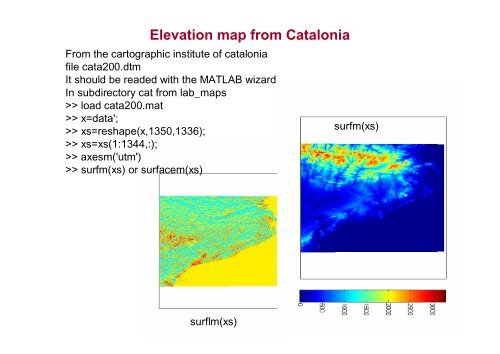
Plotting raster (grid) data in MATL
- Page 40 and 41:
From vectors to raster (grids) >> i
- Page 42 and 43:
From vectors to rastrer (grids) >>
- Page 44:
Map Projections All geospatial data
- Page 54 and 55:
But what projection should I use? M
- Page 56 and 57:
MAPPING GUIs AXESM GUI AXESM activa
- Page 58 and 59:
MapTools Projections CLASS NAME ID
- Page 60 and 61:
MAPPING DEMOS mapexkmlexport — Ex
- Page 62 and 63:
Mapping Introduction to MATLAB mapp
- Page 64 and 65:
efvec= [cells-per-degree, north lat
- Page 66 and 67:
-90,-180 SW 90,-180 NW Building and
- Page 68 and 69:
5) Map de data using mesm and displ
- Page 70 and 71:
Computing Map limits from reference
- Page 72 and 73:
BUILDING A GEOREFERENCE MATRIX, R R
- Page 74 and 75:
Producing map images (ex. from goog
- Page 76 and 77:
geoshow(AI,R)
- Page 78 and 79:
Map Viewer
- Page 80 and 81:
Mapping (MATLAB) georeferencing: ma
- Page 82 and 83:
% It's well known that at its most
- Page 84 and 85:
% Average these to determine the ce
- Page 86 and 87:
imformats EXT ISA INFO READ WRITE A
- Page 88 and 89:
Getting started with the M_map MATL
- Page 90 and 91:
Getting started with the M_map MATL
- Page 92 and 93:
Getting started with the M_map MATL
- Page 94 and 95:
Getting started with the M_map MATL
- Page 96 and 97:
Finally (!), we may want to alter t
- Page 98 and 99:
Specifying map projections in the M
- Page 100 and 101:
case 2, m_proj('lambert','long',[-1
- Page 102 and 103:
case 4, subplot(211); Slongs=[-100
- Page 104 and 105:
case 6, lambert projection % Plot a
- Page 106 and 107:
case 8, m_vec; M_VEC Draws fancy ar
- Page 108 and 109:
51 o N 48 o N 45 o N 42 o N 54 o N
- Page 110 and 111:
case 11, % example showing range ri
- Page 112 and 113:
% Colouring the ocean blue clf m_pr
- Page 114 and 115:
Map Projections m_proj Initializes
- Page 116 and 117:
1. Azimuthal projections The defaul
- Page 118 and 119:
Map Projections Stereographic Proje
- Page 120 and 121:
2. Cylindrical and Pseudo-cylindric
- Page 122 and 123:
2. Cylindrical and Pseudo-cylindric
- Page 124 and 125:
2. Cylindrical and Pseudo-cylindric
- Page 126 and 127:
60 o N 30 o N 0 o 30 o S 60 o S Map
- Page 128 and 129:
Map Projections Sinusoidal, Mollwei
- Page 130 and 131:
3. Conic Projections The map limits
- Page 132 and 133:
30 o N 40 o N 150 o W 50 o N 60 o N
- Page 134 and 135:
4. Miscellaneous global projections
- Page 136 and 137:
Coastlines and Bathymetry M_Map inc
- Page 138 and 139:
Example >> m_proj('oblique mercator
- Page 140 and 141:
Adding your own coastlines Filled c
- Page 142 and 143: Adding your own coastlines If you a
- Page 144 and 145: Topography/Bathymetry options M_Map
- Page 146 and 147: Examples >> m_proj('oblique mercato
- Page 148 and 149: Sandwell and Smith Bathymetry A rec
- Page 150 and 151: Using TerrainBase 5-minute or ETOPO
- Page 152 and 153: Adding your own topography/bathymet
- Page 154 and 155: 40 o N 10 o W 36 o N 5 o W 32 o N 0
- Page 156 and 157: Mission Multichannel sea surface te
- Page 159 and 160: Examples of satellite data manipula
- Page 161 and 162: Examples of satellite data manipula
- Page 163 and 164: How to install GSHHS: Go to http://
- Page 165 and 166: Customizing axes Grid lines and lab
- Page 167 and 168: Customizing axes. Grid lines and la
- Page 169 and 170: help m_grid m_grid make a grid on a
- Page 171 and 172: Adding your own data The data units
- Page 173 and 174: Drawing lines, text, arrows, patche
- Page 175 and 176: Fancy arrows (i.e. with width, head
- Page 177 and 178: Drawing tracklines It is sometimes
- Page 179 and 180: m_lldist can find both distances an
- Page 181 and 182: Converting longitude/latitude to pr
- Page 183 and 184: Removing data from a plot Once a gi
- Page 186 and 187: 144 o W 136 o W 128 o W 30 o N Simu
- Page 188 and 189: A=imread('moon.tif') image(A) image
- Page 190 and 191: Table: summary of supported image t
- Page 194 and 195: MATLAB world map and plot map utili
- Page 196 and 197: Simple Google Map Loader in MATLAB.
- Page 204 and 205: Mapping Introduction to MATLAB mapp
- Page 206 and 207: To calculate the geographic locatio
- Page 208 and 209: temp2=temp(1:4:4096,1:4:8192); dx=3
- Page 211 and 212: Mapping Introduction to MATLAB mapp
- Page 213 and 214: Approximate ice limit PROYECTO ATOS
- Page 215 and 216: depths (100,.. 1000 m) El CTD propo
- Page 217 and 218: oxyg 420 400 1b 2b 3b 380 1 2a 4a 3
- Page 219 and 220: RMSECV, RMSEC Loadings on PC 2 (31.
- Page 221 and 222: Study of the fluorescence at differ
- Page 223 and 224: MCR-ALS C1 Row 3 Decluttered200 Col
- Page 225 and 226: MCR-ALS C3 Row 2 Decluttered Column
- Page 227 and 228: Fluorescence PLS prediction from ot
- Page 229 and 230: function mapatos(latlim,lonlim,latd
- Page 231 and 232: 78 � N 79 � N 2 � 77 E � N
- Page 233 and 234: 78 � N 79 � N 2 � 77 E � N
- Page 235 and 236: 78 � N 79 � N 2 � 77 E � N
- Page 237 and 238: From vectors to rastrer (grids) fun
- Page 239 and 240: From vectors to rastrer (grids) >>
- Page 241: From vectors to rastrer (grids) [Z,