Geometry A: Final Exam Review Packet
Geometry A: Final Exam Review Packet
Geometry A: Final Exam Review Packet
- No tags were found...

You also want an ePaper? Increase the reach of your titles
YUMPU automatically turns print PDFs into web optimized ePapers that Google loves.
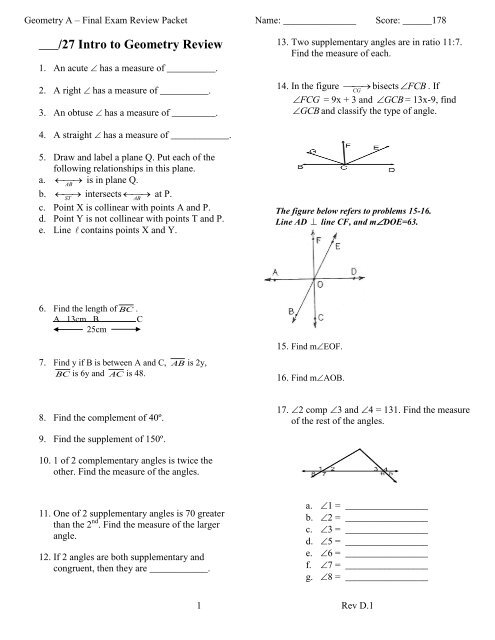
<strong>Geometry</strong> A – <strong>Final</strong> <strong>Exam</strong> <strong>Review</strong> <strong>Packet</strong> Name: _______________ Score: ______178___/32 Reasoning & Proofs <strong>Review</strong>18. What are some things that can be assumed?a. ________________________b. ________________________c. ________________________d. ________________________19. What are some things that cannot beassumed?a. ________________________b. ________________________c. ________________________d. ________________________20. What are two things that can be concludedfrom “Straight Angle”?a. ________________________b. ________________________21. What are two things that can be concludedfrom “Right Angle”?a. ________________________b. ________________________22. What is one thing that can be concluded from“Midpoint”?a. ________________________23. What is one thing that can be concluded from“Bisect”?a. ________________________For questions 24-26, provide possible conclusionsbased on the diagram and given information.24. Given: A is a right Conclusion: A D25. Given: 3 sup to 4, 5 sup to 4Conclusion:26. Given: F sup G, H sup J, G JConclusion:BC27. Identify the hypothesis and conclusion of thefollowing statement: If 2 lines areperpendicular then they form 4 right angles.28. Write converse, inverse and contrapositive of“If today is President’s Day, then there is noschool.”a. Converse:b. Inverse:c. Contrapositive29. Write the converse, inverse andcontrapositive of “a → b”a. Converse:b. Inverse:c. Contrapositive30. Complete a truth table for r s (3pts)For problems 31-35, state the property that justifieseach statement.31. AB AB32. If A Pthen P A.XY PQ33. If XY PQ then .2 234. If 3(x 6) 0 then3x 18 0 .35. If a = b and b = c then a = c.2 Rev D.1
<strong>Geometry</strong> A – <strong>Final</strong> <strong>Exam</strong> <strong>Review</strong> <strong>Packet</strong> Name: _______________ Score: ______178___/22 Lines in the Plane <strong>Review</strong>(Coordinates & Parallel Lines)44. Identify the following pairings:36. What is the slope formula?37. What is the midpoint formula?38. What is the distance formula?39. Find the slope of the line that passes through(1, 3) and (5, -2)40. Find the coordinates of the point where themedian from A intersects BC.(-4,3) B (6,5)Aa. alternate interior:b. alternate exterior:c. corresponding:d. same side interior:e. same side exterior:45. Given that m 14 51, find the value of therest of the angles.C (6,-1)41. Given the following coordinate (2,-3) performthe following transformations.a. reflect over x-axisb. reflect over y-axisc. translate to up 3 units42. List 5 ways to prove || lines.a. __________________b. __________________c. __________________d. __________________e. __________________43. Find x so that e ||fa. b.46. Find m 113 Rev D.1
510ANTHONY W. D’AMATO AND DAVID A. ORWIGEcological MonographsVol. 78, No. 4Lorimer and Frelich 1989). Dates of gap recruitmentand canopy accession were assigned using the samemethodology described in the previous two paragraphs.One of the prime areas of interest was reconstructingthe amount of canopy area disturbed by past disturbanceevents (see Methods: Disturbance chronologies).As such, the growth release of canopy trees adjacent togaps was not tallied to prevent overestimating theproportion of canopy area disturbed during a givendisturbance event (Frelich 2002). The likelihood of a treebeing in the canopy during a disturbance event wasdetermined based on its dbh (Lorimer and Frelich 1989).Size thresholds were created for each tree species basedon the size structure of the canopy and understory ofour study areas using the methodology outlined byLorimer and Frelich (1989): Tsuga canadensis ¼ 28.0 cm,Fagus grandifolia ¼ 20.0 cm, Picea rubens ¼ 20.5 cm,Acer saccharum ¼ 25.0 cm, and Betula spp. ¼ 18.0 cm.Release events were not tallied for individuals withdiameters greater than or equal to these thresholds at thetime of disturbance, allowing us to focus solely on therelease of understory trees due to loss of overtoppingcanopy trees. Diameters were estimated for every year atree was in the record using cumulative radial incrementand species-specific equations for bark thickness fromNE-TWIGS (Bush 1995). Moderate releases were talliedonly if they were the first or only significant growthrelease displayed for a given understory tree (Lorimerand Frelich 1989). In contrast, all major releases weretallied, and multiple major releases were allowed for agiven individual because several disturbance events areoften needed for shade-tolerant tree species to attaincanopy status (Oliver and Stephens 1977, Canham 1985,1990, Lorimer and Frelich 1989).Disturbance chronologiesDisturbance chronologies were constructed for eachstudy area by tallying the number of release events andgap-recruitment events by decade (Lorimer and Frelich1989). The number of releases per decade was weightedby the current exposed crown area (ECA; see AppendixA for equations used to predict ECA) of each releasedtree to derive an estimate of canopy area disturbed(Lorimer and Frelich 1989). This method assumes thatthe percent area of the current canopy occupied by treesreleased in a given decade represents an estimate of theproportion of canopy area disturbed during that decade(Lorimer and Frelich 1989; Frelich 2002). Because everytree on each plot was cored, ECA estimates werecorrected to prevent overestimating canopy area disturbeddue to more intensive sampling of smaller trees(Frelich 2002). These estimates were corrected using thefollowing formula from Lorimer and Frelich (1989):W i ¼ ðECA i=ECAÞn i =Nwhere W i is the weighting factor for diameter class i,ECA i is the cumulative exposed crown area of trees indiameter class i, ECA is the exposed crown area of alltrees on the plot, n i is the number of cores in diameterclass i, and N is the total number of cored trees in theplot.The length of each study area’s disturbance chronologywas determined by the number of living treespresent in each decade and was truncated when thenumber of living trees dropped below 15 (Fraver andWhite 2005). The last decade of each chronology was1980–1989 because trees recruited by disturbance eventsin the 1990s were not large enough to core during oursampling period (Frelich 2002). In addition, the use of10- and 15-yr windows for analyzing release eventsprecluded us from including disturbance events after1989 in the chronologies, and therefore our estimates ofcanopy area disturbed during 1980–1989 may be low.Release of overstory trees and growth declinesIn addition to using the growth responses ofunderstory trees to determine the amount of canopyarea disturbed, the responses of canopy trees todisturbance events were also analyzed. Because thegrowth response of overstory trees to surroundingcanopy openings is typically much smaller than thoseelicited by released understory trees (Lorimer andFrelich 1989, Nowacki and Abrams 1997), we usedgrowth release criteria developed specifically for detectingthe response of overstory trees to canopy disturbance(Nowacki and Abrams 1997). Following thesecriteria, average 10-yr growth increases 50% relative tothe previous 10 yr were tallied for each tree deemed to bea canopy tree at the time of disturbance, based on thedbh thresholds listed in Methods: Reconstruction ofdisturbance dynamics. In addition, abrupt growthdecreases 50% and lasting 10 yr relative to the previous10 yr were tallied for each canopy tree as an indicationof canopy damage (cf. Foster 1988, Orwig et al. 2001,Lafon and Speer 2002). The same growth decreasecriteria were applied to understory trees to detect eventsin which understory trees (i.e., trees that were less thandbh threshold) were also damaged. Growth releases anddeclines of canopy trees and growth declines ofunderstory trees were examined in concert with ourreconstructions of canopy area disturbed to determinethe nature and intensity of disturbance (e.g., wind andice storms, insect outbreaks) at each study area (seeMethods: Historical evidence of disturbance).Ordination analysis of disturbance chronologiesTraditional approaches for examining patterns ofdisturbance across multiple study sites have involvedqualitative comparisons of histograms or tables containingthe distribution of canopy area disturbed eachdecade (e.g., Nowacki and Abrams 1997, Orwig et al.2001, Ziegler 2002). These approaches have provenuseful when only a few study areas are being compared(e.g., Fraver and White 2005); however, this approachbecomes increasingly subjective and cumbersome when
<strong>Geometry</strong> A – <strong>Final</strong> <strong>Exam</strong> <strong>Review</strong> <strong>Packet</strong> Name: _______________ Score: ______178___/28 Triangles <strong>Review</strong>65. What are some ways to prove 2 triangles arecongruent?a. ______________________b. ______________________c. ______________________d. ______________________66. What must you have in order to use the HLpostulate?a. ______________________b. ______________________c. ______________________71. Given the following indirect proof, what mustbe assumed?Given: AB AD,BAC DACProve: BC DCComplete the following proofs.72. Given: FGI IGH,GI FHProve: ∆GIH is a right ∆67. Can CPCTC be used as a reason in a proofbefore proving any triangles are congruent?68. When given a circle as a diagram, what canone assume?69. Determine whether the pair of triangles iscongruent. If so, write a congruence statementand explain why the triangles are congruent.a. b.StatementsReasons1. 1.2. 2.3. 3.4. 4.73. Given: C H,T is midpoint of AOProve: ∆CAT ∆HOTStatementsReasons1. 1.2. 2.3. 3.4. 4.5. 5.70. Indicate the needed information to make the 2triangles congruent via AAS.74. Given: HGJ KJG,KGJ HJGProve: HG KJStatementsReasons1. 1.2. 2.3. 3.4. 4.5. 5.5 Rev D.1
<strong>Geometry</strong> A – <strong>Final</strong> <strong>Exam</strong> <strong>Review</strong> <strong>Packet</strong> Name: _______________ Score: ______178___/43 Polygons & Quadrilaterals75. List 3 properties of a polygon.a. _________________b. _________________c. _________________76. Name the polygon based by its # of sides,convex/concave and regular/irregular.77. List the properties of a parallelogram.1.____________2.____________3.____________4.____________5.____________6.____________78. Beyond the properties of a parallelogram, list theproperties of a rhombus.1.____________2.____________3.____________4.____________5.____________79. Name all the properties of a kite. Whichshapes also have these properties?1.____________2.____________3.____________4.____________5.____________80. Name all the properties of a square.1.____________2.____________3.____________81. List the properties of an isosceles trapezoid.1.____________2.____________3.____________4.____________5.____________6.____________82. Name all quadrilaterals that have congruentopposite angles.a. ____________________b. ____________________c. ____________________d. ____________________83. Name all quadrilaterals that have congruentdiagonals.a. ____________________b. ____________________c. ____________________Use rhombus QRST for Questions 84 – 86.84. If m∠QTS = 56, find m∠1.85. If m∠P = 6x, find x.86. If TP = 15, find TR.Use rectangle ABCD for Questions 87 – 88.87. If m∠DCE = 4x+5 and m∠DEC = 5x + 14. Findx.88. If DC = 4x – 30 and AB = 30-x, find DC.89. The bases of a trapezoid are 12 and 26. Findthe length of the median.90. Draw the quadrilateral tree representing therelationship of the various quadrilaterals.6 Rev D.1