applications of dna microarrays in biology - Roth Laboratory
applications of dna microarrays in biology - Roth Laboratory
applications of dna microarrays in biology - Roth Laboratory

Create successful ePaper yourself
Turn your PDF publications into a flip-book with our unique Google optimized e-Paper software.
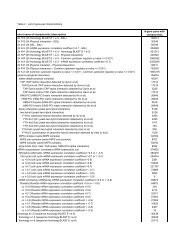
DNA MICROARRAYS IN BIOLOGY 57Annu. Rev. Biochem. 2005.74:53-82. Downloaded from arjournals.annualreviews.orgby HARVARD UNIVERSITY on 01/31/06. For personal use only.Figure 2 Process flow for microarray experiments. Note that we have used the word“probe” to refer to the reporter sequence placed at a particular position on the microarraybecause it <strong>in</strong>terrogates the sample for the presence <strong>of</strong> its reverse complement andalso because the microarray market leader, Affymetrix, has adopted this def<strong>in</strong>ition.Historically probe has referred <strong>in</strong>stead to the biological sample.Figure 3 Feature density <strong>of</strong> representative <strong>microarrays</strong>. Each image shows a 2.7 mmsquare subregion. (a) Bacterial colony spots on nylon from the 1980s. (b) Ink-jet <strong>in</strong> situsynthesized 60-mer oligo spots on glass. (c) Affymetrix human gene array with 18-µ featuresconta<strong>in</strong><strong>in</strong>g 25-mer oligos. Affymetrix chips now are available with 11-µ features.
DNA MICROARRAYS IN BIOLOGY 59Annu. Rev. Biochem. 2005.74:53-82. Downloaded from arjournals.annualreviews.orgby HARVARD UNIVERSITY on 01/31/06. For personal use only.TABLE 2b Microarray alternatives us<strong>in</strong>g presynthesized oligos or cDNAs aProcess Vendors Substrate Density Maturity Advantages LimitationsPen tip deposition — — — — Low technology<strong>in</strong>vestmentClontechPharm<strong>in</strong>genSigma-GenosysCl<strong>in</strong>icalMicroSensorsClontechPharm<strong>in</strong>genHarvard BiosciencesMergenMWG BiotechInk-jet deposition GE Healthcare(CodeL<strong>in</strong>k arrays)Electrophoreticallydriven depositionNylon or othersyntheticpolymerPr<strong>in</strong>ted circuitboard
60 STOUGHTONAnnu. Rev. Biochem. 2005.74:53-82. Downloaded from arjournals.annualreviews.orgby HARVARD UNIVERSITY on 01/31/06. For personal use only.methods, both photolithographic (10) and digital micromirror-based (11), have thepotential to achieve feature sizes not much larger than a wavelength <strong>of</strong> light. Thisshould enable substantial further reductions <strong>in</strong> cost and <strong>in</strong> hybridization volumewith consequent reduction <strong>in</strong> amount <strong>of</strong> biological sample required. In situ <strong>in</strong>kjetsynthesis (12) should have a valuable niche for rapid turnaround <strong>of</strong> customarrays <strong>in</strong> small lots, unless it is overtaken by the micromirror technologies. Dur<strong>in</strong>goptimization <strong>of</strong> the <strong>in</strong>k-jet synthesis technology (12), it was shown that 60-mersallowed a much better sensitivity-specificity trade than shorter oligos. In lightdirectedsynthesis, failure <strong>of</strong> photodeprotection at any stage term<strong>in</strong>ates the oligo.The yields per stage <strong>in</strong> the Affymetrix synthesis process are such that attempts tomake 60-mers would result <strong>in</strong> very few <strong>of</strong> them runn<strong>in</strong>g to even half that length(13); Affymetrix settled on 25-mers partly for this reason. Their use <strong>of</strong> multipleprobe pairs to estimate the abundance <strong>of</strong> each target transcript is driven partly bythe need to make up for the performance limitations <strong>of</strong> 25-mers. Ink-jet synthesisyields are ∼98% per stage with chemical deprotection, as opposed to ∼95% forphotodeprotection (13), allow<strong>in</strong>g the <strong>in</strong>k-jet technology to be optimized with longeroligos and higher str<strong>in</strong>gency hybridization conditions.Presynthesis <strong>of</strong> oligos or cDNAs has the important advantage that the sequenceseventually placed on the array can be exactly those desired. Pen tip spott<strong>in</strong>g methods(14, 15) will cont<strong>in</strong>ue to be a relatively low-tech but robust and affordablemethod for small laboratories to generate their own arrays with a moderate number<strong>of</strong> features and have the capability <strong>of</strong> spott<strong>in</strong>g DNA <strong>of</strong> an unknown sequence.Ink-jet methods also can be used to pr<strong>in</strong>t presynthesized oligos.In a true synthesis <strong>of</strong> microelectronics and molecular biotechnology, Nanogenand CombiMatrix have <strong>in</strong>corporated electrodes <strong>in</strong> their arrays to direct synthesis.In Nanogen’s case, the primary application <strong>of</strong> electrodes is to drive hybridization.Other methods <strong>of</strong> spatial demultiplex<strong>in</strong>g not listed <strong>in</strong> Table 1 are worth mention.Universal arrays adopt a fixed set <strong>of</strong> orthogonal probe sequences and conjugatetheir complements to problem-specific ligands (5, 16) or adopt a complete set <strong>of</strong>short N-mers and <strong>in</strong>terpret all samples <strong>in</strong> terms <strong>of</strong> the hybridization pattern to these(17). Such approaches avoid the need to redesign the array for each application.The former potentially achieves better control over the hybridization step at theexpense <strong>of</strong> added process complexity. Fiber optic bundles term<strong>in</strong>ated with beadsconjugated to specific probes can be used as arrays (18, 19) and are be<strong>in</strong>g producedby Illum<strong>in</strong>a primarily for parallel genotyp<strong>in</strong>g application. F<strong>in</strong>ally, <strong>in</strong>dividualbeads conjugated to specific probes can be localized <strong>in</strong> a flow cytometry configurationand identified via unique color tags (20), as <strong>in</strong> the system be<strong>in</strong>g <strong>of</strong>fered byLum<strong>in</strong>ex.Probe DesignMost array vendors <strong>of</strong>fer standard array probe sets for some or all <strong>of</strong> the mostcommon model organisms, such as mouse, rat, yeast, and human, and <strong>in</strong> this case,the problems <strong>of</strong> choos<strong>in</strong>g target sequences and design<strong>in</strong>g probes are taken out <strong>of</strong>
DNA MICROARRAYS IN BIOLOGY 61Annu. Rev. Biochem. 2005.74:53-82. Downloaded from arjournals.annualreviews.orgby HARVARD UNIVERSITY on 01/31/06. For personal use only.the user’s hands. In the case <strong>of</strong> custom arrays, the customer can contribute differentlevels <strong>of</strong> detail to the design: a target gene list, a list <strong>of</strong> target transcript sequences,the actual probe sequences to be synthesized, or even complete specification <strong>of</strong>all probe and control sequences and their spatial layout on the array. This choice<strong>in</strong>volves consider<strong>in</strong>g the customer’s bio<strong>in</strong>formatic capabilities compared to those<strong>of</strong> the array vendor and, <strong>of</strong> course, the price <strong>of</strong> the vendor services.Commercial s<strong>of</strong>tware, such as ArrayDesigner (Premier Bios<strong>of</strong>t International),TILIA (L<strong>in</strong>den Biosciences), and free s<strong>of</strong>tware (21), exist to aid <strong>in</strong> probe design.Stekel (22) summarizes sequence database resources and probe design pr<strong>in</strong>ciples.The chosen array technology and basel<strong>in</strong>e amplification and hybridizationprotocols constra<strong>in</strong> the design as to probe length, a preferred range <strong>of</strong> melt<strong>in</strong>g temperature,and probe distance from the 3 ′ end <strong>in</strong> the case <strong>of</strong> mRNA pr<strong>of</strong>il<strong>in</strong>g. Otherconsiderations <strong>in</strong>clude avoid<strong>in</strong>g repetitive sequence motifs, avoid<strong>in</strong>g regions thatare likely to <strong>in</strong>cur mRNA secondary structure, and avoid<strong>in</strong>g cross hybridizationto sequences other than the target sequence. The latter calculation <strong>in</strong> particularis very computationally demand<strong>in</strong>g when done for extensive probe sets for largegenomes. These calculations are hampered by the absence <strong>of</strong> accurate models forb<strong>in</strong>d<strong>in</strong>g energy; published “nearest neighbor” <strong>in</strong>teraction energies result mostlyfrom the dissociation <strong>of</strong> oligos <strong>of</strong> length ∼10 nucleotides (nt) <strong>in</strong> volume solution(23), which can be very different from the behavior <strong>of</strong> surface-bound and longeroligos ow<strong>in</strong>g to the electrostatic effects <strong>of</strong> the surface (24) and greater propensityfor secondary structure. These models also could benefit by factor<strong>in</strong>g <strong>in</strong> therough expected abundance <strong>of</strong> all the molecular species <strong>in</strong> the tissue <strong>of</strong> <strong>in</strong>terest. Forexample, the cross-hybridization pattern <strong>in</strong> a liver sample will likely be differentcompared to a bra<strong>in</strong> sample, which has a different set <strong>of</strong> abundantly expressedgenes. Affymetrix probes are designed <strong>in</strong> pairs: One sequence is the exact complement<strong>of</strong> the target sequence, and the other differs from the exact complementby typically two mutations near the middle <strong>of</strong> the probe. Us<strong>in</strong>g the differencesignal between these two probes approximately cancels nonspecific b<strong>in</strong>d<strong>in</strong>g andbackground contributions. However, it does not cancel cross hybridization fromsequences nearly identical to the target because the mismatch probe will almostcerta<strong>in</strong>ly differ more from the closely related sequence than does the match probe.Probe design for expression pr<strong>of</strong>il<strong>in</strong>g <strong>in</strong>creas<strong>in</strong>gly will be splice-form specific asa more complete understand<strong>in</strong>g <strong>of</strong> splice forms becomes available (25).Amplification and Label<strong>in</strong>gThe protocols for isolat<strong>in</strong>g and amplify<strong>in</strong>g the desired form <strong>of</strong> nucleic acid havemany variations. In the case <strong>of</strong> mRNA pr<strong>of</strong>il<strong>in</strong>g, amplification can proceed frompurified mRNA or from total RNA, although <strong>in</strong> prokaryotes mRNA purification isproblematic because the nucleic acid mostly lacks 3 ′ polyadenylation (26). Label<strong>in</strong>gmolecules can be <strong>in</strong>corporated dur<strong>in</strong>g synthesis <strong>of</strong> amplification products, ormodified nucleotides capable <strong>of</strong> accept<strong>in</strong>g label can be <strong>in</strong>corporated dur<strong>in</strong>g synthesisand the labels coupled to these immediately afterward. Or, the label<strong>in</strong>g can
62 STOUGHTONAnnu. Rev. Biochem. 2005.74:53-82. Downloaded from arjournals.annualreviews.orgby HARVARD UNIVERSITY on 01/31/06. For personal use only.take place after hybridization as <strong>in</strong> the Affymetrix protocol. Signal amplificationmethods also have been employed to augment sample amplification (27–29).Nucleic acid amplification can be accomplished through reverse transcription<strong>of</strong> RNA followed by l<strong>in</strong>ear amplification with one or more rounds <strong>of</strong> <strong>in</strong> vitro transcription(IVT) (12, 30–32), or via polymerase cha<strong>in</strong> reaction (PCR) (33–36), ora comb<strong>in</strong>ation <strong>of</strong> these (12, 37). Amplification can be 3 ′ -biased or full-length,and the decision <strong>in</strong>teracts strongly with the process <strong>of</strong> probe design. 3 ′ -biasedamplification methods take advantage <strong>of</strong> prim<strong>in</strong>g from polyadenylation sequencesfound <strong>in</strong> eukaryotic transcripts. Full-length amplification tends to employ randomprim<strong>in</strong>g <strong>of</strong> the target molecules, either because poly(A) sequences do not existas <strong>in</strong> the case <strong>of</strong> prokaryotic organisms, or out <strong>of</strong> a desire to amplify sequencesmore representative <strong>of</strong> the entire target length. The f<strong>in</strong>al product to be hybridizedto the array can be either cDNA or cRNA. Out <strong>of</strong> these many variations a fewpr<strong>in</strong>ciples have emerged. L<strong>in</strong>ear and modest amplification, as well as postsynthetic<strong>in</strong>corporation <strong>of</strong> labels, generally are associated with more reproducibledata. cDNA:DNA hybridizations tend to suffer less from cross hybridization, eventhough the actual b<strong>in</strong>d<strong>in</strong>g energies tend to be lower than those <strong>of</strong> cRNA:DNAduplexes. 3 ′ -biased protocols have the advantage that the untranslated sequenceregions tend to be more diverse and so allow more sequence-unique and thereforenoncross-hybridiz<strong>in</strong>g probes to be designed.Despite one’s best efforts, biases enter at all reaction steps <strong>in</strong> these workflowsand can be very sequence specific, so that the f<strong>in</strong>al brightness <strong>of</strong> a given probe isonly approximately relatable to the abundance <strong>of</strong> its correspond<strong>in</strong>g target molecule.Fortunately the most mean<strong>in</strong>gful results usually are conta<strong>in</strong>ed <strong>in</strong> the ratio <strong>of</strong> abundances,referred to a reference biological sample, such as <strong>in</strong> disease versus normalstudies, rather than <strong>in</strong> the absolute levels. As long as the biases are reproducible,ratios are fairly well preserved; they are not perfectly preserved due to the nonl<strong>in</strong>earity<strong>of</strong> the ga<strong>in</strong>s created at each stage <strong>in</strong> the process. Ratio measurements areobta<strong>in</strong>ed by compar<strong>in</strong>g two <strong>in</strong>dependently hybridized samples, or two samples are<strong>in</strong>dependently labeled with different labels and competitively hybridized <strong>in</strong> thesame hybridization reaction. Competitive hybridization is the ultimate matchedcontrol method because the variations <strong>in</strong> probe spot properties, aris<strong>in</strong>g from synthesisand local hybridization conditions, usually cancel each other. This permitsaccurate ratios to be obta<strong>in</strong>ed from spotted arrays even when the spots and hybridizationfluidics are somewhat irregular. This is an important reason why the relativelylow-budget spott<strong>in</strong>g technologies have been so successful. Biases that arisefrom differences <strong>in</strong> chemical properties between the two dyes are significant and sequencespecific, but the biases can be mostly mitigated by repeat<strong>in</strong>g the experimentwith the reverse assignment <strong>of</strong> dye to sample and averag<strong>in</strong>g the results (38, 39).HybridizationDur<strong>in</strong>g hybridization, complementary sequences gradually f<strong>in</strong>d each other preferentiallyover mismatched pair<strong>in</strong>gs. The fundamental parameters are time, str<strong>in</strong>gency,concentration, and complexity <strong>of</strong> the sample, as well as density <strong>of</strong> available
DNA MICROARRAYS IN BIOLOGY 63Annu. Rev. Biochem. 2005.74:53-82. Downloaded from arjournals.annualreviews.orgby HARVARD UNIVERSITY on 01/31/06. For personal use only.b<strong>in</strong>d<strong>in</strong>g sites. Secondary parameters <strong>in</strong>clude the distribution <strong>of</strong> fragment lengths,steric effects <strong>of</strong> dye molecules (40), and surface chemistry (41). The optimization<strong>of</strong> str<strong>in</strong>gency <strong>in</strong>volves choos<strong>in</strong>g conditions <strong>in</strong> which, for most probes, perfectmatch duplexes (or at least duplexes with the <strong>in</strong>tended target) have a high occupancycompared to mismatch duplexes. In general, any given target sequence willpair and dissociate many times dur<strong>in</strong>g the hybridization reaction, stay<strong>in</strong>g longerat high-b<strong>in</strong>d<strong>in</strong>g-energy well-matched duplexes than <strong>in</strong> poorly matched duplexes.This anneal<strong>in</strong>g is therefore like musical chairs <strong>in</strong> which specificity <strong>in</strong>creases overtime as the reaction approaches equilibrium (42). In fact, the progression with timecan be used to dist<strong>in</strong>guish specific from nonspecific b<strong>in</strong>d<strong>in</strong>g (43). In general, hybridizationtimes <strong>of</strong> several hours or more at relatively high str<strong>in</strong>gency are requiredto achieve the best specificity. A challenge for cl<strong>in</strong>ical and some biodefense <strong>applications</strong>will be to speed up this process substantially. The electric field–<strong>in</strong>ducedmigration <strong>of</strong> target fragments toward probes <strong>of</strong> the Nanogen system <strong>in</strong>creases localconcentration and accelerates the accumulation <strong>of</strong> signal; it is less clear if itaccelerates the progression to a certa<strong>in</strong> level <strong>of</strong> specificity. Likewise, agitation,micr<strong>of</strong>luidic circulation as <strong>in</strong> the Affymetrix system, surfactants, buffers (44), andacoustic sonication (45) have potential to speed and improve hybridization.Wash<strong>in</strong>g <strong>of</strong>f the unbound sample after hybridization is a crucial step. Str<strong>in</strong>gencymust be optimized here as well (46). Chemistry surprises still should be expected,such as the recent discovery <strong>of</strong> the high sensitivity <strong>of</strong> some dyes <strong>in</strong> certa<strong>in</strong> protocolsto the presence <strong>of</strong> atmospheric ozone (47), which seems to occur particularly dur<strong>in</strong>gthe exposure <strong>of</strong> the dry<strong>in</strong>g array surface to the air.Fluorescent Scann<strong>in</strong>g <strong>of</strong> Hybridized ArraysFluorescent label<strong>in</strong>g and detection on nonporous arrays have replaced radioactivelabel<strong>in</strong>g on membrane arrays <strong>in</strong> almost all labs because the sensitivity <strong>of</strong> the formernow rivals or exceeds that <strong>of</strong> 33 P (37), and nonradioactive label<strong>in</strong>g is much easierto handle. Scann<strong>in</strong>g <strong>of</strong> a fluorescent hybridization signal can be done with CCDimag<strong>in</strong>g us<strong>in</strong>g filtered white light illum<strong>in</strong>ation, as <strong>in</strong> the ArrayWoRx from AppliedPrecision, but now it is more commonly done with laser confocal scanners (48).The laser confocal approach has fundamental geometric advantages that tend toprovide better signal-to-background ratios and less photobleach<strong>in</strong>g <strong>of</strong> the labels.Available options for fluorescent confocal scanners are chang<strong>in</strong>g even more rapidlythan for arrays. In addition to the Affymetrix-specific scanners supplied by them,lead<strong>in</strong>g manufacturers <strong>in</strong>clude Agilent Technologies, Axon Instruments, Packard,and Genomic Solutions.Most devices have lasers and filter sets compatible with common fluorescentlabel pairs such as Cy3 and Cy5. The lead<strong>in</strong>g laser confocal devices all havesensitivities high enough that background fluorescence <strong>of</strong> the array substrate andunwashed reagents, not signal fa<strong>in</strong>tness, generally limits performance. In otherwords, these scanners are as good as they need to be given the current limitations<strong>of</strong> other steps <strong>in</strong> the process. New options for brighter <strong>in</strong>dividual label<strong>in</strong>g units, suchas quantum dots (49) and plasmon resonance particles (50, 51), may f<strong>in</strong>ally allow
64 STOUGHTONAnnu. Rev. Biochem. 2005.74:53-82. Downloaded from arjournals.annualreviews.orgby HARVARD UNIVERSITY on 01/31/06. For personal use only.s<strong>in</strong>gle-molecule detection efficiency, further eas<strong>in</strong>g requirements on amplificationand on the <strong>in</strong>put biological sample amount.Scanners come with, or the manufacturer will recommend, image process<strong>in</strong>gs<strong>of</strong>tware to reduce the raw images to spot <strong>in</strong>tensities. This step is itself a challeng<strong>in</strong>gand complex subject (52, 53). Because experiments <strong>of</strong>ten are designed to detect asmall number <strong>of</strong> changes among a large number <strong>of</strong> target genes, outlier errors <strong>in</strong> theimage must be carefully recognized and flagged. Any compromise <strong>in</strong> the accuracyat this stage cannot be recovered downstream. The output should <strong>in</strong>clude pixel<strong>in</strong>tensity statistics that can be used as <strong>in</strong>put to measurement uncerta<strong>in</strong>ty estimates.Plasmon surface resonance detection <strong>of</strong> molecular b<strong>in</strong>d<strong>in</strong>g is potentially a wayto scan <strong>microarrays</strong> without us<strong>in</strong>g any label (54), although this has not yet maturedto any commercial systems.Performance Metrics for the Entire SystemUltimately it is the measurement performance <strong>of</strong> the system as a whole that is important.Various metrics have been proposed to assess this performance. One keytest is to spike <strong>in</strong> known amounts <strong>of</strong> a positive control <strong>in</strong>to a typical complex sample.Because ratios <strong>of</strong> abundances between two samples are <strong>of</strong>ten most mean<strong>in</strong>gful,this should be done with different spike-<strong>in</strong> amounts <strong>in</strong> two samples, compar<strong>in</strong>gthe observed ratios with the known <strong>in</strong>put ratio. As a rule <strong>of</strong> thumb <strong>in</strong> expressionpr<strong>of</strong>il<strong>in</strong>g, spike-<strong>in</strong> levels, correspond<strong>in</strong>g to roughly one copy per cell, and changesaround this level, should be easily detected. It is an open question whether abundancesless than one copy per cell should be considered biologically mean<strong>in</strong>gful.However, most tissue samples are actually mixtures <strong>of</strong> cell types, so the effectiveconcentration <strong>of</strong> a low-abundance species functional <strong>in</strong> a rare cell type may bemuch less than one copy per cell. L<strong>in</strong>earity <strong>of</strong> the <strong>in</strong>tensity versus abundance relationis <strong>of</strong> <strong>in</strong>terest but not as fundamentally tied to <strong>in</strong>formation content <strong>in</strong> the data.Spike-<strong>in</strong> materials may depart subtly <strong>in</strong> their length, label<strong>in</strong>g, and chemicalproperties from the actual target fragments, mak<strong>in</strong>g them problematic as a performancemeasure. One way around this is to use spike-<strong>in</strong> materials that are assimilar as possible to the targets <strong>of</strong> <strong>in</strong>terest. Another strategy is to identify probesthat repeatedly show large ratios between two different samples, then look at the observedversus l<strong>in</strong>early predicted ratios for these probes as these samples are mixed<strong>in</strong> different fractions. The Food and Drug Adm<strong>in</strong>istration (FDA) has adopted thismethod, us<strong>in</strong>g rat tissues <strong>in</strong> a pilot study to develop assessment methods for submissions<strong>of</strong> microarray-based drug development data (55). Another way <strong>in</strong>volvesgenerat<strong>in</strong>g the Receiver Operat<strong>in</strong>g Characteristic (ROC) curve for difference detection(56). This curve shows, for a given process flow and data analysis stream,the trade between false positives and total positives as the detection threshold isvaried. It is fundamentally related to <strong>in</strong>formation content <strong>in</strong> the data. By analyz<strong>in</strong>gnom<strong>in</strong>ally identical <strong>in</strong>dependent samples, and also samples possess<strong>in</strong>g true biologicaldifferences, false positives can be def<strong>in</strong>ed as differences detected betweennom<strong>in</strong>ally identical samples, whereas total positives are def<strong>in</strong>ed as all detecteddifferences.
DNA MICROARRAYS IN BIOLOGY 65Annu. Rev. Biochem. 2005.74:53-82. Downloaded from arjournals.annualreviews.orgby HARVARD UNIVERSITY on 01/31/06. For personal use only.Experiment Design and Data InterpretationAnalysis <strong>of</strong> microarray data touches on most <strong>of</strong> the important issues <strong>in</strong> bio<strong>in</strong>formatics,laboratory <strong>in</strong>formation management, statistics, and mach<strong>in</strong>e learn<strong>in</strong>g,and <strong>of</strong> course, it must be tightly coupled to the orig<strong>in</strong>al experiment design and<strong>in</strong>tent. Commercial and free s<strong>of</strong>tware packages have been developed to help withsome or all <strong>of</strong> the analysis process, and many useful methods discussions can befound now <strong>in</strong> textbooks (57–61). The discussion here is <strong>in</strong>tended to po<strong>in</strong>t out afew underappreciated issues and give a broad sketch <strong>of</strong> the process.Be<strong>in</strong>g attractive but expensive technology, <strong>microarrays</strong> were used <strong>in</strong>itially <strong>of</strong>tenwith <strong>in</strong>sufficient measurement replication, and issues <strong>of</strong> false positives under multiplehypothesis test<strong>in</strong>g were somewhat slow to be confronted. It is now appreciatedthat every probe has its own biases and error distribution due to a particular experimentalworkflow and that the errors have contributions that can look additive,multiplicative (e.g., log-normal), or Poisson. Intensity transformations (62–64),or a difference detection statistic based on explicit model<strong>in</strong>g <strong>of</strong> the presence <strong>of</strong>additive and multiplicative errors (4), can remove the gross trends <strong>of</strong> error levelas a function <strong>of</strong> <strong>in</strong>tensity, so that analysis <strong>of</strong> variance (ANOVA) methods becomevery useful for analyz<strong>in</strong>g factorial experiment designs (65), such as samples takenacross drug, dose, time, and tissue, <strong>in</strong>clud<strong>in</strong>g replicates. But with affordable numbers<strong>of</strong> replicates, the <strong>in</strong>dividual probe efficiencies and error levels rema<strong>in</strong> poorlydeterm<strong>in</strong>ed. Individual probe efficiencies can be separated from their target speciesabundance us<strong>in</strong>g any diverse set <strong>of</strong> conditions (66). And statistical “borrow<strong>in</strong>g”can be done from replicates <strong>of</strong> related experimental conditions to better determ<strong>in</strong>ethe <strong>in</strong>dividual error levels. So far it has not been possible to achieve all <strong>of</strong>the desired objectives <strong>in</strong> a computationally tractable framework, which would <strong>in</strong>volveANOVA-like recovery <strong>of</strong> the effects <strong>of</strong> the multiple experiment parameters,variance stabilization, and probe- and gene-specific error properties adapt<strong>in</strong>g to<strong>in</strong>creas<strong>in</strong>g amounts <strong>of</strong> available data.Particularly <strong>in</strong> expression pr<strong>of</strong>il<strong>in</strong>g <strong>applications</strong>, much <strong>of</strong> the <strong>in</strong>formation isconta<strong>in</strong>ed <strong>in</strong> the behavior <strong>of</strong> low-abundance transcripts whose brightness is notmuch above the background level. Negative control spots, hav<strong>in</strong>g as close as possiblethe average sequence properties <strong>of</strong> the other probes but avoid<strong>in</strong>g homologyto any expected sequences <strong>in</strong> the sample, are therefore very helpful <strong>in</strong> determ<strong>in</strong><strong>in</strong>gand subtract<strong>in</strong>g background <strong>of</strong>fsets. Affymetrix match/mismatch probe pairs solvethis problem well for short oligos but expend half the probes on controls. Residualerrors <strong>in</strong> background subtraction result <strong>in</strong> biases <strong>in</strong> ratio measurements that aremore severe for the lower-<strong>in</strong>tensity probes. This behavior can be partially correctedby assum<strong>in</strong>g that there is a significant subset <strong>of</strong> transcripts <strong>in</strong> the sample that arenot different between the two samples be<strong>in</strong>g ratioed (67), but this correction ishard to <strong>in</strong>tegrate <strong>in</strong>to the desired framework mentioned above.Experiment design must consider the measurement accuracy <strong>of</strong> the microarrayplatform be<strong>in</strong>g used and the magnitude <strong>of</strong> uncontrolled variation likely to be<strong>in</strong>herent <strong>in</strong> the biological samples (39, 68, 69). For most animal-based experiments,the best expression pr<strong>of</strong>il<strong>in</strong>g techniques now produce measurement errors
DNA MICROARRAYS IN BIOLOGY 67Annu. Rev. Biochem. 2005.74:53-82. Downloaded from arjournals.annualreviews.orgby HARVARD UNIVERSITY on 01/31/06. For personal use only.Body MapsThe basel<strong>in</strong>e abundances <strong>of</strong> mRNAs <strong>in</strong> different tissues, sometimes called a “bodymap” <strong>of</strong> expression, are <strong>of</strong> considerable <strong>in</strong>terest because the list <strong>of</strong> tissues wherea gene is expressed provides a key clue as to the function <strong>of</strong> the gene and as towhere compounds target<strong>in</strong>g its prote<strong>in</strong> are likely to do good or harm. If two geneshave similar patterns <strong>of</strong> expression across tissues, this is a clue to functional relatedness.Gene Logic (Gaithersburg, MD) sells access to such databases it createdvia Affymetrix array pr<strong>of</strong>il<strong>in</strong>g <strong>of</strong> tissue samples, and there are several publiclyavailable databases (77).Creat<strong>in</strong>g these maps is <strong>of</strong> course more difficult when the tissues are less dramaticallydifferent and the samples are smaller, such as <strong>in</strong> mapp<strong>in</strong>g regions <strong>of</strong> the mousebra<strong>in</strong> (78). In contrast, the Allen Institute for Bra<strong>in</strong> Science (http://www.bra<strong>in</strong>atlas.org/) is creat<strong>in</strong>g an expression map <strong>of</strong> the mouse bra<strong>in</strong> by perform<strong>in</strong>g many <strong>in</strong> situhybridization slices through a bra<strong>in</strong> for each gene. The former method shouldreveal functional <strong>in</strong>formation for known structures more efficiently, whereas thelatter method should eventually reveal a new f<strong>in</strong>e structure and its associated geneexpression.Case Versus Control Studies: Disease StatesThe most common expression pr<strong>of</strong>il<strong>in</strong>g experiment design compares two biologicalconditions, such as disease state versus normal state. Genes upregulated, orpossibly downregulated, <strong>in</strong> the disease state are more likely than random chanceto be drug targets for that disease and <strong>of</strong>fer a detailed molecular phenotype <strong>of</strong> thedisease. Mean<strong>in</strong>gful results are critically dependent on realistic confidence assignmentsfor the measured differences <strong>in</strong> expression; to belabor the obvious, a 1% falsepositive rate yields 500 false positives out <strong>of</strong> 50,000 reporters. Also, differentialexpression <strong>of</strong> any given gene can arise from proximal or more distal reactive steps<strong>in</strong> the disease process; it is just one clue to function that must be comb<strong>in</strong>ed withother evidence (79–81). Clues as to the mechanisms <strong>of</strong> disease come from look<strong>in</strong>gfor functional categories <strong>of</strong> genes, such as those determ<strong>in</strong>ed from databases <strong>of</strong>functional annotations, that are overrepresented among the differentially expressedgenes (82). Simple case versus control studies have given way to more powerfulexperiment designs to suggest targets and illum<strong>in</strong>ate disease mechanisms. For example,the aftermath <strong>of</strong> stroke <strong>in</strong> a rat model was followed over time <strong>in</strong> three bra<strong>in</strong>regions us<strong>in</strong>g contralateral samples from each animal as matched controls (83).Gene groups regulated at different times postischemia meshed with exist<strong>in</strong>g strokemodels, and a new candidate target for therapeutic <strong>in</strong>tervention was identified.Pars<strong>in</strong>g PathwaysAt first, it would seem unlikely that highly parallel gene expression analysis wouldbe an efficient way to illum<strong>in</strong>ate the detailed structure <strong>of</strong> signal<strong>in</strong>g pathways.However, the question <strong>of</strong> the existence <strong>of</strong> cross talk between mitogen-activated
68 STOUGHTONAnnu. Rev. Biochem. 2005.74:53-82. Downloaded from arjournals.annualreviews.orgby HARVARD UNIVERSITY on 01/31/06. For personal use only.prote<strong>in</strong> k<strong>in</strong>ase (MAPK) signal<strong>in</strong>g pathways was successfully addressed <strong>in</strong> this way(84). Because it was not known where <strong>in</strong> the 6000-gene yeast transcriptome theevidence for cross talk might appear, development <strong>of</strong> this experimental hypothesiswas not practicable without <strong>microarrays</strong>.The existence <strong>of</strong> <strong>of</strong>f-target effects <strong>of</strong> drugs turns out to be a similar k<strong>in</strong>d <strong>of</strong>question. By drug-treat<strong>in</strong>g a cell l<strong>in</strong>e lack<strong>in</strong>g the gene for the drug target, one canargue that any observed transcriptional changes are <strong>of</strong>f-target effects that might beassociated with toxicity or unexpected mechanisms <strong>of</strong> the action. This was donefor the immunosuppression compound FK506 (85), and the <strong>of</strong>f-target effects wereconfirmed by extend<strong>in</strong>g the experiment to cell l<strong>in</strong>es deleted both for the drug targetand for the suspected secondary target.Functional Response PatternsThe power <strong>of</strong> expression pr<strong>of</strong>il<strong>in</strong>g is most evident <strong>in</strong> experiments that explore asystematically varied set <strong>of</strong> conditions. Data redundancy is provided by sampl<strong>in</strong>ga smoothly vary<strong>in</strong>g process, and coregulation <strong>of</strong> genes across a set <strong>of</strong> biologicalconditions reveals functional gene groups.In a nonmicroarray study <strong>of</strong> this type from 1998, RT-PCR measurement setsfor 112 genes at various times dur<strong>in</strong>g rat central nervous system development (86)revealed features <strong>of</strong> the regulatory cascade. The advent <strong>of</strong> <strong>microarrays</strong>, <strong>of</strong> course,enabled a much broader sampl<strong>in</strong>g <strong>of</strong> the genome. DeRisi et al. (87) followed essentiallyall the genes <strong>in</strong> the yeast Saccharomyces cerevisiae grow<strong>in</strong>g <strong>in</strong> culturethrough its diauxic shift. Genes with related known metabolic function showed similarexpression evolution over time. The transcriptional changes observed <strong>in</strong> othergenes helped flesh out knowledge <strong>of</strong> the metabolic pathways <strong>in</strong>volved. Progression<strong>of</strong> expression dur<strong>in</strong>g development was followed dur<strong>in</strong>g early metamorphosis <strong>in</strong>Drosophila (88), and genes were grouped accord<strong>in</strong>g to their pattern <strong>of</strong> expressionover the different phases <strong>of</strong> development. Caenorhabditis elegans was pr<strong>of</strong>iledoveraset <strong>of</strong> developmental phases, growth conditions, and genetic mutations; thediversity <strong>of</strong> these conditions yielded strong group<strong>in</strong>gs <strong>of</strong> coregulated genes (89).As <strong>in</strong> the study mentioned above (83), <strong>in</strong>creas<strong>in</strong>g diversity <strong>of</strong> the conditions set,up to a po<strong>in</strong>t, yields stronger and more <strong>in</strong>formative group<strong>in</strong>gs <strong>of</strong> genes by coregulation.When this po<strong>in</strong>t is reached is a question that is answered by consider<strong>in</strong>gbiological complexity and us<strong>in</strong>g algorithms to f<strong>in</strong>d patterns. In any event, thesegroup<strong>in</strong>gs still are subject to the caveat that similarity <strong>of</strong> response results <strong>in</strong> a “guiltby association” <strong>in</strong>ference (90) and not pro<strong>of</strong> <strong>of</strong> functional relatedness. Marcotteet al. (91) were able to estimate the relative power <strong>of</strong> expression coregulation data,physical association, and sequence-based analyses to <strong>in</strong>fer functions <strong>of</strong> thousands<strong>of</strong> yeast genes; compar<strong>in</strong>g these predictions to accepted functional annotations <strong>in</strong>dicatedfairly limited accuracy <strong>of</strong> the coregulation based <strong>in</strong>ferences, although thisdepends on the set <strong>of</strong> conditions over which the expression pr<strong>of</strong>iles are obta<strong>in</strong>ed.Spellman et al. (92) followed the yeast S. cerevisiae through two cell cycles, firstphas<strong>in</strong>g up the cells <strong>in</strong> the culture with multiple-cycle arrest and release methods.
DNA MICROARRAYS IN BIOLOGY 69Annu. Rev. Biochem. 2005.74:53-82. Downloaded from arjournals.annualreviews.orgby HARVARD UNIVERSITY on 01/31/06. For personal use only.On the basis <strong>of</strong> cyclic expression responses, hundreds <strong>of</strong> new genes were added tothose already known to be regulated <strong>in</strong> the cell cycle, and functional relationshipsbetween different phases <strong>of</strong> the cycle were suggested. Despite the visually clear andpleas<strong>in</strong>g expression patterns that resulted, the detailed conclusions <strong>of</strong> this and subsequentsynchronization studies with <strong>microarrays</strong> have been called <strong>in</strong>to questionover statistical issues and whether most cells are <strong>in</strong> fact synchronized (93). Thisapplication and its controversy illustrate the power <strong>of</strong> the technology and the challenges<strong>in</strong> analyz<strong>in</strong>g these large data sets with uncerta<strong>in</strong> error behavior and <strong>biology</strong>.Hughes et al. (4) pr<strong>of</strong>iled a large set <strong>of</strong> different s<strong>in</strong>gle-gene disruption mutants<strong>in</strong> yeast, compar<strong>in</strong>g their transcriptional state to the wild-type stra<strong>in</strong>. Theresult<strong>in</strong>g patterns (Figure 4) provided a visualization <strong>of</strong> major pathway group<strong>in</strong>gsand provided functional <strong>in</strong>ferences for previously unannotated genes. Figure 4,<strong>in</strong> which rows and columns <strong>of</strong> the expression ratio data were reordered accord<strong>in</strong>gto agglomerative hierarchical similarity cluster<strong>in</strong>g, illustrates the important dist<strong>in</strong>ctionbetween two modes <strong>of</strong> functional <strong>in</strong>ference. Proximity <strong>of</strong> two genes <strong>in</strong> thehorizontal dimension is the guilt by association mode <strong>of</strong> <strong>in</strong>ference. These genesrespond similarly to the disruptions <strong>of</strong> other genes. But this k<strong>in</strong>d <strong>of</strong> similarity <strong>of</strong>tenFigure 4 Expression responses to s<strong>in</strong>gle-gene deletions <strong>in</strong> yeast. Each row representsthe up- (red) ordownregulation (green) <strong>of</strong>expression <strong>in</strong> response to a s<strong>in</strong>gle-genedisruption <strong>in</strong> yeast (4). Only 300 genes (columns) are shown. These were the mostresponsive among the ∼6000 yeast genes measured <strong>in</strong> each two-color hybridizationexperiment. Columns, and <strong>in</strong>dependently the rows, have been rearranged via agglomerativehierarchical cluster<strong>in</strong>g to place rows with similar response patterns near eachother, and columns with similar response patterns near each other. Each red or greenisland then represents a coord<strong>in</strong>ated transcriptional response that is similar for each <strong>of</strong>a set <strong>of</strong> gene disruptions.
70 STOUGHTONAnnu. Rev. Biochem. 2005.74:53-82. Downloaded from arjournals.annualreviews.orgby HARVARD UNIVERSITY on 01/31/06. For personal use only.is the result <strong>of</strong> a fairly un<strong>in</strong>terest<strong>in</strong>g downstream convergence <strong>of</strong> pathways, suchas a global stress signature. Proximity on the vertical axis means two genes, whendisrupted, produce similar cell responses at the molecular level. This similarity <strong>of</strong>molecular phenotype is a stronger <strong>in</strong>dication <strong>of</strong> functional similarity, <strong>in</strong> analogyto conventional genetic studies, as was borne out by the biochemical confirmationrate achieved <strong>in</strong> this work for functional predictions based on the vertical axisproximity compared to those based on horizontal axis proximity (4).Just as the molecular phenotypes associated with disruption <strong>of</strong> genes <strong>of</strong> knownfunction serve as landmarks <strong>in</strong> the above example, toxicity landmarks <strong>in</strong> rat liverwere produced by pr<strong>of</strong>il<strong>in</strong>g the response to compounds <strong>of</strong> known toxicity (94,95). The expression pr<strong>of</strong>iles produced by compounds under study then can be<strong>in</strong>terpreted for the mechanism and likelihood <strong>of</strong> toxicity. Biological <strong>in</strong>terpretation<strong>of</strong> the respond<strong>in</strong>g genes also gives clues to the mechanisms <strong>of</strong> toxicity. Similarly,efficacy landmarks can be provided by pr<strong>of</strong>il<strong>in</strong>g drugs with known mechanisms<strong>of</strong> action. Expression responses to psychoactive compounds <strong>in</strong> primary humanneurons <strong>in</strong> vitro were used to develop classifiers for antidepressant, antipsychotic,and opioid drug action (96). The products <strong>of</strong> such projects can be thought <strong>of</strong> eitheras biomarkers for particular classification decisions or as a general resource for<strong>in</strong>terpret<strong>in</strong>g the bioactivity <strong>of</strong> new compounds.One <strong>of</strong> the most common experiment types <strong>in</strong> the drug discovery and diagnosticsarena is the deliberate search for biomarkers <strong>of</strong> a particular human phenotypicend po<strong>in</strong>t. Cancer outcome prognosis is a very popular category <strong>of</strong> these because,conceivably, pr<strong>of</strong>itable microarray-based cl<strong>in</strong>ical treatment decisions are not manyyears <strong>of</strong>f. Alizadeh et al. (97) found expression patterns <strong>in</strong>dicative <strong>of</strong> survival<strong>in</strong> B-cell lymphoma patients and characteristics <strong>of</strong> two subtypes <strong>of</strong> large diffuselymphoma B cells. In this study, the microarray probes were chosen to target genesexpressed <strong>in</strong> lymphoid cells and to be relevant to immune response. A subset <strong>of</strong> thepredictive markers was confirmed <strong>in</strong> follow-up validation studies with PCR. Van t’Veer et al. (98) were able to f<strong>in</strong>d an arithmetic function <strong>of</strong> the expression levels <strong>of</strong>70 transcripts that predicted metastasis <strong>of</strong> breast tumors out <strong>of</strong> ∼25,000 pr<strong>of</strong>iled.This predictor was derived and cross-validated us<strong>in</strong>g a set <strong>of</strong> 98 patients, and thenit was validated <strong>in</strong> a larger follow-up study <strong>of</strong> almost 300 patients (99). A recentmeta-analysis <strong>of</strong> 84 microarray-based cancer outcome studies found that very few<strong>of</strong> them accomplished thorough validation and that, not surpris<strong>in</strong>gly, larger cohortsand larger probe sets <strong>in</strong>creased the chances <strong>of</strong> f<strong>in</strong>d<strong>in</strong>g good biomarkers (100).There is a close relationship <strong>in</strong> these studies between develop<strong>in</strong>g predictorsand recogniz<strong>in</strong>g subphenotypes <strong>of</strong> disease. In general, the detailed molecular phenotypeprovided by expression pr<strong>of</strong>il<strong>in</strong>g allows discrim<strong>in</strong>ation between multiplestates that may at one moment have the same gross phenotype but for which thesubsequent progression <strong>of</strong> events differs.Integrative High-Throughput StudiesThe excit<strong>in</strong>g possibility <strong>of</strong> reconstruct<strong>in</strong>g biological pathways from large microarrayexpression data sets, h<strong>in</strong>ted at <strong>in</strong> Figure 4, has proved elusive, although some
DNA MICROARRAYS IN BIOLOGY 71Annu. Rev. Biochem. 2005.74:53-82. Downloaded from arjournals.annualreviews.orgby HARVARD UNIVERSITY on 01/31/06. For personal use only.progress has been made by start<strong>in</strong>g with the assumption <strong>of</strong> sparse network connectivity(101). When other data types are pr<strong>of</strong>iled at the same time, greater poweris achieved.By comb<strong>in</strong><strong>in</strong>g regulatory sequence motif f<strong>in</strong>d<strong>in</strong>gs with expression coregulationresponse cluster<strong>in</strong>g, better confidence is achieved <strong>in</strong> identify<strong>in</strong>g regulatory elementsand the sets <strong>of</strong> genes that should respond to them (102–105). The conclusionsfrom these methods are checked further aga<strong>in</strong>st direct experimental determ<strong>in</strong>ations(106) <strong>of</strong> transcription factor b<strong>in</strong>d<strong>in</strong>g to the genome (107).Build<strong>in</strong>g on a prelim<strong>in</strong>ary study, Ideker and coworkers (108, 109) obta<strong>in</strong>edproteomic and mRNA response pr<strong>of</strong>iles for yeast cultures, correspond<strong>in</strong>g to a set<strong>of</strong> galactose utilization gene mutations and growth conditions, and comb<strong>in</strong>ed thesedata with physical <strong>in</strong>teraction data to obta<strong>in</strong> ref<strong>in</strong>ements to the galactose utilizationpathways. Know<strong>in</strong>g the levels <strong>of</strong> both the mRNAs and their associated prote<strong>in</strong>s,<strong>in</strong>clud<strong>in</strong>g transcription factors, allows specific tests <strong>of</strong> alternative network modelsthat are nearly impossible with mRNA data alone.Schadt et al. (110) obta<strong>in</strong>ed from the same 111 mice, by microsatellite genotyp<strong>in</strong>gat 13-centimorgan (cM) spac<strong>in</strong>g, 23,000-gene expression pr<strong>of</strong>iles from theirlivers and detailed phenotypic data. The data were comb<strong>in</strong>ed <strong>in</strong> novel ways t<strong>of</strong><strong>in</strong>d genetic loci controll<strong>in</strong>g the mRNA levels and the phenotypic traits associatedwith common multigenic diseases like obesity. These methods promise to be anorder <strong>of</strong> magnitude more efficient than conventional l<strong>in</strong>kage analysis for f<strong>in</strong>d<strong>in</strong>gcausative alleles. In Figure 5, expression data for the most differentially regulatedgenes are displayed, organized by unsupervised cluster<strong>in</strong>g. The phenotypic codeson the left <strong>of</strong> the heatmap, <strong>in</strong>dicat<strong>in</strong>g fat pad mass, show that even though thecluster<strong>in</strong>g was unsupervised, the results are dom<strong>in</strong>ated by changes associated withthis phenotype. The structure evident <strong>in</strong> the horizontal direction suggests genesubsets are associated with different pathways <strong>in</strong>volved <strong>in</strong> the phenotype, and thecorrespond<strong>in</strong>g vertical structure suggests subsets <strong>of</strong> cross-bred animals that werefat for those reasons. In fact, by perform<strong>in</strong>g traditional quantitative trait loci analysisus<strong>in</strong>g subsets <strong>of</strong> animals identified <strong>in</strong> this way, l<strong>in</strong>kage estimates, or log <strong>of</strong> theodds score peaks across the genome, were sharpened and <strong>in</strong>tensified, and causativegenes began to be associated with different subphenotypes <strong>of</strong> obesity.There is an important dist<strong>in</strong>ction between <strong>in</strong>tegrat<strong>in</strong>g data types at the level<strong>of</strong> conclusions and <strong>in</strong>tegrat<strong>in</strong>g them at a deeper level <strong>in</strong> the context <strong>of</strong> a detailedbiological model. Franke et al. (111) recently presented a s<strong>of</strong>tware tool that br<strong>in</strong>gstogether l<strong>in</strong>kage, association, expression data, and functional annotations to supportresearch objectives similar to those <strong>of</strong> Schadt et al. (110). However, this<strong>in</strong>tegration was at the level <strong>of</strong> <strong>in</strong>ferences already drawn from the separate datasets. Schadt et al. (110) obta<strong>in</strong>ed the multiple data types from the same animalsand used the <strong>in</strong>dividual mRNAs as <strong>in</strong>termediate phenotypes, implicitly plac<strong>in</strong>gthem <strong>in</strong> a model that relates them to the causative alleles and to the downstreamphysiologic phenotypes. In fact, their work is be<strong>in</strong>g extended to reconstruct causalnetworks <strong>of</strong> genes. It is tempt<strong>in</strong>g to use the term “coherent” to refer to this deeperk<strong>in</strong>d <strong>of</strong> data <strong>in</strong>tegration, <strong>in</strong> analogy to its usage <strong>in</strong> electrical eng<strong>in</strong>eer<strong>in</strong>g and signalprocess<strong>in</strong>g, that leads to greater signal-to-noise ratios <strong>in</strong> detection.
Annu. Rev. Biochem. 2005.74:53-82. Downloaded from arjournals.annualreviews.orgby HARVARD UNIVERSITY on 01/31/06. For personal use only.72 STOUGHTONFigure 5 Coherent analysis <strong>of</strong> expression pr<strong>of</strong>iles, genotype scans, and phenotypic datafrom cross-bred mice (110). Animals with extreme phenotypic values, <strong>in</strong> this case fat padmass, were selected for analysis (a). Unsupervised cluster<strong>in</strong>g <strong>of</strong> liver expression pr<strong>of</strong>ilesallowed subgroups to be def<strong>in</strong>ed (b). Genetic l<strong>in</strong>kages <strong>of</strong> phenotype (c) and <strong>of</strong> <strong>in</strong>dividualmRNA levels to genome locations were sharpened and strengthened by us<strong>in</strong>g theseexpression-def<strong>in</strong>ed phenotypic subgroups.
DNA MICROARRAYS IN BIOLOGY 73We<strong>in</strong>ste<strong>in</strong> et al. (112) comb<strong>in</strong>ed 1376-gene expression pr<strong>of</strong>iles <strong>of</strong> the 60 NationalCancer Institute cancer cell l<strong>in</strong>es with growth <strong>in</strong>hibition data for these l<strong>in</strong>esunder 118 drug treatments to f<strong>in</strong>d clues as to molecular targets <strong>of</strong> the compounds.Correlation <strong>of</strong> growth <strong>in</strong>hibition with expression level over the 60 cell l<strong>in</strong>es foreach drug-gene pair yielded a 1376 × 118 table <strong>of</strong> correlation values. This tablethen was manipulated via cluster<strong>in</strong>g <strong>of</strong> rows and columns, as <strong>in</strong> Figure 4, to obta<strong>in</strong>groups <strong>of</strong> related targets and related compounds.Annu. Rev. Biochem. 2005.74:53-82. Downloaded from arjournals.annualreviews.orgby HARVARD UNIVERSITY on 01/31/06. For personal use only.Splic<strong>in</strong>g and Exon DiscoveryShoemaker et al. (113) designed a set <strong>of</strong> genomic til<strong>in</strong>g arrays for human chromosomes21 and 22 to identify novel exons <strong>in</strong> an unbiased and comprehensive fashion.60-mer probes were placed 30 nt steps across the repeat masked genomic sequenceand the set <strong>of</strong> <strong>microarrays</strong> were hybridized with RNA from six different tissues.The presence <strong>of</strong> expression signals found across multiple human tissues was usedto identify novel exons and to revise annotated gene structures. Figure 6 shows anexample <strong>of</strong> the hybridization signal from a gene region <strong>of</strong> chromosome 21.Multiple probes spann<strong>in</strong>g several exons <strong>of</strong> a gene, hybridized to samples frommultiple tissues, provide enough <strong>in</strong>formation to <strong>in</strong>fer alternative splice forms.This was first demonstrated <strong>in</strong> rat tissues (114). Johnson and coworkers (25, 115)designed probes for ∼12,000 human genes that were hybridized with samples frommultiple human tissues. The result<strong>in</strong>g hybridization data from the junction probeswere used to identify thousands <strong>of</strong> novel splice variants along with an expressionatlas show<strong>in</strong>g <strong>in</strong> which tissues they were expressed.ANALYSIS OF GENOMIC DNAWhen the gene copy number is changed, there are correspond<strong>in</strong>g changes <strong>in</strong> mRNAlevels. Microarrays have, <strong>in</strong> this way, detected aneuploidies <strong>in</strong> yeast deletion stra<strong>in</strong>s(116) and have seen a mixture <strong>of</strong> regulation and copy number changes <strong>in</strong> prostatecancer cells (117). Copy number changes, <strong>of</strong> course, can be seen directly <strong>in</strong> theconcentration <strong>of</strong> genomic DNA fragments from particular genome regions, and<strong>microarrays</strong> have been used to scan for cancer-related changes (118). The temporalprogression <strong>of</strong> replication along the chromosome has even been tracked <strong>in</strong> this way(119).Ren et al. (106) used <strong>microarrays</strong> to report which regulatory sites bound acerta<strong>in</strong> transcription factor <strong>in</strong> yeast. A given transcription factor was allowed tob<strong>in</strong>d to fragmented genomic DNA, which was then enriched for the bound regionsus<strong>in</strong>g chromat<strong>in</strong> immunoprecipitation, amplified and labeled, and hybridized toan array <strong>of</strong> spots conta<strong>in</strong><strong>in</strong>g <strong>in</strong>tergenic DNA. This approach was recently used tomap the b<strong>in</strong>d<strong>in</strong>g sites for three human transcription factors on chromosomes 21and 22 (120). A similar technique was employed to map histone deacetylation <strong>in</strong>the yeast genome (121).
74 STOUGHTONAnnu. Rev. Biochem. 2005.74:53-82. Downloaded from arjournals.annualreviews.orgby HARVARD UNIVERSITY on 01/31/06. For personal use only.Figure 6 Til<strong>in</strong>g probes used to ref<strong>in</strong>e gene structures. Overlapp<strong>in</strong>g 60-mer oligo probes weredesigned to cover genomic regions where exons were computationally predicted (113), revisedand repr<strong>in</strong>ted with permission (http://www.nature.com/). In this display <strong>of</strong> a gene region onchromosome 21, probe <strong>in</strong>tensity was truncated below the expected noise background level.For some exons, the computational prediction is confirmed. For others, it is revised by thedata.Detailed Characterization <strong>of</strong> Microbial PathogensThe highly parallel <strong>in</strong>terrogation <strong>of</strong> pathogen genomes, enabled by <strong>microarrays</strong>,promises to radically change the diagnosis <strong>of</strong> <strong>in</strong>fectious disease, monitor emerg<strong>in</strong>g<strong>in</strong>fections, and monitor the safety <strong>of</strong> food, water, and air. Probes constructedfor genes <strong>in</strong> a basel<strong>in</strong>e stra<strong>in</strong> can be used to characterize and compare with thegenomes <strong>of</strong> test stra<strong>in</strong>s via competitive hybridization. This approach was usedto identify differences between Mycobacterium tuberculosis and the associatedBacillus Calmette-Guer<strong>in</strong> vacc<strong>in</strong>e stra<strong>in</strong> (122), to identify horizontal gene transferscaus<strong>in</strong>g methicill<strong>in</strong> resistance <strong>in</strong> Staphylococcus aureus (123), and to show
DNA MICROARRAYS IN BIOLOGY 75Annu. Rev. Biochem. 2005.74:53-82. Downloaded from arjournals.annualreviews.orgby HARVARD UNIVERSITY on 01/31/06. For personal use only.near genetic identity between stra<strong>in</strong>s responsible for two separate epidemics <strong>of</strong>rheumatic fever caused by Group A Streptococcus (124).Til<strong>in</strong>g probes across the VP1 cod<strong>in</strong>g region <strong>of</strong> vacc<strong>in</strong>e-derived poliovirus(VDPV) were used to detect emerg<strong>in</strong>g po<strong>in</strong>t mutations associated with vacc<strong>in</strong>evirulence, whereas VDPV stra<strong>in</strong>-specific probes were used to detect recomb<strong>in</strong>ationevents (125). Us<strong>in</strong>g PCR followed by microarray hybridization, probestargeted at specific genes are used to detect the presence <strong>of</strong> virulence factors,antigenic determ<strong>in</strong>ants (126) and drug resistance determ<strong>in</strong>ants (127) as well asto resolve closely related species <strong>of</strong> bacteria (128, 129). The advantages <strong>of</strong> microarrayreadout over specific PCR detection, such as one or a few TaqMan probesets, are the number and diversity <strong>of</strong> identification sites that can be detected peramplicon and the degree <strong>of</strong> multiplex<strong>in</strong>g <strong>in</strong> the PCR that can then be demultiplexedby the arrays. Several different highly multiplexed amplification strategiesas front ends to microarray readout recently have been compared (130), <strong>in</strong>clud<strong>in</strong>grandom primed PCR, isothermal full-genome amplification, and multiplexedspecific PCR. Random primed amplification followed by microarray detectionis particularly useful for detect<strong>in</strong>g and identify<strong>in</strong>g rapidly mutat<strong>in</strong>g viruses becauseby design<strong>in</strong>g the microarray probes for conserved regions <strong>of</strong> genes, unexpectedstra<strong>in</strong> variants still will be detected, and a large number <strong>of</strong> virus speciescan be detected at once. Us<strong>in</strong>g conserved and stra<strong>in</strong>-specific probes, this approachwas demonstrated to detect and dist<strong>in</strong>guish most respiratory viruses (131, 132),and the approach was used to help identify the recently emerged Severe AcuteRespiratory Syndrome virus and its phylogenetic relationship to other viruses(132, 133).Host-microbe <strong>in</strong>teractions also could be studied <strong>in</strong> detail us<strong>in</strong>g a comb<strong>in</strong>ation<strong>of</strong> genomic analysis <strong>of</strong> the pathogen and expression pr<strong>of</strong>il<strong>in</strong>g <strong>of</strong> host immune cells(134, 135).Genotyp<strong>in</strong>gRapid acquisition <strong>of</strong> genetic <strong>in</strong>formation was one <strong>of</strong> the orig<strong>in</strong>al motivations forthe Affymetrix microarray technology (10). Resequenc<strong>in</strong>g for po<strong>in</strong>t mutations us<strong>in</strong>g<strong>microarrays</strong> was demonstrated <strong>in</strong> 1996 (136) and has become an establishedmethodology (137). The basel<strong>in</strong>e method <strong>in</strong>volves short probes complementaryto every N-mer <strong>of</strong> the basel<strong>in</strong>e target sequence and additional probes that varythe nucleotide at the putative mutation position. Each <strong>of</strong> these also can be pairedwith a “mismatch” probe to control for nonspecific hybridization. Chips havebeen designed for mutation detection <strong>in</strong> genes <strong>of</strong> particular <strong>in</strong>terest to humanhealth, <strong>in</strong>clud<strong>in</strong>g the cystic fibrosis gene CFTR (138), the breast cancer susceptibilitygene BRCA1, P53 (139), and mitochondrial DNA (136, 137, 140). Studies<strong>of</strong> the performance <strong>of</strong> these devices, <strong>in</strong> the context <strong>of</strong> P53 (141) and mitochondrialDNA (140, 142), have shown the promise <strong>of</strong> these methods and also thedifficulties associated with false detections when the underly<strong>in</strong>g mutation ratesare low.
76 STOUGHTONWhen a specific list <strong>of</strong> known polymorphisms scattered throughout the genomeneed to be targeted, probe sets can be designed just for them, or <strong>microarrays</strong> can beused as a demultiplex<strong>in</strong>g tool when the molecular recognition <strong>of</strong> the polymorphismtakes place first <strong>in</strong> a highly multiplexed volume reaction (5, 143).EMERGING TRENDSAnnu. Rev. Biochem. 2005.74:53-82. Downloaded from arjournals.annualreviews.orgby HARVARD UNIVERSITY on 01/31/06. For personal use only.Microarray technologies based on light-directed synthesis have room to followa Moore’s Law m<strong>in</strong>iaturization for several more years before runn<strong>in</strong>g up aga<strong>in</strong>stfundamental physical limits imposed by the diffraction <strong>of</strong> light, which tend toplace a lower limit <strong>of</strong> ∼1 micron on feature size. This m<strong>in</strong>iaturization will allowboth greater probe budgets and smaller hybridization volumes. The greaterprobe counts can be used to <strong>in</strong>crease the redundancy <strong>of</strong> measurements and to<strong>in</strong>dependently report alternative splice forms for every gene <strong>in</strong> a s<strong>in</strong>gle hybridization.Resequenc<strong>in</strong>g <strong>applications</strong> can tackle larger genome regions. The smallerhybridization volumes translate <strong>in</strong>to less required biological <strong>in</strong>put sample and/orless required amplification. With great care, laser-microdissected samples, compris<strong>in</strong>gonly a few cells, can be pr<strong>of</strong>iled currently <strong>in</strong> research sett<strong>in</strong>gs (144, 145),and this will become commonplace. Microarray hybridizations <strong>in</strong>creas<strong>in</strong>gly willbe run <strong>in</strong> a higher-throughput manner with sample prep done <strong>in</strong> 96-wellplates (146).Reagent use and cost will decrease with fluid volume. Eventually the costs willbe low enough to make them tolerable <strong>in</strong> a rout<strong>in</strong>e medical po<strong>in</strong>t-<strong>of</strong>-care context;costs already have decreased to the po<strong>in</strong>t where some cl<strong>in</strong>ical diagnostic contextswith high reimbursable value per test, such as tests support<strong>in</strong>g choice <strong>of</strong> cancertreatment, could afford microarray measurement.Cost may not be the ma<strong>in</strong> obstacle for long. In 1996, Oncormed (Gaithersburg,MD) began us<strong>in</strong>g an Affymetrix P53 chip <strong>in</strong> cl<strong>in</strong>ical trials to stratify patients withhead and neck cancer. However, as <strong>of</strong> this review, DNA chips still have not madeit <strong>in</strong>to cl<strong>in</strong>ical practice. The FDA, <strong>in</strong> July 2003, sent a strong message to RocheMolecular Diagnostics about their Affymetrix microarray-based AmpliChip TM designedto report genotypes relevant to <strong>in</strong>dividual human drug metabolism differences;the effect <strong>of</strong> the message was that before market<strong>in</strong>g beg<strong>in</strong>s the AmpliChip TMwould have to pass the str<strong>in</strong>gent exam<strong>in</strong>ation expected <strong>of</strong> any device “<strong>in</strong>tendedfor a use which is <strong>of</strong> substantial importance <strong>in</strong> prevent<strong>in</strong>g impairment <strong>of</strong> humanhealth” (147). Although not unexpected, this is a rem<strong>in</strong>der that years <strong>of</strong> validationtest<strong>in</strong>g await any new set <strong>of</strong> diagnostic markers, even those generated with impressivetechnology. However, the FDA is actively <strong>in</strong>volved <strong>in</strong> promot<strong>in</strong>g a cooperativeframework to evolve guidel<strong>in</strong>es for use <strong>in</strong> drug discovery, cl<strong>in</strong>ical trials, and publichealth (148).In the near term, mRNA biomarkers identified via microarray pr<strong>of</strong>il<strong>in</strong>g mayenter the cl<strong>in</strong>ic <strong>in</strong>stead via <strong>in</strong>dividual RT-PCR tests or <strong>in</strong> the form <strong>of</strong> enzyme-l<strong>in</strong>ked
DNA MICROARRAYS IN BIOLOGY 77Annu. Rev. Biochem. 2005.74:53-82. Downloaded from arjournals.annualreviews.orgby HARVARD UNIVERSITY on 01/31/06. For personal use only.immunosorbent assay tests for associated circulat<strong>in</strong>g prote<strong>in</strong>s. Because serum isso accessible and <strong>in</strong>formation rich, proteomic pr<strong>of</strong>il<strong>in</strong>g for biomarkers is a strongcompetitor (149).As proteomic and metabolomic pr<strong>of</strong>il<strong>in</strong>g catch up to mRNA pr<strong>of</strong>il<strong>in</strong>g, and the<strong>in</strong>formatics <strong>in</strong>frastructure is developed to <strong>in</strong>terpret these three data types coherentlyat the level <strong>of</strong> biological pathways (150), the acquisition <strong>of</strong> detailed biologicalknowledge will accelerate. It will be most powerful to make these measurementssimultaneously on the same tissue samples, or at least the same organism, to achieveas much coherence as possible <strong>in</strong> the measurements.Recent advances <strong>in</strong> achiev<strong>in</strong>g specific gene disruptions <strong>in</strong> mammalian cells viathe RNA <strong>in</strong>terference mechanism should allow large sets <strong>of</strong> known specific perturbationsto be executed (151) and the collection <strong>of</strong> high-dimensional responsedata. The <strong>in</strong>creas<strong>in</strong>g speed and decreas<strong>in</strong>g price at which these measurementscan be accomplished and analyzed suggest a different way <strong>of</strong> do<strong>in</strong>g biologicalresearch. For example, a drug company wish<strong>in</strong>g to develop new therapeuticsfor a disease could stake out an area <strong>of</strong> <strong>biology</strong> (def<strong>in</strong>ed by the relevant sets<strong>of</strong> gene disruptions, exist<strong>in</strong>g compounds, disease states, and tissues) and pr<strong>of</strong>ilethe responses to essentially all possible manipulations, achiev<strong>in</strong>g for their <strong>in</strong>vestmenta new, more complete level <strong>of</strong> understand<strong>in</strong>g <strong>of</strong> the relevant pathways, lists<strong>of</strong> potential drug targets, and target N-tuples for comb<strong>in</strong>ation therapies, rankedfor probable efficacy and toxicity. One caveat here is that animal experimentcosts do not follow Moore’s Law, but small-volume cell cultures conceivablycould.Shar<strong>in</strong>g and standardization <strong>of</strong> expression data are potentially very powerfuldirections for this work. Of the many publicly accessible databases for gene expression(152), Gene Expression Omnibus, at the National Center for BiotechnologyInformation (153), and its European counterpart Array Express, at the EuropeanBio<strong>in</strong>formatics Institute (154), are <strong>in</strong>tended to become large-scale repositoriesand have adopted standard data structures and guidel<strong>in</strong>es for m<strong>in</strong>imum support<strong>in</strong>g<strong>in</strong>formation, expressed <strong>in</strong> Extensible Markup Language. However, typically the<strong>in</strong> vivo experiment histories are not yet documented <strong>in</strong> enough detail for trulycoherent analysis across data sets, even when the probe sequences can be relatedto common target sequences. Given the magnitude <strong>of</strong> the comb<strong>in</strong>ed <strong>in</strong>vestmentsbe<strong>in</strong>g made <strong>in</strong> these measurements, this is a frustrat<strong>in</strong>g limitation, but one which<strong>in</strong>volves the subtle variations between nom<strong>in</strong>ally similar biological systems as wellas bio<strong>in</strong>formatics issues.ACKNOWLEDGMENTSThe author is <strong>in</strong>debted to Michael Meyer and Edward Sheldon for many usefulfacts and references, to Matthew Kidd for help with the figures, to DanielShoemaker for helpful review and comments, and to Nicole Lewon for editorialassistance.
78 STOUGHTONThe Annual Review <strong>of</strong> Biochemistry is onl<strong>in</strong>e athttp://biochem.annualreviews.orgLITERATURE CITEDAnnu. Rev. Biochem. 2005.74:53-82. Downloaded from arjournals.annualreviews.orgby HARVARD UNIVERSITY on 01/31/06. For personal use only.1. Jordan B. 2001. In DNA Microarrays:Gene Expression Applications, ed. B Jordan,pp. 3–12. Berl<strong>in</strong>: Spr<strong>in</strong>ger-Verlag2. Zhu H, Bilg<strong>in</strong> M, Snyder M. 2003. Annu.Rev. Biochem. 72:783–8123. Boguski MS, McIntosh MW. 2003. Nature422:233–374. Hughes TR, Marton MJ, Jones AR,Roberts CJ, Stoughton R, et al. 2000. Cell102:109–265. Fan JB, Oliphant A, Shen R, KermaniBG, Garcia F, et al. 2003. Highly ParallelSNP Genotyp<strong>in</strong>g. Cold Spr<strong>in</strong>g Harbor,NY: Cold Spr<strong>in</strong>g Harbor Lab.6. Shoemaker DD, Lashkari DA, MorrisD, Mittmann M, Davis RW. 1996. Nat.Genet. 14:450–567. Baldi P, Hatfield GW. 2002. See Ref. 155,pp. 7–138. Stekel D. 2003. See Ref. 156, pp. 1–189. Heller MJ. 2002. Annu. Rev. Biomed. Eng.4:129–5310. Fodor SP, Read JL, Pirrung MC, Stryer L,Lu AT, Solas D. 1991. Science 251:767–7311. S<strong>in</strong>gh-Gasson S, Green RD, Yue Y, NelsonC, Blattner F, et al. 1999. Nat. Biotechnol.17:974–7812. Hughes TR, Mao M, Jones AR, BurchardJ, Marton MJ, et al. 2001. Nat. Biotechnol.19:342–4713. Stekel D. 2003. See Ref. 156, pp. 7–814. Schena M, Shalon D, Davis RW, BrownPO. 1995. Science 270:467–7015. Shalon D, Smith SJ, Brown PO. 1996.Genome Res. 6:639–4516. Fan JB, Yeakley JM, Bibikova M, Chud<strong>in</strong>E, Wickham E, et al. 2004. Genome Res.14:878–8517. <strong>Roth</strong> ME, Feng L, McConnell KJ, SchafferPJ, Guerra CE, et al. 2004. Nat.Biotechnol. 22:418–2618. Ferguson JA, Boles TC, Adams CP, WaltDR. 1996. Nat. Biotechnol. 14:1681–8419. Gunderson KL, Kruglyak S, Graige MS,Garcia F, Kermani BG, et al. 2004.Genome Res. 14:870–7720. Fulton RJ, McDade RL, Smith PL,Kienker LJ, Kettman JR Jr. 1997. Cl<strong>in</strong>.Chem. 43:1749–5621. Li F, Stormo GD. 2001. Bio<strong>in</strong>formatics17:1067–7622. Stekel D. 2003. See Ref. 156, pp. 19–6123. Santa Lucia J Jr, Allawi HT, SeneviratnePA. 1996. Biochemistry 35:3555–6224. Va<strong>in</strong>rub A, Pettitt BM. 2003. Biopolymers68:265–7025. Johnson JM, Castle J, Garrett-Engele P,Kan Z, Loerch PM, et al. 2003. Science302:2141–4426. Baldi P, Hatfield GW. 2002. See Ref. 155,pp. 29–5227. Nallur G, Luo CH, Fang LH, Cooley S,Dave V, et al. 2001. Nucleic Acids Res.29:e11828. Stears RL, Getts RC, Gullans SR. 2000.Physiol. Genomics 3:93–9929. Karsten SL, Van Deerl<strong>in</strong> VMD, Sabatti C,Gill LH, Geschw<strong>in</strong>d DH. 2002. NucleicAcids Res. 30:e430. Van Gelder RN, von Zastrow ME, YoolA, Dement WC, Barchas JD, Eberw<strong>in</strong>eJH. 1990. Proc. Natl. Acad. Sci. USA87:1663–6731. Eberw<strong>in</strong>e J, Yeh H, Miyashiro K, Cao Y,Nair S, et al. 1992. Proc. Natl. Acad. Sci.USA 89:3010–1432. Luo L, Salunga RC, Guo H, Bittner A, JoyKC, et al. 1999. Nat. Med. 5:117–2233. Froussard P. 1993. PCR Methods Appl.2:185–9034. Zhao S, Molnar G, Zhang J, Zheng L,Averboukh L, Pardee AB. 1998. BioTechniques24:842–50, 52
DNA MICROARRAYS IN BIOLOGY 79Annu. Rev. Biochem. 2005.74:53-82. Downloaded from arjournals.annualreviews.orgby HARVARD UNIVERSITY on 01/31/06. For personal use only.35. Chenchik A, Zhu YY, Diatchenko L, Li R,Hill J, Siebert PD. 1998. In Gene Clon<strong>in</strong>gand Analysis by RT-PCR, ed. PD Siebert,JW Larrick, pp. 305–19. Westborough,MA: Eaton36. Smith L, Underhill P, Pritchard C,Tymowska-Lalanne Z, Abdul-Husse<strong>in</strong> S,et al. 2003. Nucleic Acids Res. 31:e937. Parrish ML, Wei N, Duenwald S, TokiwaGY, Wang Y, et al. 2004. J. Neurosci.Methods 132:57–6838. Dobb<strong>in</strong> K, Shih JH, Simon R. 2003. Bio<strong>in</strong>formatics19:803–1039. Chen JJ, Delongchamp RR, Tsai CA,Hsueh HM, Sistare F, et al. 2004. Bio<strong>in</strong>formatics20:1436–4640. Naef F, Magnasco MO. 2003. Phys. Rev.E 68:01190641. Hekstra D, Taussig AR, Magnasco M,Naef F. 2003. Nucleic Acids Res. 31:1962–6842. Sartor M, Schwanekamp J, Halbleib D,Mohamed I, Karyala S, et al. 2004.BioTechniques 36:790–9643. Dai H, Meyer M, Stepaniants S, ZimanM, Stoughton R. 2002. Nucleic Acids Res.30:e8644. Ku WC, Lau WK, Tseng YT, Tzeng CM,Chiu SK. 2004. Biochem. Biophys. Res.Commun. 315:30–3745. Liu RH, Lenigk R, Druyor-Sanchez RL,Yang J, Grodz<strong>in</strong>ski P. 2003. Anal. Chem.75:1911–1746. Korkola JE, Estep AL, Pejavar S, De-Vries S, Jensen R, Waldman FM. 2003.BioTechniques 35:828–3547. Fare TL, C<strong>of</strong>fey EM, Dai H, He YD,Kessler DA, et al. 2003. Anal. Chem. 75:4672–7548. Baldi P, Hatfield GW. 2002. See Ref. 155,p. 1949. Mansson A, Sundberg M, Balaz M, BunkR, Nicholls IA, et al. 2004. Biochem. Biophys.Res. Commun. 314:529–3450. Schultz S, Smith DR, Mock JJ, SchultzDA. 2000. Proc. Natl. Acad Sci. USA97:996–100151. Oldenburg SJ, Genick CC, Clark KA,Schultz DA. 2002. Anal. Biochem. 309:109–1652. Kamberova G, Shah S. 2002. DNA ArrayImage Analysis: Nuts & Bolts. Salem,MA: DNA Press. 202 pp.53. Stekel D. 2003. See Ref. 156, pp. 62–7254. Yu F, Yao D, Knoll W. 2004. NucleicAcids Res. 32:e7555. Thompson KL. 2003. The value <strong>of</strong> standardsfor regulatory product approval<strong>applications</strong> <strong>in</strong>corporat<strong>in</strong>g noncl<strong>in</strong>icaland cl<strong>in</strong>ical gene expression microarraydata. http://www.cstl.nist.gov/div831/UniversalRNAStds/Thompson.pdf56. He YD, Dai H, Schadt EE, Cavet G, EdwardsSW, et al. 2003. Bio<strong>in</strong>formatics19:956–6557. Stekel D. 2003. See Ref. 156, pp. 62–25258. Kohane IS, Kho AT, Butte AJ. 2003. Microarraysfor an Integrative Genomics.Cambridge, MA: MIT Press. 306 pp.59. Speed T, ed. 2003. Statistical Analysis<strong>of</strong> Gene Expression Microarray Data.Boca Raton, FL: Chapman & Hall/CRC.222 pp.60. Knudsen S. 2004. Guide to Analysis <strong>of</strong>DNA Microarray Data. Hoboken, NJ:Wiley. 168 pp. 2nd ed.61. Baldi P, Hatfield GW. 2002. See Ref. 155,pp. 29–17662. Durb<strong>in</strong> BP, Hard<strong>in</strong> JS, Hawk<strong>in</strong>s DM,Rocke DM. 2002. Bio<strong>in</strong>formatics 18(Suppl. 1):S105–1063. Durb<strong>in</strong> BP, Rocke DM. 2004. Bio<strong>in</strong>formatics20:660–6764. Huber W, von Heydebreck A, SultmannH, Poustka A, V<strong>in</strong>gron M. 2002. Bio<strong>in</strong>formatics18(Suppl. 1):S96–10465. Kerr MK, Mart<strong>in</strong> M, Churchill GA. 2000.J. Comput. Biol. 7:819–3766. Li C, Wong WH. 2001. Proc. Natl. Acad.Sci. USA 98:31–3667. Tseng GC, Oh MK, Rohl<strong>in</strong> L, Liao JC,Wong WH. 2001. Nucleic Acids Res. 29:2549–5768. Churchill GA. 2002. Nat. Genet. 32(Suppl.):490–95
80 STOUGHTONAnnu. Rev. Biochem. 2005.74:53-82. Downloaded from arjournals.annualreviews.orgby HARVARD UNIVERSITY on 01/31/06. For personal use only.69. Speed T, Yang YH. 2003. See Ref. 59, pp.35–9270. Novoradovskaya N, Whitfield ML, BasehoreLS, Novoradovsky A, Pesich R, et al.2004. BMC Genomics 5:2071. Stekel D. 2003. See Ref. 156, pp. 139–18272. Chipman H, Hatie T, Tibshirani R. 2003.See Ref. 59, pp. 159–20073. Valafar F. 2002. Ann. NY Acad. Sci. 980:41–6474. Rougemont J, H<strong>in</strong>gamp P. 2003. BMCBio<strong>in</strong>formatics 4:1575. Stekel D. 2003. See Ref. 156, pp. 183–21076. Dudoit S, Fridlyand J. 2003. See Ref. 59,pp. 93–15877. Su AI, Wiltshire T, Batalov S, Lapp H,Ch<strong>in</strong>g KA, et al. 2004. Proc. Natl. Acad.Sci. USA 101:6062–6778. Del Rio JA, Barlow C. 2002. Prog. Bra<strong>in</strong>Res. 135:149–6079. Lock C, Hermans G, Pedotti R, BrendolanA, Schadt E, et al. 2002. Nat. Med. 8:500–880. Chuaqui RF, Bonner RF, Best CJ, GillespieJW, Flaig MJ, et al. 2002. Nat. Genet.32(Suppl.):509–1481. Miklos GL, Maleszka R. 2004. Nat.Biotechnol. 22:615–2182. Breitl<strong>in</strong>g R, Amtmann A, Herzyk P. 2004.BMC Bio<strong>in</strong>formatics 5:3483. <strong>Roth</strong> A, Gill R, Certa U. 2003. Mol. Cell.Neurosci. 22:353–6484. Roberts CJ, Nelson B, Marton MJ,Stoughton R, Meyer MR, et al. 2000. Science287:873–8085. Marton MJ, DeRisi JL, Bennett HA, IyerVR, Meyer MR, et al. 1998. Nat. Med.4:1293–30186. Wen X, Fuhrman S, Michaels GS, CarrDB, Smith S, et al. 1998. Proc. Natl. Acad.Sci. USA 95:334–3987. DeRisi JL, Iyer VR, Brown PO. 1997. Science278:680–8688. White KP, Rifk<strong>in</strong> SA, Hurban P, HognessDS. 1999. Science 286:2179–8489. Kim SK, Lund J, Kiraly M, Duke K,Jiang M, et al. 2001. Science 293:2087–9290. Clare A, K<strong>in</strong>g RD. 2002. In Silico Biol.2:511–2291. Marcotte EM, Pellegr<strong>in</strong>i M, ThompsonMJ, Yeates TO, Eisenberg D. 1999. Nature402:83–8692. Spellman PT, Sherlock G, Zhang MQ,Iyer VR, Anders K, et al. 1998. Mol. Biol.Cell 9:3273–9793. Cooper S, Shedden K. 2003. Cell Chromosome2:194. War<strong>in</strong>g JF, Jolly RA, Ciurlionis R, LumPY, Praestgaard JT, et al. 2001. Toxicol.Appl. Pharmacol. 175:28–4295. McMillian M, Nie AY, Parker JB, LeoneA, Kemmerer M, et al. 2004. Biochem.Pharmacol. 67:2141–6596. Gunther EC, Stone DJ, Gerwien RW,Bento P, Heyes MP. 2003. Proc. Natl.Acad. Sci. USA 100:9608–1397. Alizadeh AA, Eisen MB, Davis RE, MaC, Lossos IS, et al. 2000. Nature 403:503–1198. van’t Veer LJ, Dai H, van de Vijver MJ,He YD, Hart AA, et al. 2002. Nature415:530–3699. van de Vijver MJ, He YD, van’t Veer LJ,Dai H, Hart AA, et al. 2002. N. Engl. J.Med. 347:1999–2009100. Ntzani EE, Ioannidis JP. 2003. Lancet362:1439–44101. Gardner TS, di Bernardo D, LorenzD, Coll<strong>in</strong>s JJ. 2003. Science 301:102–5102. S<strong>in</strong>ha S, Tompa M. 2000. A statisticalmethod for f<strong>in</strong>d<strong>in</strong>g transcription factorb<strong>in</strong>d<strong>in</strong>g sites. Proc. Int. Conf. Intell. Syst.Mol. Biol. 8:344–54103. GuhaThakurta D, Palomar L, Stormo GD,Tedesco P, Johnson TE, et al. 2002.Genome Res. 12:701–12104. Q<strong>in</strong> ZS, McCue LA, Thompson W, Mayerh<strong>of</strong>erL, Lawrence CE, Liu JS. 2003.Nat. Biotechnol. 21:435–39105. Keles S, Van Der Laan MJ, VulpeC. 2004. Bio<strong>in</strong>formatics 20(16):2799–811
DNA MICROARRAYS IN BIOLOGY 81Annu. Rev. Biochem. 2005.74:53-82. Downloaded from arjournals.annualreviews.orgby HARVARD UNIVERSITY on 01/31/06. For personal use only.106. Ren B, Robert F, Wyrick JJ, AparicioO, Jenn<strong>in</strong>gs EG, et al. 2000. Science290:2306–9107. Gao F, Foat BC, Bussemaker HJ. 2004.BMC Bio<strong>in</strong>formatics 5:31108. Griff<strong>in</strong> TJ, Gygi SP, Ideker T, Rist B,Eng J, et al. 2002. Mol. Cell. Proteomics1:323–33109. Ideker T, Thorsson V, Ranish JA, ChristmasR, Buhler J, et al. 2001. Science292:929–34110. Schadt EE, Monks SA, Drake TA, LusisAJ, Che N, et al. 2003. Nature 422:297–302111. Franke L, van Bakel H, Diosdado B, vanBelzen M, Wapenaar M, Wijmenga C.2004. Eur. J. Hum. Genet. 12(8):633–38112. We<strong>in</strong>ste<strong>in</strong> JN, Myers TG, O’Connor PM,Friend SH, Fornace AJ Jr, et al. 1997. Science275:343–49113. Shoemaker DD, Schadt EE, Armour CD,He YD, Garrett-Engele P, et al. 2001. Nature409:922–27114. Hu GK, Madore SJ, Moldover B, JatkoeT, Balaban D, et al. 2001. Genome Res.11:1237–45115. Castle J, Garrett-Engele P, Armour CD,Duenwald SJ, Loerch PM, et al. 2003.Genome Biol. 4:R66116. Hughes TR, Roberts CJ, Dai H, JonesAR, Meyer MR, et al. 2000. Nat. Genet.25:333–37117. Phillips JL, Hayward SW, Wang Y, VasselliJ, Pavlovich C, et al. 2001. CancerRes. 61:8143–49118. Lucito R, Healy J, Alexander J, Re<strong>in</strong>erA, Esposito D, et al. 2003. Genome Res.13:2291–305119. Raghuraman MK, W<strong>in</strong>zeler EA, Coll<strong>in</strong>gwoodD, Hunt S, Wodicka L, et al. 2001.Science 294:115–21120. Cawley S, Bekiranov S, Ng HH, KapranovP, Sek<strong>in</strong>ger EA, et al. 2004. Cell 116:499–509121. Robyr D, Suka Y, Xenarios I, KurdistaniSK, Wang A, et al. 2002. Cell 109:437–46122. Behr MA, Wilson MA, Gill WP, SalamonH, Schoolnik GK, et al. 1999. Science284:1520–23123. Fitzgerald JR, Sturdevant DE, MackieSM, Gill SR, Musser JM. 2001. Proc.Natl. Acad. Sci. USA 98:8821–26124. Smoot JC, Barbian KD, Van Gompel JJ,Smoot LM, Chaussee MS, et al. 2002.Proc. Natl. Acad. Sci. USA 99:4668–73125. Cherkasova E, Laassri M, Chizhikov V,Korotkova E, Dragunsky E, et al. 2003.Proc. Natl. Acad. Sci. USA 100:9398–403126. Chizhikov V, Rasooly A, Chumakov K,Levy DD. 2001. Appl. Environ. Microbiol.67:3258–63127. Volokhov D, Chizhikov V, Chumakov K,Rasooly A. 2003. J. Appl. Microbiol. 95:787–98128. Wilson WJ, Strout CL, DeSantis TZ, StilwellJL, Carrano AV, Andersen GL. 2002.Mol. Cell. Probes 16:119–27129. Volokhov D, Chizhikov V, Chumakov K,Rasooly A. 2003. J. Cl<strong>in</strong>. Microbiol. 41:4071–80130. Vora GJ, Meador CE, Stenger DA, AndreadisJD. 2004. Appl. Environ. Microbiol.70:3047–54131. Wang D, Coscoy L, Zylberberg M, AvilaPC, Boushey HA, et al. 2002. Proc. Natl.Acad. Sci. USA 99:15687–92132. Wang D, Urisman A, Liu YT, Spr<strong>in</strong>gerM, Ksiazek TG, et al. 2003. PLoS Biol. 1:E2133. Rota PA, Oberste MS, Monroe SS, NixWA, Campagnoli R, et al. 2003. Science300:1394–99134. Cumm<strong>in</strong>gs CA, Relman DA. 2000.Emerg. Infect. Dis. 6:513–25135. Bryant PA, Venter D, Rob<strong>in</strong>s-Browne R,Curtis N. 2004. Lancet Infect. Dis. 4:100–11136. Chee M, Yang R, Hubbell E, Berno A,Huang XC, et al. 1996. Science 274:610–14137. Hacia JG. 1999. Nat. Genet. 21:42–47138. Cron<strong>in</strong> MT, Fuc<strong>in</strong>i RV, Kim SM, Mas<strong>in</strong>oRS, Wespi RM, Miyada CG. 1996. Hum.Mutation 7:244–55
82 STOUGHTONAnnu. Rev. Biochem. 2005.74:53-82. Downloaded from arjournals.annualreviews.orgby HARVARD UNIVERSITY on 01/31/06. For personal use only.139. Ahrendt SA, Halachmi S, Chow JT, WuL, Halachmi N, et al. 1999. Proc. Natl.Acad. Sci. USA 96:7382–87140. Cutler DJ, Zwick ME, Carrasquillo MM,Yohn CT, Tob<strong>in</strong> KP, et al. 2001. GenomeRes. 11:1913–25141. Wikman FP, Lu ML, Thykjaer T, OlesenSH, Andersen LD, et al. 2000. Cl<strong>in</strong>. Chem.46:1555–61142. Maitra A, Cohen Y, Gillespie SE, MamboE, Fukushima N, et al. 2004. Genome Res.14:812–19143. Fan JB, Chen X, Halushka MK, BernoA, Huang X, et al. 2000. Genome Res.10:853–60144. Kamme F, Zhu J, Luo L, Yu J, Tran DT,et al. 2004. Methods Mol. Med. 99:215–24145. Glanzer JG, Eberw<strong>in</strong>e JH. 2004. Br. J.Cancer 90:1111–14146. Zarr<strong>in</strong>kar PP, Ma<strong>in</strong>quist JK, Zamora M,Stern D, Welsh JB, et al. 2001. GenomeRes. 11:1256–61147. Kl<strong>in</strong>g J. 2003. Nat. Biotechnol. 21:959–60148. Petrico<strong>in</strong> EF, Hackett JL, Lesko LJ, PuriRK, Gutman SI, et al. 2002. Nat. Genet.32(Suppl.):474–79149. Petrico<strong>in</strong> EF, Ardekani AM, Hitt BA,Lev<strong>in</strong>e PJ, Fusaro VA, et al. 2002. Lancet359:572–77150. Neumann E, Thomas J. 2002. Drug Discov.Today 7:S160–62151. Berns K, Hijmans EM, Mullenders J,Brummelkamp TR, Velds A, et al. 2004.Nature 428:431–37152. Brazma A, Park<strong>in</strong>son H, Sarkans U, ShojatalabM, Vilo J, et al. 2003. NucleicAcids Res. 31:68–71153. Edgar R, Domrachev M, Lash AE. 2002.Nucleic Acids Res. 30:207–10154. Rocca-Serra P, Brazma A, Park<strong>in</strong>son H,Sarkans U, Shojatalab M, et al. 2003. C.R. Biol. 326:1075–78155. Baldi P, Hatfield GW, eds. 2002. DNA Microarraysand Gene Expression: from Experimentsto Data Analysis and Model<strong>in</strong>g.Cambridge, UK: Cambridge Univ. Press.213 pp.156. Stekel D, ed. 2003. Microarray Bio<strong>in</strong>formatics.Cambridge, UK: Cambridge Univ.Press. 263 pp.
Annual Review <strong>of</strong> BiochemistryVolume 74, 2005CONTENTSAnnu. Rev. Biochem. 2005.74:53-82. Downloaded from arjournals.annualreviews.orgby HARVARD UNIVERSITY on 01/31/06. For personal use only.FROM PROTEIN SYNTHESIS TO GENETIC INSERTION,Paul Zamecnik 1THE BIOCHEMISTRY OF PARKINSON’S DISEASE,Mark R. Cookson 29APPLICATIONS OF DNA MICROARRAYS IN BIOLOGY,Roland B. Stoughton 53ZONA PELLUCIDA DOMAIN PROTEINS, Luca Jov<strong>in</strong>e, Costel C. Darie,Evel<strong>in</strong>e S. Litscher, and Paul M. Wassarman 83PROLINE HYDROXYLATION AND GENE EXPRESSION,William G. Kael<strong>in</strong> Jr. 115STRUCTURAL INSIGHTS INTO TRANSLATIONAL FIDELITY,James M. Ogle and V. Ramakrishnan 129ORIGINS OF THE GENETIC CODE: THE ESCAPED TRIPLET THEORY,Michael Yarus, J. Gregory Caporaso, and Rob Knight 179AN ABUNDANCE OF RNA REGULATORS, Gisela Storz, Shoshy Altuvia,and Karen M. Wassarman 199MEMBRANE-ASSOCIATED GUANYLATE KINASES REGULATE ADHESIONAND PLASTICITY AT CELL JUNCTIONS, Lars Funke, Srikanth Dakoji,and David S. Bredt 219STRUCTURE, FUNCTION, AND FORMATION OF BIOLOGICALIRON-SULFUR CLUSTERS, Deborah C. Johnson, Dennis R. Dean,Archer D. Smith, and Michael K. Johnson 247CELLULAR DNA REPLICASES: COMPONENTS AND DYNAMICS AT THEREPLICATION FORK, Aaron Johnson and Mike O’Donnell 283EUKARYOTIC TRANSLESION SYNTHESIS DNA POLYMERASES:SPECIFICITY OF STRUCTURE AND FUNCTION, Satya Prakash,Robert E. Johnson, and Louise Prakash 317NOD-LRR PROTEINS: ROLE IN HOST-MICROBIAL INTERACTIONS ANDINFLAMMATORY DISEASE, Naohiro Inohara, Mathias Chamaillard,Christ<strong>in</strong>e McDonald, and Gabriel Nuñez 355v
viCONTENTSAnnu. Rev. Biochem. 2005.74:53-82. Downloaded from arjournals.annualreviews.orgby HARVARD UNIVERSITY on 01/31/06. For personal use only.REGULATION OF PROTEIN FUNCTION BY GLYCOSAMINOGLYCANS—ASEXEMPLIFIED BY CHEMOKINES, T.M. Handel, Z. Johnson, S.E. Crown,E.K. Lau, M. Sweeney, and A.E. Proudfoot 385STRUCTURE AND FUNCTION OF FATTY ACID AMIDE HYDROLASE,Michele K. McK<strong>in</strong>ney and Benjam<strong>in</strong> F. Cravatt 411NONTEMPLATE-DEPENDENT POLYMERIZATION PROCESSES:POLYHYDROXYALKANOATE SYNTHASES AS A PARADIGM,JoAnne Stubbe, Jiam<strong>in</strong> Tian, Aim<strong>in</strong> He, Anthony J. S<strong>in</strong>skey,Adam G. Lawrence, and P<strong>in</strong>ghua Liu 433EUKARYOTIC CYTOSINE METHYLTRANSFERASES, Mary Grace Golland Timothy H. Bestor 481MONITORING ENERGY BALANCE: METABOLITES OF FATTY ACIDSYNTHESIS AS HYPOTHALAMIC SENSORS, Paul Dowell, Zhiyuan Hu,and M. Daniel Lane 515STRUCTURE AND PHYSIOLOGIC FUNCTION OF THE LOW-DENSITYLIPOPROTEIN RECEPTOR, Hyesung Jeon and Stephen C. Blacklow 535COPPER-ZINC SUPEROXIDE DISMUTASE AND AMYOTROPHIC LATERALSCLEROSIS, Joan Selverstone Valent<strong>in</strong>e, Peter A. Doucette,and Soshanna Zitt<strong>in</strong> Potter 563THE STRUCTURE AND FUNCTION OF SMC AND KLEISIN COMPLEXES,Kim Nasmyth and Christian H. Haer<strong>in</strong>g 595ANTIBIOTICS TARGETING RIBOSOMES: RESISTANCE, SELECTIVITY,SYNERGISM, AND CELLULAR REGULATION, Ada Yonath 649DNA MISMATCH REPAIR, Thomas A. Kunkel and Dorothy A. Erie 681GENE THERAPY: TWENTY-FIRST CENTURY MEDICINE, Inder M. Vermaand Matthew D. Weitzman 711THE MAMMALIAN UNFOLDED PROTEIN RESPONSE, Mart<strong>in</strong> Schröderand Randal J. Kaufman 739THE STRUCTURAL BIOLOGY OF TYPE II FATTY ACIDBIOSYNTHESIS, Stephen W. White, Jie Zheng, Yong-Mei Zhang,and Charles O. Rock 791STRUCTURAL STUDIES BY ELECTRON TOMOGRAPHY: FROM CELLSTO MOLECULES, Vladan Lučić, Friedrich Förster,and Wolfgang Baumeister 833PROTEIN FAMILIES AND THEIR EVOLUTION—A STRUCTURALPERSPECTIVE, Christ<strong>in</strong>e A. Orengo and Janet M. Thornton 867